1
A novel index for the study of synergistic effects during the co-processing of coal and biomass 1
Jumoke M. OLADEJO 1, Stephen Adegbite 1, Cheng Heng Pang 2, Hao Liu 3, Ashak M. Parvez 1, Tao Wu2, 4,*
2
1 Department of Chemical and Environmental Engineering, The University of Nottingham Ningbo China, Ningbo
3
315100, China
4
2 Municipal Key Laboratory of Clean Energy Conversion Technologies, The University of Nottingham Ningbo
5
China, Ningbo 315100, China 6
3 Department of Architecture and Built Environment, The University of Nottingham, Nottingham NG7 2RD, The
7 UK 8
4 New Materials Institute, The University of Nottingham Ningbo China, Ningbo 315100, China
9
Corresponding author: [email protected] 10
11
Abstract 12
In this study, synergistic interaction between coal and biomass and its intensity was 13
investigated systematically using a low rank coal and its blends with different biomass 14
samples at various blending ratios. The catalytic effects of minerals originated from biomass 15
were also studied. It was found that some of the minerals existing in the ash derived from 16
oat straw catalysed the combustions process and contributed to synergistic interactions. 17
However, for the coal and rice husk blends, minimal improvements were recorded even 18
when the biomass and coal blending ratio was as high as 30 wt%. Biomass volatile also 19
influenced the overall combustion performance of the blends and contributed to synergistic 20
interactions between the two fuels in the blends. Based on these findings, a novel index was 21
formulated to quantify the degree of synergistic interactions. This index was also validated 22
using data extracted from literature and showed high correlation coefficient. It was found 23
that at a blending ratio of 30 wt% of oat straw in the blend, the degree of synergistic 24
interaction between coal and oat straw showed an additional SF value of 0.25 with non-25
2
This index could be used in the selection of right type of biomass and proper blending ratios 27
for co-firing at coal-fired power stations, which intend to improve combustion performance 28
of poor quality coal by enhancing synergistic interactions during co-processing. 29
Keywords – Fuel characterisation; synergistic interaction; performance index; synergy index; 30
thermogravimetric analysis 31
1.0 Introduction 32
The low cost and carbon lean nature of biomass make it a promising energy alternative for 33
the mitigation of CO2 emissions [1, 2]. However, the technical, economic and socio-ethical 34
issues associated with the large-scale utilization of biomass have hindered its large-scale 35
development [3, 4]. One of the feasible solutions to mitigate these issues is to cofire 36
biomass with coal. This approach has become a general practice in western countries as it 37
offers significant social and environmental benefits such as energy security, energy 38
sustainability, greenhouse gas emission reduction, and economic developments [1]. 39
In the past few decades, extensive research has been carried out in understanding the 40
suitability of coal/biomass blends in various thermochemical conversion processes [5-7]. 41
Synergistic effect was observed for some blends [1, 8] while insignificant additive behaviour 42
was also observed for some other blends [9, 10]. The synergy observed in coal/biomass fuel 43
blends was mainly attributed to both catalytic and non-catalytic synergistic effect of 44
biomass constituents and their influence on the coal during co-firing. The non-catalytic 45
synergistic effect is mainly associated with the high volatile content in biomass while 46
catalytic synergistic effect is dictated by Alkali and Alkali Earth Metals (AAEMs) in biomass 47
which have catalytic impacts on the reactivity of chars derived from coal [11, 12]. 48
3
intensity is dependent on the physical/chemical properties of the fuels, especially the AAEM 50
contents [13]. 51
To date, much effort has been made to understand the influence of AAEMs on the catalytic 52
influence on co-processing of biomass with coal. Many researchers have studied the 53
catalytic performance of ash derived from high temperature ashing process (≥ 550°C) or
54
some ash elements, such as K, Ca and Si [14]. However, some AAEM species are normally 55
released at very low temperatures (<500 °C) [15]. Therefore the use of high temperature ash 56
as catalyst did not show the catalytic effect of AAEMs originated from biomass. So far, not 57
much work has been carried out to show the catalytic effect of minerals in biomass. In 58
addition, although synergistic interactions [1, 8] have been studied greatly in the past few 59
decades, there is not much effort being made to distinguish the contribution of catalytic 60
effect and non-catalytic effect on the overall synergistic interactions occurring, needless to 61
say there is a reliable approach to quantify synergistic interactions and the contribution 62
from catalytic and non-catalytic factors. 63
This paper focuses on the synergistic interactions between coal and biomass in the blends. 64
Thermogravemetric analysis (TGA) was conducted to understand the catalytic effects of 65
minerals (AAEMs) from biomass and the non-catalytic effects of volatile matters on the co-66
processing of biomass with coal. A novel indicator was therefore proposed to evaluate the 67
extent of synergistic interactions as well as to quantify the contribution of catalytic and non-68
4 2.0 Experimental
70
2.1 Coal and Biomass Samples 71
One coal and two types of biomass were used in this research. The coal, Yunnan (YC), was 72
obtained from Fuyuan town (Yunnan Province, China), which is mainly used for industrial 73
process heating especially in wine-making industry. The biomass samples, Oat Straw (OS) 74
and Rice Husk (RH), were chosen to represent agricultural waste and agro-industrial residue 75
respectively due to their abundance globally. 76
2.1.1 Sample Preparation 77
The samples were prepared following standard procedures described elsewhere (BS EN 78
14780 and ISO 13909) [16, 17]. All the samples were initially reduced to a size smaller than 79
500 µm using a cutting mill (Retsch SM 2000, Germany), and further milled to be smaller 80
than 106 µm using a Retsch SM 200 mill. Each biomass was blended with the coal in three 81
mass fractions, i.e., 10, 30 and 50 wt%. 82
2.2 Proximate, Ultimate and Heating Value Analyses 83
Proximate analysis was performed using the thermo-gravimetric analyser (TGA) (STA 449 F3 84
Netzsch, Germany) while ultimate analysis of the samples was conducted using a PE 2400 85
Series II CHNS/O Analyzer (PerkinElmer, USA). In a TGA test, approximately 5 –10 mg of the 86
sample was placed in an alumina crucible following a testing procedure described elsewhere 87
[18, 19] . For ultimate analysis, approximately 1.5 mg of sample was placed in a platinum foil 88
pan. The higher heating value (HHV) of a sample was measured using an IKA Calorimeter 89
C200 (IKA, USA), which utilized approximately 1.0 g of the sample. All experiments were 90
repeated at least three times with the average value used as the final value. 91
5
Mineral composition of the unblended fuels was determined by using an X-ray Fluorescence 93
(XRF) spectrometer, the procedure adopted is described elsewhere [20]. 94
2.4 Thermal Analysis 95
Combustion characteristics of individual fuels and their blends were measured following a 96
non-isothermal method, which was amended from elsewhere [21, 22]. In the test, the 97
sample was heated in air (80 vol% Nitrogen and 20 vol% Oxygen) from 50 to 900 °C at a 98
heating rate of 20 °C min-1 and a gas flow rate of 50 ml min-1. Characterisation of pyrolysis 99
was also conducted using the same technique under pure nitrogen atmosphere (>99.9%). All 100
experiments were repeated at least three times to ensure repeatability and accuracy. 101
The initiation temperature (IT) is the temperature at which 0.3 wt% mass loss rate of the 102
sample was achieved after the release of moisture, which is normally used as an indication 103
of the start of fuel decomposition. In fuel characterisation, the peak temperature (PT) is 104
considered inversely proportional to the reactivity/combustibility of the fuel, which was 105
determined as the temperature where the weight loss (!"!") of the sample reached its 106
maximum. The burnout temperature (BT) represents the end temperature of the burning 107
process, which was determined as the temperature when the rate of burnout (mass loss 108
rate) decreased to less than 1 wt% min-1 on weight basis. The ignition temperature at which 109
the fuel burns spontaneously without external heat source was also obtained based on the 110
method adopted by many others [23]. 111
2.4 Performance Indices 112
The ignition (Zi) and combustion (S) index of the fuel and their blends were calculated based 113
6
Z! =
!" !" !"#
!!!!"# ×10
! (1)
115
S =
!" !" !"#
!"
!" !"
!!!!! × 10
! (2) 116
Where: 117
(!"
!")!"# is the maximum rate of mass loss (% min
-1); 118
(!"!")!" is the average rate of mass loss (% min-1); 119
t!"# is the time at which the peak mass loss rate is attained (min); 120
t! is the ignition time (min); 121
T! is the ignition temperature (°C); 122
T! is the burnout time (min). 123
2.5 Low Temperature Ashing 124
The low temperature ashing of biomass samples was performed using a PR300 Plasma 125
Cleaner (Yamato Scientific, Japan). This device was used to burn off the carbonaceous 126
components of the sample at low temperatures (less than 150⁰C) under which the presence 127
of minerals in biomass remains unchanged. The plasma was generated at a power of 200 W. 128
Approximately 0.5 g of a sample was loaded on a glass crucible, placed in the ashing 129
chamber, and exposed to pure oxygen at a flow rate of 100 ml min-1 to ensure minimal 130
reflection of the plasma beam. Each ashing experiment required 30 hours for the complete 131
7 2.6 Catalytic Effect of Biomass-Derived Ash 133
To understand the influence of minerals from biomass on combustion process, low 134
temperature ash of each biomass was blended with Yunnan coal at a blending ratio 135
equivalent to 30 wt% biomass in blend. The intrinsic reactivity of these blends was carried 136
out. 137
3.0 Results and Discussion 138
3.1 Proximate, Ultimate and Heating Value Analyses 139
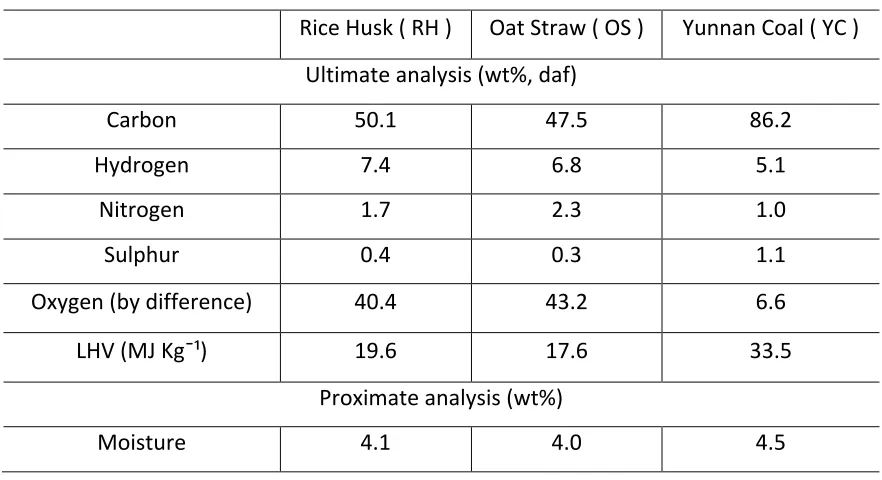
Results of ultimate and proximate analyses of the samples are shown in Table 1. The coal 140
sample showed the highest heating value, which suggests that the blending of coal with 141
biomass of lower energy content would normally lead to the reduction in combustion 142
temperature in existing utility boilers [24]. The Rice Husk had very similar sulphur content 143
(0.4 wt%) but significantly different ash content (21.2 wt%) compared with Oat Straw. Oat 144
[image:7.595.77.518.498.738.2]Straw had the highest volatile matter (72.1 wt%). 145
Table 1 – Ultimate and proximate analysis of samples 146
Rice Husk ( RH ) Oat Straw ( OS ) Yunnan Coal ( YC ) Ultimate analysis (wt%, daf)
Carbon 50.1 47.5 86.2
Hydrogen 7.4 6.8 5.1
Nitrogen 1.7 2.3 1.0
Sulphur 0.4 0.3 1.1
Oxygen (by difference) 40.4 43.2 6.6
LHV (MJ Kg¯¹) 19.6 17.6 33.5
Proximate analysis (wt%)
8
Volatile Matter (VM) 62.8 72.1 27.2
Fixed Carbon (FC) 11.9 17.4 57.3
Ash 21.2 6.5 11
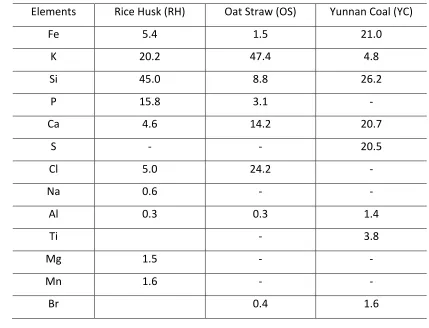
Mineral composition of the samples is illustrated in Table 2. The biomass samples had 147
relatively low sulphur content, which helps mitigate the environmental impacts associated 148
with the emission of sulphur oxides (SOx).Normally, the reaction of AAEMs originating from 149
biomass with SOx could lead to the formation of sulphates which contributes to the capture 150
of gas phase sulphur [25]. This is an important advantage of co-firing of coal with biomass, 151
especially for coals of relatively high sulphur content, such as Yunnan coal. 152
Normally, alkali metals, such as potassium (K) and sodium (Na), and alkali earth metals 153
(AAEMs), such as calcium (Ca) and magnesium (Mg), are known to have catalytic effect to 154
the thermal decomposition of fuels [26]. Table 2 shows the elemental composition of low 155
temperature ash derived from all samples studied. The OS, RH and YC had high AAEM of 156
61.6 wt%, 26.9 wt% and 25.5 wt% respectively. The high potassium content in the OS and 157
RH and the high content of calcium in YC suggest their likelihood of enhancing combustion 158
performance. Another interesting element that has been known to aid the release and 159
activation of these catalytic AAEMs is Cl, which was very high in OS (24.2 wt%) [27]. This 160
further supports the high potential in catalytic effect when OS is blended with YC. However, 161
it was reported that the enhancement could be weakened by the reaction between the 162
catalytic minerals, such as AAEMs, with silicates and/or alumina-silicates [28]. This means 163
that the high Si content in RH (45%) and YC (26.2%) might hinder the catalytic effects of 164
AAEMs. Nonetheless, the potential of enhanced catalytic effects of the YC and OS fuel 165
9
RH might still hinder such improvements for YC and RH blends. In addition, it must be noted 167
that agglomeration and clinkering may arise when a biomass fuel has high Na and K 168
contents as observed in OS due to the formation of sticky low temperature melts of silicate 169
[image:9.595.78.507.225.553.2]eutectics [29]. 170
Table 2 – Mineral composition of the samples (wt%)
171
Elements Rice Husk (RH) Oat Straw (OS) Yunnan Coal (YC)
Fe 5.4 1.5 21.0
K 20.2 47.4 4.8
Si 45.0 8.8 26.2
P 15.8 3.1 -
Ca 4.6 14.2 20.7
S - - 20.5
Cl 5.0 24.2 -
Na 0.6 - -
Al 0.3 0.3 1.4
Ti - 3.8
Mg 1.5 - -
Mn 1.6 - -
Br 0.4 1.6
3.2 Intrinsic Reactivity 172
3.2.1 Reactivity of Individual Fuels
173
The thermal decomposition curves of OS, RH and YC is shown in Figure 1 with key features 174
extracted and summarized in Table 3. It is evident that YC had one major decomposition 175
stage with a strong peak for char burnout while the biomass samples were featured with 176
two main mass loss stages representing the decomposition of organic compounds in the fuel. 177
10
decomposition of hemicellulose, cellulose and partial decomposition of lignin [30]. The 179
second stage represented mainly char burnout as well as the decomposition of lignin and 180
fell in the range of 378 - 518°C. 181
It is showed that the degradation of OS and RH began at 144 and 166 °C respectively. Both 182
samples exhibited an initial slow mass loss from initiation till about 255 °C due to the slow 183
decomposition of lignin content. When temperature was raised above this point, the mass 184
loss rate increased rapidly and reached the peak temperatures of 299 and 309 °C, for OS and 185
RH respectively, attributed mainly to the decomposition of hemicellulose and cellulose. 186
As shown in the DTG curve of RH, the mass loss rate increased immediately after the first 187
reaction zone, while for OS, a flat mass loss region was observed before the second reaction 188
zone which showed a sharp increase in DTG rate. This suggests a lower reactivity of the OS 189
char particles and higher mass loss rate at higher temperatures. 190
[image:10.595.148.449.456.664.2]191
11
The difference in the 2nd stage reactivity could be linked to the catalytic influence of the 193
mineral contents of OS. It was found [31] that catalytic effect of potassium contributed to 194
the clear distinction of the two devolatililization peaks and shifted the first peak 195
temperature to a lower temperature. In this study, it is believed that the high potassium 196
content in OS (as shown in Table 2) enhanced the complete decomposition of lighter 197
volatile species and the release of more volatiles, which subsequently led to the formation 198
of more porous char with higher overall burnout reactivity. 199
YC decomposed at a temperature range between 329 and 605 °C with its only peak 200
appearing at 535 °C and exhibited a more synchronized mechanism of thermal 201
decomposition. In this study, the comparison of the combustion and pyrolysis profiles 202
showed that 83 wt% (RH) and 97 wt% (OS) of total volatiles in biomass samples were burnt 203
during the first reaction stage as an indication of its homogenous (gas-phase) ignition 204
mechanism. This is relatively unclear for YC due to its singular peak as its degradation curve 205
could be indicative of the simultaneous combustion of both volatiles and char over a wider 206
temperature range. 207
From the pyrolysis profiles shown in Figure 2, it is evident that the devolatilization of YC 208
occurred at higher temperatures (355 – 571 °C) compared with OS (146-489 °C) and RH (168 209
– 486 °C). The low pyrolysis rate and the high temperature required for YC could signify an 210
increase in resistivity of volatile release in the organic structure. The pyrolysis mass loss rate 211
of the biomass samples remained close to that of the combustion profile, which can be 212
explained by their high combustibility and reactivity of the volatile matter [32]. 213
The decreasing peak temperatures of the biomass samples during combustion as shown in 214
12
However this reduction in the peak temperature is not obvious in Figure 2a because of its 216
low volatile content of YC. 217
218
219
220
a .
b
13
Figure 2: Pyrolysis and combustion profiles of (a) Yunnan coal, (b) Rice Husk, and, (c) Oat 221
Straw 222
Normally, higher oxygen content of the biomass samples is an indicator of their high 223
reactivity [33]. Among these three fuels studied, the most reactive fuel is OS with oxygen 224
content of 43.2 wt% as shown in Table 1. The high oxygen content and high oxygen/carbon 225
ratio led to the formation of char with higher reactivity [19]. Likewise, the high volatile and 226
low fixed carbon content of biomass resulted in the yield of a small amount of highly porous 227
char, which subsequently contributed to the high overall reactivity of the fuel. 228
For RH, OS and YC, the ratio of volatile matter to fixed carbon, another indicator of 229
combustion reactivity, is 5.3, 4.2 and 0.48 respectively. This ratio is an indicator of the fuel’s 230
volatility, a ratio >4 suggests homogenous oxidation of the volatiles while a ratio smaller 231
than 1 indicates heterogeneous gas-solid reactions [22]. Therefore, the combustion of RH 232
and OS was predominantly the gaseous phase oxidation of its volatiles while for YC it was 233
[image:13.595.68.526.531.745.2]the simultaneous oxidation of both volatiles and char. 234
Table 3– Combustion characteristics of Rice husk, Yunnan coal and their blends 235
Property RH
50 wt%YC+
50 wt%RH
70 wt%YC+
30 wt% RH
90 wt%YC+
10 wt%RH YC
Initiation Temperature
(°C) 166 192 222 222 329
Fi
rs
t Re
ac
tio
n
Zo
ne
Temperature range
(°C) 166 - 370 192 - 369 222 - 356 286 - 608 329 - 605
Peak Temperature
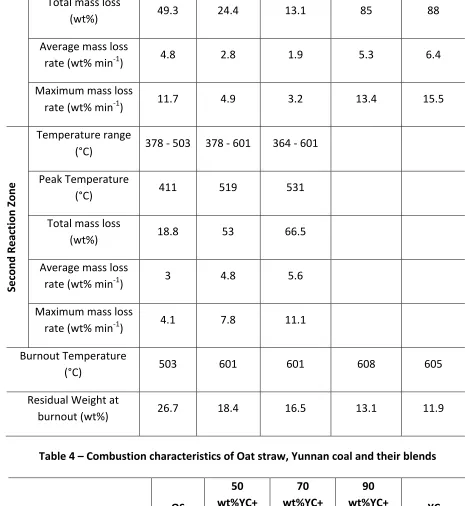
14 Total mass loss
(wt%) 49.3 24.4 13.1 85 88
Average mass loss
rate (wt% min-1) 4.8 2.8 1.9 5.3 6.4
Maximum mass loss
rate (wt% min-1) 11.7 4.9 3.2 13.4 15.5
Se
co
nd
Re
ac
tio
n
Zo
ne
Temperature range
(°C) 378 - 503 378 - 601 364 - 601
Peak Temperature
(°C) 411 519 531
Total mass loss
(wt%) 18.8 53 66.5
Average mass loss
rate (wt% min-1) 3 4.8 5.6
Maximum mass loss
rate (wt% min-1) 4.1 7.8 11.1
Burnout Temperature
(°C) 503 601 601 608 605
Residual Weight at
[image:14.595.60.525.78.584.2]burnout (wt%) 26.7 18.4 16.5 13.1 11.9
Table 4 – Combustion characteristics of Oat straw, Yunnan coal and their blends 236
OS
50 wt%YC+
50 wt%OS
70 wt%YC+
30 wt%OS
90 wt%YC+
10 wt%OS
YC
Initiation Temperature (°C) 144 162 201 244 329
Fi
rs
t Re
ac
tio
n
Zo
ne Temperature range (°C) 144 - 420 162 - 346 201 - 345 244 - 334 329 - 605
Peak Temperature (°C) 299 299 301 305 535
Total mass loss (wt%) 65 27.4 13.1 6 88
15 (wt% min-1)
Maximum mass loss rate
(wt% min-1) 13.9 7.2 2.9 1.8 15.5
Se
co
nd
Re
ac
tio
n
Zo
ne
Temperature range (°C) 432 - 518 349 - 564 353 - 583 339 - 591
Peak Temperature (°C) 474 456 483 515
Total mass loss (wt%) 17.6 58.1 68.7 79.9
Average mass loss rate
(wt% min-1) 4.1 5.4 5.9 6.3
Maximum mass loss rate
(wt% min-1) 6.8 8.7 11.1 13.9
Burnout Temperature (°C) 518 564 583 591 605
Residual Weight at burnout
(wt%) 11.8 11.2 14.2 10.5 11.9
3.2.2 Combustion Characteristics of the Blends 237
Combustion characteristics of the YC/RH blends are presented in Figure 3 and Table 3. 238
[image:15.595.139.464.471.699.2]239
16
Generally speaking, the blends featured two peaks. However, the first peak was not fully 241
developed for the blend with 10 wt% RH. As previously described by others [34], the first 242
peak temperature of the blend was similar to the first peak temperature of the biomass, i.e. 243
rice husk (309°C), while the second peak temperature and burnout temperature were 244
similar to the peak (535 °C ) and burnout temperatures (605 °C) of the Yunnan Coal with 245
minimal deviations. The maximum rate of degradation of the first peak increased with the 246
increase in the RH, while for the second stage, the rate reduced with the increase in RH. This 247
occurrence was due to the combustion of biomass volatiles prevailing in the first reaction 248
zone, while the coal char burning dominated the second reaction zone [35]. It was also 249
observed that the residual weight at burnout temperature increased with the increase in RH 250
due to the high ash content, which might present extra barrier for heat and mass transfer. 251
Similar to YC/RH blends, the YC/OS blends, as shown in Figure 4 and Table 2, had two distinct 252
peaks. However, there was a noticeable decrease in the peak temperature with the increase 253
in oat straw. Since the peak and burnout temperature of OS were lower than those of YC. 254
This reduction in the 2nd peak temperature indicated improved combustion reactivity as a 255
result of synergistic interactions between coal and biomass as shown in in Figure 4b. To 256
further prove the presence of synergy, the experimental results were compared with the 257
theoretical values calculated using the weighted sum of the pure feedstock [36]. The result 258
obtained for the oat straw blend showed distinct shift of the 2nd reaction stage towards 259
lower temperatures compared with theoretical values. However, the theoretical and 260
experimental values of rice husk blends were similar when the blending ratio was below 30 261
17
Synergistic interactions can be associated with catalytic and/or non-catalytic mechanisms. 263
The latter involves the formation of free radicals and hydrogen transfer from biomass to coal 264
while the former is based on catalytic effect of alkali and alkali earth metals present in 265
biomass or coal [37]. Consequently, the synergy observed in YC/OS blends could be partially 266
attributed to the catalytic effect of mineral matters in oat straw due to its high alkali metal 267
content, a common occurrence in herbaceous biomass [14, 31, 38]. This could be 268
supplemented by the non-catalytic improvement caused by the interactions of biomass 269
volatiles with coal char as well as the differences in morphology [39]. The release of volatiles 270
from biomass could result in the formation of free radicals during thermal reaction to 271
promote the breakdown of the dense and heat-resistive coal structural components 272
(polycyclic aromatic hydrocarbon bonded by aromatic rings) at lower temperatures [40, 41]. 273
Therefore, the higher hydrogen-carbon mole ratio (H/C) of biomass in blends contributed to 274
the improvements observed in coal decomposition [42, 43]. The existence of synergy was 275
quite contentious, as synergistic interaction is not observed in all coal/biomass blends in the 276
first place. However synergistic enhancement was observed in coal and biomass fuel blends 277
even after the demineralisation of its biomass, eliminating catalytic effect of ash as the only 278
cause of synergy [31]. 279
At low blending ratios, such as 10 wt% to 30 wt%, peak temperature of each reaction zone 280
was dominated by the fuel fraction with the higher mass loss. This mechanism of 281
decomposition is an indication of independent decomposition of both fuels, which suggests 282
the additive behaviours instead of synergistic interactions between YC and RH, which is 283
similar to what was reported by others [44]. However, slight reduction in the peak 284
18
suggested some interactions between YC and RH. This can only be attributed to the increase 286
in volatiles available from 50% RH and its impacts on non-catalytic synergy mechanism. 287
288
[image:18.595.120.471.177.394.2]289
Figure 4: DTG curve of Yunnan coal /oat straw blends 290
Taking into account the findings for both biomass blends, it can be concluded that the 291
presence of synergy, its extent and the mechanism are dependent on biomass types, 292
blending ratio and properties. 293
3.3 Ignition Temperature 294
The ignition temperatures (Ti) of the fuels are shown in Table 5, which were determined 295
following the method described elsewhere [8]. The ease of ignition of the biomass samples 296
is a consequence of their high volatile content (>80 wt%) as shown in Table 1. The ignition 297
temperature of YC was almost 200 °C higher than those of the biomass samples, which 298
19
However the main mass loss of the blends was characterised by the 2nd peak temperature, 300
which more accurately depicted the effect of biomass addition on the oxidation of coal. 301
Hence, a “trigger temperature” was also extracted from the TGA profiles for the 2nd reaction 302
stage to characterise the ignition of the char oxidation, which is the temperature 303
corresponding to the intersection of the tangent line of the initial mass loss curve (before 304
the sharp drop in mass) and the tangent line that is drawn at the intersection of the vertical 305
line through the 2nd Peak temperature and the mass loss curve [23]. 306
The ignition points of YC/RH and YC/OS blends were slightly higher (<20 °C) than the ignition 307
temperature of the OS (256 °C) and RH (266 °C) in the blend. This suggests weak interactions 308
between fuels in the blends. The 10 wt% RH blend remained close to the ignition 309
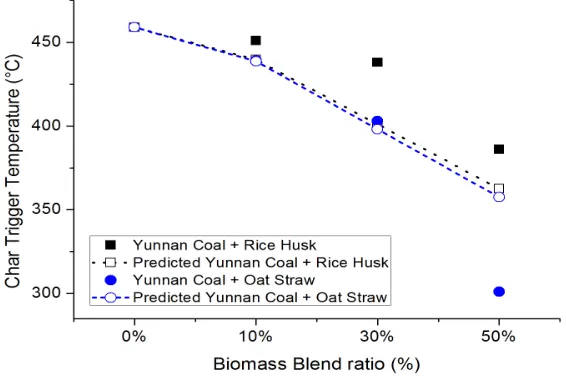
temperature of YC due to the immature first peak as seen in Figure 3a. However, the trigger 310
temperatures reduced significantly compared with that of YC (459 °C). The changes in 311
trigger temperature with blending ratio are shown in Figure 5 with the dotted lines 312
representing predictions based on additive behaviours. The blends exhibited a slow drop 313
between 10 and 30 wt%, followed by a sharp drop in this temperature between the 30 and 314
50 wt%. The 50 wt% OS blends exhibited the largest temperature decrease. These changes 315
in ignition parameter are the result of interactions between individual fuels in the blends. 316
Table 5 – Ignition temperature of individual fuels and their blends 317
Sample Main Ignition
Temperature (°C)
Char Trigger Temperature (°C)
100%RH 266
90 wt% YC+10 wt% RH 451 451
70wt% YC+30 wt% RH 272 438
20
100%OS 256
90 wt% YC+10 wt% OS 271 439
70 wt% YC+30 wt% OS 256 403
50 wt% YC +50 wt% OS 259 301
100 % YC 459
The char trigger temperatures were also compared with theoretical values calculated from 318
ignition temperatures of the parent fuels assuming that additive property applies. These 319
calculated values are presented as the dashed lines in Figure 5. For YC/RH blends, the actual 320
trigger temperature was higher than predicted values. For YC/OS blends, the change of 321
trigger temperature of 10-30 wt% blends were relatively linear while for the 50 wt% blend, 322
it exhibited some improvements and lead to a lower temperature. 323
The changes in the ignition and char trigger temperatures were believed to be the 324
consequence of the interactions between the organic elements of the different fuels in the 325
blend [8, 23]. This non-catalytic synergy might be linked to the increase in volatile matter 326
content of the blends due to biomass addition. 327
[image:20.595.157.440.503.694.2]328
21
To quantify the influence of blending on ignition and combustion performance, the ignition 330
(Zi) and combustion (S) index of individual fuels and their blends were calculated using 331
Equations (1) and (2) and are presented in Table 6. As shown in Table 6, OS showed the best 332
ignition property while YC was the most difficult to ignite. The ignition index increased with
333
the increase in biomass percentage for all oat straw blends and the 30 wt% RH blend, this is
334
in line with the decrease in ignition temperature and ignition time. This suggests that the
335
ignition properties of Yunnan coal were improved by blending with oat straw or rice husk at
336
certain blending ratios due to the interaction between the fuels. However, insignificant 337
improvement in ignition index was observed for 10 wt% and 50 wt% RH blends. 338
As can be seen in Equation (2), the combustion index was dependent on peak mass loss rate, 339
peak and Ignition time; hence for the 10 wt% RH blend, it had similar ignition and peak time 340
with YC. However, the peak mass loss rate was reduced. Similarly, the reduction in the peak 341
mass loss rate of the 2nd reaction zone of the 50 wt% RH blend hindered the increase in the 342
ignition index. In comparison to the OS blend, this trend for RH blends could be associated 343
with the high ash content of RH, which reduced the amount of organic matter available for 344
interaction with YC. It can be seen that among the blends, the 10 wt% OS blend had the best 345
ignition index while the 10 wt% RH blend had the worst. This is consistent with what was
346
found for coal and tobacco residues blends, a nearly linear increase in ignition index with 347
increase in biomass due to the high volatile content of the biomass [53]. 348
Table 6 – Performance Parameters of Individual fuels and their blends 349
RH OS YC 90% YC+10 wt% RH
70% YC+30 wt% RH
50 wt% YC+ 50 wt% RH
90% YC+10 wt% OS
70% YC+30 wt% OS
50 wt% YC+ 50 wt% OS
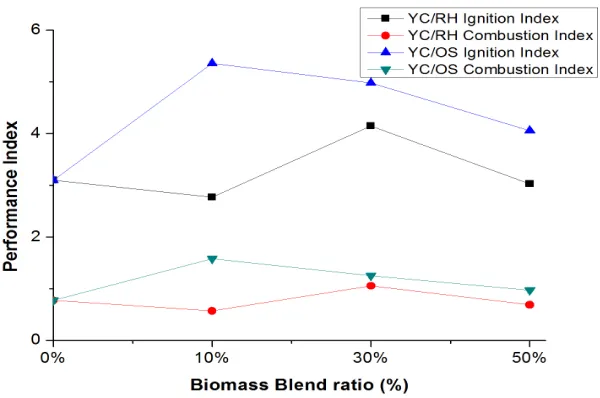
Zi (%/min³) 8.4 10.9 3.1 2.8 4.2 3.0 5.4 5.0 4.1
22 (%²/°C³min²)
The combustion index also suggested that OS was the most reactive. Improvement in 350
combustion performance was observed for the 30 wt% RH and all YC/OS blends. The 351
reduction in combustion index observed in the 10 wt% RH blend can be explained by 352
Equation (2). As mentioned earlier, the 10 wt% RH blend was featured with a single reaction 353
stage at 286 – 608 °C. This indicates a longer residence time required for attaining a desired 354
burnout in comparison with Yunnan coal which burnt out completely between 329 – 605 °C. 355
This suggests the absence of improvement in the combustion performance for 10 wt% RH in 356
comparison with Yunnan Coal. The reductions in the maximum (7.8 wt% min-1) and average 357
mass loss rate (3.8 wt% min-1) of the 50 wt% RH blend due to its double peaks could be 358
interpreted as a reduction in the overall fuel reactivity if this combustion index was used for 359
comparison. This is explained by the high value of the mass loss rates for YC with a peak of 360
15.5 wt% min-1 and a mean mass loss of 6.4 wt% min-1. 361
Normally, the combustibility of any fuel is inversely proportional to the maximum 362
decomposition rate temperature [45]. Similarly, the decrease in the 2nd peak temperature of 363
the OS blends illustrated an improvement in combustion performance. The enhancement in 364
the burnout of the fuels was represented by the small decrease in the burnout 365
temperatures with the maximum decrease of 6.7% for the 50 wt% OS blend, which is 366
23 368
Figure 6: Changes in performance index of fuel blends 369
Although the combustion and ignition indices (as shown in Figure 6) can be used to show 370
the interactions between individual fuels during co-processing, the accuracy of these indices 371
may be compromised due to the split of the weight loss into two reaction zones as the 372
average and maximum weight loss reduces more rapidly with the increase in blending ratio 373
compared with time and temperature. Therefore, there is a need to develop a novel index 374
to take into account the two reaction zones or the reaction zone exhibiting more synergistic 375
characteristics, thereby improve its reliability and ensure the results are representative of 376
the entire combustion process. 377
3.4 Catalytic Effect of Biomass Minerals 378
In this study, the influence of the minerals from biomass on the co-combustion 379
characteristics of the blends was studied. Low temperature ash of Oat Straw and Rice husk 380
were blended with YC to compare with the curve obtained for 30 wt% biomass and 70 wt% 381
YC, as shown in Figure 7 and Table 7. The 70 wt% YC and 30 wt% biomass was chosen as a 382
reference due to the improvement in ignition and combustion index were noticed in the 383
24
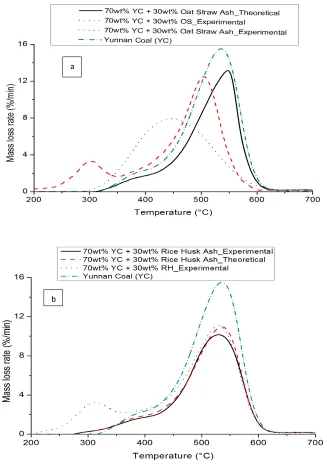
The results clearly showed changes in the characteristics of the 30 wt% OS ash blend which 385
led to a lower ignition temperature of 403 °C, a lower peak temperature of 486 °C and a 386
lower burnout temperature of 575 °C compared with those of 100% YC. The PT and BT vary 387
significantly from the additive data. 388
389
[image:24.595.136.463.198.666.2]390
Figure 7: DTG curves of experimental and theoretical data of 100% YC and (a) 30 wt% Oat 391
Straw ash & 30 wt% Oat Straw; (b) 30 wt% Rice Husk ash & 30 wt% Rice Husk 392
a
.
25
The variations in the ignition, peak and burnout temperatures could be explained to some 393
extent by the catalytic effect of the AAEMs originated from biomass such as Oat Straw. The 394
catalytic effect of AAEMs was found to be in order of Na > K > Ca [47]. As shown in Table 2
395
OS contained significant amount of AAEMs, which was greater than that of RH. The 396
investigation on the thermal behaviour of the low temperature ash derived from Oat Straw 397
(as illustrated in Figure 8) showed a mass loss of 17.6 wt% in a temperature range of 473-398
573 °C, which peaked at 552 °C. This mass loss was attributed mainly to the release of 399
volatile AAEMs compounds at high temperatures such as K+, KCl and or KOH. The initial 400
volatile inorganic release temperature (552 °C) is lower than the burnout temperature of OS 401
(518 °C), which suggests that AAEMs acted as catalyst for the burnout of OS. Even at a 402
temperature higher than 573°C, there was still significant amount of AAEMs remaining as 403
catalyst for YC char combustion (burnout temperature is 605 °C) as only 17.6 wt% mass loss 404
upon heating while the initial mass fraction of potassium for OS low temperature ash was 405
47.4 wt% (as shown in Table 2). This is consistent with what was reported [15] that the 406
release of a small fraction (<20 wt%) of the organically bonded alkali metals occurred at 407
temperatures up to 800 °C. In this study, the high potassium and calcium content in OS 408
explains the reduction in the burnout temperature of 30 wt% Oat Straw ash blend from 605 409
to 575 °C. This reduction in burnout temperature was also evident in all the YC/OS blends. 410
The high AAEMs content in both OS and RH contributed to the reduction in char burnout 411
temperature of the fuel blends. 412
Table 7 – Combustion characteristics of YC blended with low temperature ash of biomass 413
Sample
Ignition Temp
(°C)
Peak Temp
(°C)
Total degradation
(wt%)
Average degradation
(wt%/min)
Maximum degradation rate (wt%/min)
Burnout Temp
26
Yunnan Coal 459 535 88 6.4 15.5 605
70%YC + 30 wt%
Rice Husk ash 454 529 61.7 4.2 10.1 601
70%YC + 30 wt%
Oat Straw ash 403 486 64.2 5.2 10.0 575
[image:26.595.65.512.69.426.2]414
Figure 8: DTG of Oat Straw low Temperature ash 415
The peak temperature and burnout temperature of the 30 wt% RH Ash blend was 416
comparable with that of 100 wt% YC. Likewise, the ignition temperature of the 30 wt% RH 417
ash blend was similar to that of 100 wt% YC. This confirmed the absence of catalytic 418
improvement when YC was blended with RH ash. Therefore, the synergistic interactions 419
observed for RH (reductions in trigger temperature as shown in Table 3) could not be 420
attributed to catalytic synergy for RH and are closely related to non-catalytic effects 421
primarily linked to high volatile content and subsequently high char porosity. 422
Nonetheless, results of the 30wt% oat straw and coal blend did not distinguish the effect of 423
volatiles and minerals although it proved the existence of strong synergy between the two 424
27
the influence of minerals originated from oat straw on co-firing. A PT of 528 °C and a BT of 426
588 °C were observed as shown in Figure 9, which were 7 °C and 17 °C lower than those of 427
the coal respectively. This demonstrated a modest catalytic of the minerals in oat straw. As 428
previously mentioned, the PT and BT were 483 °C and 583 °C respectively for the 30 wt% OS 429
blend, it can therefore be concluded that for 30 wt% OS blend, the significant synergistic 430
effect could be attributed to the non-catalytic synergy by the organic content of the oat 431
straw and the catalytic activity of ash. 432
[image:27.595.155.443.287.483.2]433
Figure 9: DTG of experimental and theoretical 30wt% oat straw and 2wt% oat straw ash 434
blend 435
3.5 Synergy Indicator 436
In this study, it is clear that factors, such as biomass blending ratio, biomass ash properties, 437
volatile content, contributed to strong synergistic interactions between coal and biomass. 438
Each factor affects the synergy observed in the blends to some degree. To select proper 439
biomass for co-processing with coal and to determine the proper blending ratio to enhance 440
28
need to develop a novel index, which can also be used to evaluate the different impacts of 442
catalytic and non-catalytic effects. 443
Synergy index [48] proposed by others was solely a function of the reaction time to reach 95% 444
conversion where larger magnitude of the index indicates greater degree of synergy. In this 445
study, it is clear that the main synergistic improvement include the reduced 2nd peak and 446
burnout temperatures, as shown in the line chart in Figure 10. These observations have 447
been linked partially to the catalytic effects of biomass inorganic content as described in 448
section 3.4 and secondarily, to the non-catalytic effects of biomass organics (high volatiles 449
and char structure). Therefore, the three characteristic factors, i.e., peak temperature, 450
burnout temperature and time to peak of the second reaction stage, which have direct 451
influence on combustion performance, are used as the parameters for the novel synergy 452
index. 453
[image:28.595.145.447.449.656.2]454
Figure 10: Improvements in peak and burnout temperatures with biomass blending 455
Consequently, the extent of synergistic interaction between the coal and biomass fuel can 456
29
temperatures of the second reaction zone as well as the time taken. In this study, a novel 458
synergy factor was developed, which is expressed as Equations (3). 459
SF = !"!"#!"
!"!"#$ (3)
460
Where SI is a synergy indicator (°C-3 min-1/2) and can be calculated using Equation (4): 461
SI = !
!!!!!.!!!!!!
× 10! (4)
462
Where, t!!! is the time difference between the start and peak of the second reaction zone 463
(min); T! is the peak temperature (⁰C); T! is the burnout temperature (⁰C). 464
Using this index, a comparison baseline was created using the result extracted from the 465
theoretical blends models to determine whether fuel blend establishes a more synergistic 466
effect (SF > 1.15) or additive behaviour (0.8 ≤ SF ≤ 1.15). However, a value of SF ≤ 0.8 467
suggests deteriorated combustion performance after blending. The synergy factors for the 468
Yunnan coal and biomass blends discussed above are shown in Figure 11. 469
It can be seen that the synergy factor increased with the increase in blending ratio; however 470
the rate of increase with biomass blend ratio were different for different blends. For the 30 471
wt% biomass blends (as shown in Figure 6), the most significant synergistic effect occurred 472
for 70 wt% Yunnan coal + 30 wt% oat straw with a synergy factor of 1.50. The 70 wt% 473
Yunnan coal + 30 wt% rice husk blend showed additive behaviour and had an SF of 1.13. For 474
the 10 wt% biomass blends, the YC/RH blend exhibited additive behaviour, which was 475
mainly due to the insufficient amount of AAEMs to catalyse combustion process. Based on 476
these results, it can be concluded that for blends with 30 wt% of biomass, oat straw showed 477
30
blend was due to the existence of significant amount of catalytic species resulting in greater 479
enhancement in combustion. 480
In this study, assuming an additive behaviour, for 70% YC and 30 wt% OS , the SF is of a 481
value of 1.15. The SF of 70 wt% YC and 2 wt% OS ash was found to be 1.24, which suggests 482
that catalytic synergy resulted in a SF change by 0.09. The difference between the SF value 483
(S.F = 1.40) of 70% YC and 30 wt% OS and that of 70 wt% YC and 2 wt% OS ash (SF = 1.24) 484
could be attributed to volatile effect (non-catalytic synergy) and resulted in a SF change of 485
0.16. Likewise, the non-catalytic synergy detected in the 50wt% RH blend (SF = 1.26) could 486
be attributed to its volatile content, which affected reaction time, and characteristic 487
temperature at higher blend ratio, and resulted in an increase in SF by 0.11 due to non-488
catalytic synergy. 489
[image:30.595.138.449.416.639.2]490
Figure 11: The Synergy indicator of Yunnan coal blends 491
Table 8 – Validation of Synergy Factors using Reported Data 492
31
Biomass types 0% 10% 30% 50%
Australian Coal (AC) blends[49]
Gumwood (GW) 1.00 1.19 1.27 1.43
Poplar (PP) 1.00 1.16 1.26 1.38
Rosewood (RW) 1.00 1.18 1.34 1.57
Mengxi Coal (MC) blends[49]
Gumwood (GW) 1.00 1.18 1.35 1.41
Poplar (PP) 1.00 1.26 1.39 1.38
Rosewood (RW) 1.00 1.31 1.80 1.67
Australian Coal (AC) blends [50]
Oat Straw (OS) 1.00 1.11 1.36 Printed circuit
board (PCB) 1.00 1.03 1.23
Rubber 1.00 0.95 1.02
[image:31.595.87.510.70.365.2]Polystyrene (PS) 1.00 1.39 1.40
Figure 11 shows the synergy factor as a function of the biomass content of the blend 493
(regression function R2 value ≥0.96). This is in line with past notions that the synergistic 494
interaction that occurred in fuel blends is a function of the organic and inorganic content of 495
the biomass, hence proportional to the portion of biomass introduced into the blend. 496
Nonetheless, the extent of enhancement remained dependent on the constituents of the 497
biomass sample used. 498
In order to verify this index, combustion data of Australian and Mengxi coal with biomass 499
blends were collated from literature [49, 50], which are illustrated in Table 8. Based on the 500
SF values, for all coal and biomass blends, significant synergistic interactions exist. As for 501
Australian Coal and Rubber, due to the lack of AAEMs in Rubber, which led to lack of 502
catalytic effects for combustion process, there was no noticeable synergistic effects 503
(SF<1.15) being observed. However, for Australian Coal and PCB blends, at high blending 504
ratio, catalytic effects became obvious, which led to significant synergistic interactions 505
32
authors found in their study and therefore proved the validity of the synergy factor 507
proposed in this study. 508
It was also reported [14] that the presence of an optimal improvement level for all fuel 509
blends, beyond which synergy was independent of the biomass blending ratio, which 510
suggests that the improvement of the blended fuels might plateau or even decrease after 511
certain blending ratio [14]. This is also confirmed by the lower SF values for 50 wt% Poplar 512
/MC and 50 % Rosewood/MC blends compared with the blends with only 30 wt% of 513
biomass 514
4.0 Conclusions . 515
In this study, the co-firing of Yunnan coal with AAEMs-rich Oat Straw demonstrated strong 516
synergistic interaction by the reductions in 2nd Peak and burnout temperatures. It is found 517
that AAEMs from biomass acted as catalysts for coal combustion, enabling catalytic synergy, 518
which is biomass dependent. Non-catalytic synergistic interactions were also evident at 519
higher blending ratios, which was mainly attributed to the higher amount of volatiles. 520
A novel synergy factor (SF), which showed a good correlation coefficient, was proposed to 521
quantify the synergistic effects and to distinguish catalytic effect from non-catalytic effect. 522
This index can be used as a tool to predict synergistic effect during co-processing, which is of 523
significant importance for optimizing blending ratio for existing boilers and for the design of 524
new co-firing plant to avoid operation issues. This index also offers opportunities for 525
selecting proper biomass for co-firing with poor quality coal to enhance the overall 526
combustion performance. 527
33
Part of this work was sponsored by Ningbo Bureau of Science and Technology under its Innovation 529
Team Scheme (2012B82011) and Major R&D Programme (2012B10042). The International Doctoral 530
Innovation Centre is also acknowledged for the provision of a full scholarship to the first author. 531
References 532
[1] Howaniec N, Smolinski A. Steam co-gasification of coal and biomass - Synergy in reactivivty of 533
fuel blends chars. Int J Hydrogen Energy. 2013:16152 - 60. 534
[2] Chen X. Economic potential of biomass supply from crop residues in China. Appl Energy. 535
2016;166:141-9. 536
[3] De Laporte AV, Weersink AJ, McKenney DW. Effects of supply chain structure and biomass prices 537
on bioenergy feedstock supply. Appl Energy. 2016;183:1053-64. 538
[4] Li J, Brzdekiewicz A, Yang W, Blasiak W. Co-firing based on biomass torrefaction in a pulverized 539
coal boiler with aim of 100% fuel switching. Applied Energy. 2012;99:344-54. 540
[5] Nian V. The carbon neutrality of electricity generation from woody biomass and coal, a critical 541
comparative evaluation. Appl Energy. 2016;179:1069-80. 542
[6] Zhang Q, Li Q, Zhang L, Wang Z, Jing X, Yu Z, et al. Preliminary study on co-gasification behavior of 543
deoiled asphalt with coal and biomass. Appl Energy. 2014;132:426-34. 544
[7] Sahu SG, Chakraborty N, Sarkar P. Coal-biomass co-combustion: An overview. Renewable and 545
Sustainable Energy Reviews. 2014:575 - 86. 546
[8] Vamvuka D, Sfakiotakis S. Combustion behaviour of biomass fuels and their blends with lignite. 547
Thermochim Acta. 2011;526:192-9. 548
[9] Karampinis E, Nikolopoulos N, Nikolopoulos A, Grammelis P, Kakaras E. Numerical investigation 549
Greek lignite/cardoon co-firing in a tangentially fired furnace. Appl Energy. 2012;97:514-24. 550
[10] Lester E, Gong M, Thompson A. A method for source apportionment in biomass/coal blends 551
using thermogravimetric analysis. J Anal Appl Pyrolysis. 2007;80:111–7. 552
[11] Chen W-H, Wu J-S. An evaluation on rice husks and pulverized coal blends using a drop tube 553
furnace and a thermogravimetric analyzer for application to a blast furnace. Energy. 2009;34:1458-554
66. 555
[12] Sjostrom K, Chen G, Yu Q, Brage C, Rosen C. Promoted reactivity of char in co-gasification of 556
biomass and coal: synergies in the thermochemical process. Fuel. 1999:1189 - 94. 557
[13] Kastanaki E, Vamvuka D. A comparative reactivity and kinetic study on the combustion of coal - 558
biomass char blends. Fuel. 2006:1186-93. 559
[14] Rizkiana J, Guan G, Widayatno WB, Hao X, Huang W, Tsutsumi A, et al. Effect of biomass type o 560
the performance of cogasification of low rank coal with biomass at relatively low temperatures. Fuel. 561
2014:414-9. 562
[15] Van Lith SC, Jensen PA, Frandsen FJ, Glarborg P. Release to the Gas Phase of Inorganic Elements 563
during Wood Combustion. Part 2: Influence of Fuel Composition. Energy & Fuels 2008;22: 1598-609 564
[16] BS BS. Solid Biofuels. Sample Preparation. UK: BS; 2011. 565
[17] ISO IOfS. Coal. Preparation of test samples Switzerland: ISO; 2014. 566
[18] Yan J, Shi K, Pang C, Lester E, Wu T. Influence of minerals on the thermal processing of bamboo 567
with a suite of carbonaceous materials. Fuel. 2016;180:256-62. 568
[19] Wu T, Gong M, Lester E, Hall P. Characteristics and synergistic effects of co-firing of coal and 569
carbonaceous wastes. Fuel. 2013;104:194-200. 570
[20] Yan J, Shi K, Pang C, Lester E, Wu T. 2016;- 180:- 262. 571
[21] Pang CH, Gaddipatt S, Tucker G, Lester E, Wu T. Relationship between Thermal Behaviour of 572
Lignocellulosic Components and Properties of Biomass. Bioresour Technol. 2014;172:312-20. 573
[22] Wang C, Wang F, Yang Q, Liang R. Thermogravimetric studies of the behavior of wheat straw 574
34
[23] Li X-g, Ma B-g, Xu L, Hu Z-w, Wang X-g. Thermogravimetric analysis of the co-combustion of the 576
blends with high ash coal and waste tyres. Thermochim Acta. 2006;441:79-83. 577
[24] Grote K-HA, EK;. Springer Handbook of Mechanical Engineering. New York: Springer Science & 578
Business Media; 2009. 579
[25] Ross AB, Jones JM, Cbaiklangmuang S, Pourkashanian M, Williams A, Kubica K, et al. 580
Measurement and Prediction of the Emissions of Pollutants from the Combustion in a Fixed Bed 581
Furnace. Fuel. 2002:571 - 852. 582
[26] Tchapda AH, Pisupati SV. A Review of Thermal Co-Conversion of Coal and Biomass/Waste. 583
Energies. 2014:1098-148. 584
[27] Shao Y, Wang J, Xu C, Zhu J, Preto F, Tourigny G, et al. An experimental and modeling study of 585
ash deposition behaviour for co-firing peat with lignite. Appl Energy. 2011;88:2635-40. 586
[28] Habibi R, Kopyscinski J, Masnadi MS, Lam J, Grace JR, Mims CA, et al. Co-gasification of biomass 587
and non-biomass feedstocks: Synergistic and inhibition effects of switchgrass mixed with sub-588
bituminous coal and fluid coke during CO2 gasification. Energy Fuels. 2012:494–500. 589
[29] Akram M, Tan CK, Garwood DR, Fisher M, Gent DR, Kaye WG. Co-firing of pressed sugar beet 590
pulp with coal in a laboratory-scale fluidised bed combustor. Appl Energy. 2015;139:1-8. 591
[30] Avila C, Pang CH, Wu T, Lester E. Morphology and reactivity characteristics of char biomass 592
particles. Bioresour Technol. 2011;102:5237-43. 593
[31] Nowakowski DJ, Jones JM, Brydson RMD, Ross AB. Potassium catalysis in the pyrolysis behaviour 594
of short rotation willow coppice. Fuel. 2007;86:2389-402. 595
[32] Zheng GK, JA;. Thermal events occurring during the combustion of biomass residue. Fuel. 596
2000:181-92. 597
[33] Xiao H-m, Ma X-q, Lai Z-y. Isoconversional kinetic analysis of co-combustion of sewage sludge 598
with straw and coal. Appl Energy. 2009;86:1741-5. 599
[34] Vamvuka D, El Chatib N, Sfakiotakis S. Measurements of Ignition Point and Combustion 600
Characteristics of Biomass Fuels and their Blends with Lignite. Combustion Institute 2011. 601
[35] Haykiri-Acma H, Yaman S. Effect of co-combustion on the burnout of lignite/biomass blends: A 602
Turkish case study. Waste Manage. 2008;28:2077-84. 603
[36] Aboulkas A, El harfi K, El bouadili A, Nadifiyine M, Benchanaa M, Mokhlisse A. Pyrolysis kinetics 604
of olive residue/plastic mixtures by non-isothermal thermogravimetry. Fuel Process Technol. 605
2009;90:722-8. 606
[37] Abreu P, Casaca C, Costa M. Ash deposition during the co-firing of bituminous coal with pine 607
sawdust and olive stones in a laboratory furnace. Fuel. 2010;89:4040-8. 608
[38] Krerkkaiwan S, Fushimi C, Tsutsumi A, Kuchonthara P. Synergetic effect during co-pyrolysis / 609
gasification of biomass and sub-bituminous coal. Fuel Provessing Technology. 2013:11-6. 610
[39] Adeyemi I, Janajreh I, Arink T, Ghenai C. Gasification behavior of coal and woody biomass: 611
Validation and parametrical study. Appl Energy. 2016. 612
[40] Zhang L, Xu SP, Zhao W, Liu SQ. Co-pyrolysis of biomass and coal in a free fall reactor. Fuel 613
2007:353–9. 614
[41] Straka P, Nahunkova J, Brozova Z. Kinetics of copyrolysls of coal with polyamide 6. J Anal Appl 615
Pyrolysis. 2004:213-21. 616
[42] Sonobe T, Worasuwannarak N, Pipatmanomai S. Synergies in co-pyrolysis of Thai lignite and 617
corncob. 2008:1371 - 8. 618
[43] Kumabe K, Hanaoka T, Fujimoto S, Minowa T, Sakanishi K. Co-gasification of woody biomass and 619
coal with air and steam. Fuel. 2007:684–9. 620
[44] Kazagic A, Smajevic I. Synergy effects of co-firing wooden biomass with Bosnian coal. Energy. 621
2009;34:699-707. 622
[45] Haykiri-Açma H. Combustion characteristics of different biomass materials. Energy Convers 623
Manage. 2003;44:155-62. 624
[46] Li XG, Lv Y, Ma BG, Jian SW, Tan HB. Thermogravimetric investigation on co-combustion 625
35
[47] Şentorun Ç, Küçükbayrak S. Effect of mineral matter on the burning profile of lignites. 627
Thermochim Acta. 1996;285:35-46. 628
[48] Zhang Y, Zheng Y, Yang M, Song Y. Effect of fuel origin on synergy during co-gasification of 629
biomass and coal in CO2. Bioresour Technol. 2016;200:789-94. 630
[49] Shi KW, Tao; Yan, Jiefeng; et al. Thermogravimetric Studies on Co-combustion Characteristics of 631
Mengxi Coal and Poplar. Switzerland: Springer; 2014. 632
[50] Parvez AM, Wu T. Characteristics and interactions between coal and carbonaceous wastes 633
during co-combustion. J of Energy Inst. 634