1 Title
Change in the dominance structure of two marine fish assemblages over three decades (doi: 10.1111/jfb.13868)
Authors
Faye Moyesand Anne E. Magurran
Centre for Biological Diversity and Scottish Oceans Institute, School of Biology, University of St. Andrews, St. Andrews, Fife KY16 9TH, UK
Corresponding author: Faye Moyes, email: [email protected]
Abstract
Marine fish are an irreplaceable resource but are currently under threat due to overfishing and climate change. To date, most of the emphasis has been on single stocks or populations of economic importance. However, commercially valuable species are embedded in assemblages of many species and there is only limited understanding of the extent to which the structure of whole communities has altered in recent years. Most assemblages are
dominated by one or a few species, with these highly abundant species underpinning ecosystem services and harvesting decisions.
This paper shows that there have been marked temporal changes in the dominance structure of Scottish marine assemblages over the last three decades, where dominance is measured as the proportional numerical abundance of the most dominant species. We report contrasting patterns in both the identity of the dominant species, and shifts in the relative abundance of the dominant in assemblages to the east and west of Scotland. This result highlights the importance of multi-species analyses of harvested stocks and has implications not only for fisheries management but also for consumer choices.
Key words: fish diversity, dominance, biodiversity, climate change, Scottish fisheries
Significance statement
Currently marine biodiversity is facing multiple threats from factors such as over exploitation and climate change. This paper investigates patterns in the dominance structure of two geographically close, yet distinct coastal ecosystems and highlights the importance of examining fish communities as a whole rather than by population.
Introduction
The ongoing biodiversity crisis is the consequence of a combination of anthropogenic impacts including over exploitation and climate change (Jackson, 2008; García Molinos et al., 2016; Cheung, 2018). To date, many of the evaluations of marine fish assemblages, particularly in the context of stock assessment, have focussed on trends in individual species (Pershing et al., 2015; Boyd et al., 2018). Many of these (Baudron et al., 2011; Engelhard et al., 2014; Dutz et al., 2016) report marked changes over the last few years. Recently,
2
and Ter Hofstede, 2008; ter Hofstede et al., 2010) and size (Bell et al., 2018) have been reported, but as biodiversity is a multifaceted concept (Magurran, 2013) there is still much to be learnt about the nature of biodiversity change in assemblages of wild fish.
One frequently used measure of biodiversity is relative species abundance; this quantifies the commonness or rarity of species in comparison to the overall abundance of the assemblage. Species abundance distributions (SADs), which describe the pattern of relative abundance within an assemblage, generally follow the shape of a ‘hollow curve’ with a few abundant species and many rare ones. The most dominant species typically account for a large fraction of the overall abundance, and play an important role in ecosystem function (Davies et al., 2011; Ellingsen et al., 2015; Wohlgemuth et al., 2016; Jones and Magurran, 2018). For this reason the relative dominance of the most numerically abundant species in an assemblage is an informative measure of community structure and can potentially reveal changes that would otherwise be unseen using metrics such as species richness or total abundance (see Supplementary Figure 1).
Here we draw on time-series data of fish assemblages to the east and west of Scotland to ask how the dominance structure of these commercially important regions has changed over three decades. This time scale represents the period over which high quality assemblage data are available (ICES, 2014). The study areas being compared in the analysis are
geographically close, yet are exposed to different climatic conditions and exploitation practices; as such they provide an insight into the extent of recent change in assemblage dominance structure in heavily fished regions of the North East Atlantic.
We know that fish assemblages to the west of Scotland are experiencing considerable reorganisation as a result of biotic homogenization (Magurran et al., 2015), and that biotic homogenization and homogenization of water temperatures are correlated in the west coast assemblages. In contrast, the North Sea to the east of Scotland has exhibited a smaller overall increase in water temperature during the same period (ter Hofstede et al., 2010). Thus, we expect to detect a shift in dominance structure in west coast fishes over the time frame of interest, with latitudinal heterogeneity in the response. No a priori predictions are made for east coast assemblages, which are included to extend the scope of the analysis and provide a comparison with west coast changes.
Materials and Methods Materials and Data
The Scottish West Coast Groundfish survey (DATRAS, 2013) takes place annually in January, February and March whilst the North Sea International Bottom Trawl survey
3
rectangle (rectangles represent a 30’ latitude by 1° longitude grid cell) based sampling strategy which is consistent through time.
The Grande Overture Verticale (GOV) trawl method is the recommended gear for all bottom trawl surveys carried out by ICES. A full description and figures detailing the gear can be found in the ICES Manual for the International Bottom Trawl Surveys (ICES, 2015). A comparative study carried out in 2012 (Reid et al., 2012) showed that the results of trawling using this gear performed similarly to that using a standard commercial trawl. In order to ensure consistency between systems our study only uses the data sampled using the GOV gear.
Species and temperature data were sourced from the International Council for the Exploration of the Sea (ICES) data portal (ICES, 2014). The species data are taken from two standardised surveys incorporating the ICES regions VIa (West coast), IVa and IVb (North Sea). The trawl survey gear provides an adequate sample of a wide range of species and sizes; the complete list of fish included in the recorded catch data (“BTSSurveySpecies.xlsx” – worksheet tab allSpecies) and the subset of those featured in the study set (worksheet tab - studySpecies) are included in the supplementary materials. Surveys adhere to strict protocols (ICES, 2015) with all species within a haul identified to the lowest taxonomic level possible. Additional information is also recorded, where possible, for length, age, sex and maturity, though these data are not used in our analysis.
[image:3.595.109.474.436.655.2]Electronic equipment is used to monitor net geometry during all trawls; this allows for the appropriate adjustment of sweep length according to water depth (ICES, 2015). The depths where hauls are recorded range from 10m to 250m.
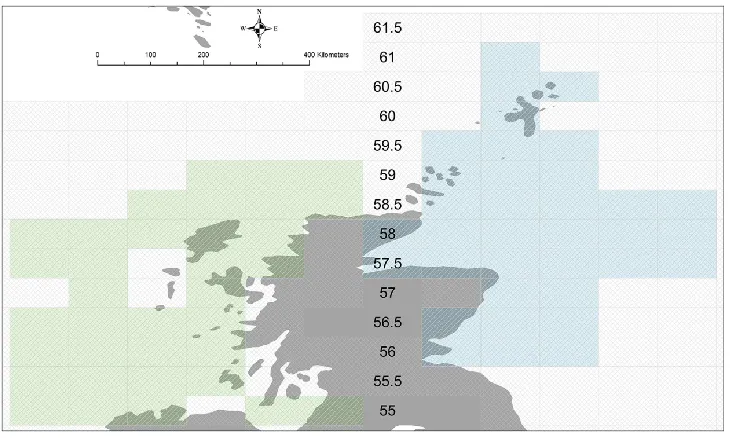
Figure 1: Study Area
4
We selected the 35 ICES west coast rectangles (see Figure 1), as these were the ones which had been most consistently sampled (Magurran et al., 2015), and chose 35
correspondingly well sampled, similarly positioned east coast rectangles for comparison. Each rectangle was assigned to its respective latitudinal band (0.5 degrees wide). The spatial coverage on the west coast extends from 55.5 degrees to 59.5 degrees north and includes 134 species (128 finfish). The corresponding 35 ICES rectangles (see Figure 1) on the east coast extend from 56.5 degrees to 61.5 degrees and include 138 species (129 finfish). For the purposes of this analysis the focus was on finfish but the numerical abundance of the dominant species was computed in relation to the entire assemblage - which also includes a few macroinvertebrates such as the European common squid Alloteuthis subulata (Lamarck 1798) - as these are the species amongst which resources are partitioned.
Sea surface (≤10m) temperature data (Cº) are collected as part of monitoring and were assigned to the relevant latitudinal band for this analysis (see Figure 1).
Methods
The study data comprises nine latitudinal bands on the west coast and eleven on the east. Community time series were compiled for each latitudinal band following sample based rarefaction (Dornelas et al., 2014) (see Supporting Information – Code). Because species richness and other diversity metrics are sensitive to sample size, raw (unrarefied) data can lead to bias. Rarefaction (Gotelli and Colwell, 2011) is a statistical resampling methodology that reduces this bias. Here the minimum number of samples per year, per latitudinal band, was resampled to generate a constant number of samples to be used in the analyses. Sample-based rarefaction was used in this study as – in contrast to individual Sample-based rarefaction- it retains species identity.
The most numerically abundant species in each latitudinal band, and each year, was defined as the dominant species. In the case of a tie (where two or more species were jointly most abundant) the species occurring first in the list of species was chosen. Relative
dominance was then calculated as a proportion of the total abundance of species contained within each assemblage. (R code for this function and others can be found in the
supplementary R markdown document (see Supporting Information – Code)).
We first quantified the overall annual trend in relative dominance, on each coast, using ordinary least squares (OLS). Next, we computed overall annual change in the
composition of the assemblage, in each latitudinal band and on each coast, relative to the first year in the time series (1985), using the Morisita-Horn dissimilarity index (vegdist function in the vegan package (Oksanen et al., 2017)), and described the trend using an OLS
regression. East and west coast trends in mean overall temperature data were treated in the same way. Morisita-Horn was chosen to quantify overall compositional change as it is sensitive to the abundances of the most abundant species (Magurran, 2013).
Finally we used two-way analysis of variance (ANOVA), with an interaction term, to test for differences in dominance between coasts.
5
All analyses used R statistical software (RCoreTeam, 2018). Mapping functions were carried out using the ESRI GIS software ArcGIS (ESRI, 2015).
[image:5.595.74.523.144.388.2]Results
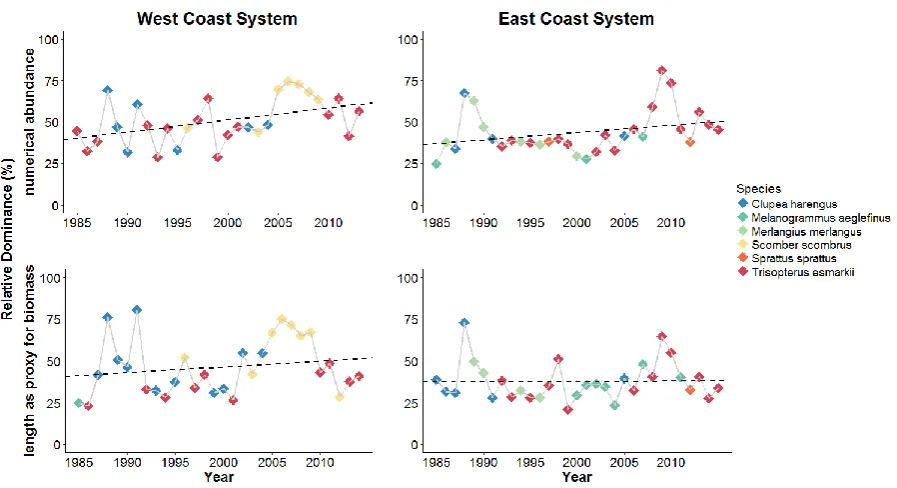
Figure 2: Upper panel of the plot shows the relative dominance (as a percentage) for the numerical abundance on each coast. This plot is the same as Figure 2 within the main text but has yearly points coloured by the changing identities of the dominant species. The dotted lines in both panels represent Ordinary Least Squares (OLS) regression trend lines. The dominant species identities are similar in both calculation methods (numerical abundance and length as a proxy for biomass). In addition the trends follow similar patterns although when using biomass the inclines are flatter in both ecosystems. West coast system - numerical abundance, slope=0.007, value=0.012; biomass, slope=0.003, p-value=0.33. East coast system - numerical abundance, slope=0.004, p-value=0.1; biomass, slope=0.0001, p-value=0.93.
As Figure 2 clearly demonstrates, the dominance structure of these marine assemblages changed over the thirty year duration of the study (see Figure 2). However, although dominance increased in both systems, this increase was significant only for the west coast (OLS regression: west coast p-value=0.012, east coast p-value=0.102). This result is supported by a two-way ANOVA which revealed significant differences in dominance between years (F1, 56=8.493 p=0.005) and between coasts F1, 56=5.175 p=0.03), (see
Supplementary Table 2) but no significant interaction for year x coast [F1, 56=0.633, p=0.43] (for full ANOVA results see Supplementary Table 1).
6
[image:6.595.106.470.131.252.2]both systems, by 1.3° C on the west coast and 0.7° C on the east coast. Once again, the trend was significant only for the west coast (OLS regression: west coast p-value=0.013, east coast p-value=0.423).
Figure 3: Trend in dissimilarity by year
Morisita-Horn dissimilarity (using Year 1 – 1985 as a baseline) with an OLS regression trend line added. The trend is increasing in both systems but only significantly on the west coast
(p-value=0.001).
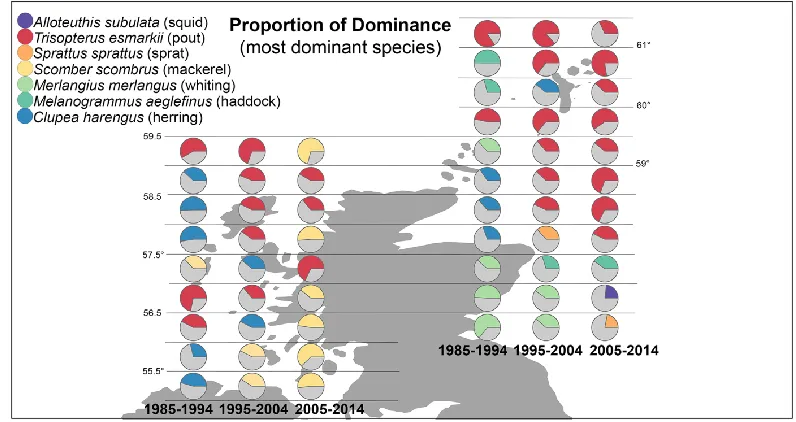
[image:6.595.103.501.486.697.2]Overall differences between the two ecosystems were underlain by within-system differences in relative dominance (see Figure 4, Supplementary Table 2 and Supplementary Figure 3). Overall dominance varied significantly over time (F1, 256=10.65, p=0.001), on the west coast, but there was no effect of latitude, (F1, 256=0.1, p=0.75), and no interaction between latitude and time (F1, 256=0.6, p=0.44). In contrast, on the east coast there was a significant interaction between latitude and time, [F1, 306=4.84, p=0.03], and a significant effect of latitude (F1, 306=21. 05, p<0.0001) but not of time (F1, 306=0.04, p=0.84) (see Supplementary Table 1 for further details).
Figure 4: Map showing spatio-temporal changes in dominants (identity and amount)
7 Discussion
The focus here on marine fish assemblages, rather than fish populations, reveals community wide changes that can be obscured in single species studies. A spatio-temporal approach (Henderson, 2017) in combination with examination of key attributes of community structure, such as the changes in dominance, is an important starting point for understanding the consequences of the melting pot of pressures these systems are currently under (Majewski et al., 2017).
The two coastal systems show distinct differences not only in the proportion of dominance but also in the identity of the most dominant species. Interestingly, it was in the west coast assemblages that we detected the greatest change. Previous work (Magurran et al., 2015) highlighted an increase in biotic homogenization over the same period and
hypothesized that changes in water temperature may have contributed to this pattern. Another recent study (Hansen et al., 2017) found that there were shifts in species dominance expected in freshwater lake systems as a result of warming waters. The observed differences in
dominance found between the east and west coasts are therefore potentially linked to the different patterns of change in sea surface temperatures (Simpson et al., 2011; Stuart-Smith et al., 2017; Townhill et al., 2017) since water temperature is a key driver of distribution
patterns in marine fishes (Perry et al., 2005) . Indeed, the impact of climate change on North Sea circulation and its fish stocks has been discussed elsewhere (Turrell, 1992; Baudron et al., 2013; Hiddink et al., 2014). However, temporal variation in sea surface temperatures (Genner et al., 2004; Henderson et al., 2011; Miller et al., 2011) is unlikely to be the only driver influencing the trends since fishing pressure also leads to marked changes in the structure of marine assemblages (Jackson et al., 2001).
The contrasting outcomes in these two geographic localities illustrate why it is difficult to predict how different systems will respond to environmental and anthropogenic drivers (Poloczanska et al., 2016). Such spatial heterogeneity may be a widespread
phenomenon. Contrasting patterns of biodiversity change were also evident in two zones of a bay in Brazil, monitored over three decades, (Araújo et al., 2016).
On the east coast - which exhibits less temporal variation in identity of the most dominant species - the Norway pout Trisopterus esmarkii (Nilsson, 1855) is the overall dominant for around two thirds of the time series with the exception of the initial decade where haddock Melanogrammus aeglefinus L. features more prominently. In contrast, on the west coast the identities change from Atlantic herring Clupea harengus L. in the first decade, to T. esmarkii in the second and finally Atlantic mackerel Scomber scombrus L. in the third. These species make different contributions to ecosystem function and have different
economic values. For example, S. scombrus is thought to be a predator of juvenile T. esmarkii (ICES, 2005), and while S. scombrus catches have high commercial value, T. esmarkii is considered useful only as food in the aquaculture industry (ICES, 2005).
8
management (Jacobs et al., 2018) where fish biology plays an important role in informing wild fisheries and their continued sustainability.
Science has a vital part to play in the conservation and management of fish resources (Obregón et al., 2018) but, as this study has demonstrated, greater understanding of how fish assemblages respond to change can be gained if fisheries managers take advantages of the rich toolkit of biodiversity metrics. Even simple measures, such as the dominance index used here, reveal patterns that have hitherto been masked in population based analyses (Perry et al., 2010). As such they have the potential to shed new light on the causes and consequences of ecosystem restructuring.
Acknowledgements
FM and AEM are grateful to the European Research Council (ERCAdG BioTIME 250189 and ERCPoC BioCHANGE 727440) for their funding. We are also grateful to the two anonymous reviewers whose comments have strengthened our paper considerably.
Contributions
FM and AEM conceived the project; FM undertook the analyses and both authors contributed to the manuscript.
References
Araújo, F. G., de Azevedo, M. C. C. & Guedes, A. P. P. (2016). Inter-decadal changes in fish communities of a tropical bay in southeastern Brazil. Regional Studies in Marine Science 3, 107-118.
Baudron, A., R., Needle, C., L., Rijnsdorp, A., D. & Marshall, C., Tara (2013). Warming temperatures and smaller body sizes: synchronous changes in growth of North Sea fishes. Global Change Biology 20, 1023-1031.
Baudron, A. R., Needle, C. L. & Marshall, C. T. (2011). Implications of a warming North Sea for the growth of haddock Melanogrammus aeglefinus. Journal of Fish Biology 78, 1874-1889.
Bell, R. J., Collie, J. S., Branch, T. A., Fogarty, M. J., Minto, C., Ricard, D. & Handling editor: Ken, A. (2018). Changes in the size structure of marine fish communities. ICES Journal of Marine Science 75, 102-112.
Boyd, R., Roy, S., Sibly, R., Thorpe, R. & Hyder, K. (2018). A general approach to
incorporating spatial and temporal variation in individual-based models of fish populations with application to Atlantic mackerel. Ecological Modelling 382, 9-17.
Cheung, W. W. L. (2018). The future of fishes and fisheries in the changing oceans. Journal of Fish Biology 92, 790-803.
9
DATRAS (2013). ICES Scottish West Coast Survey For Commercial Fish Species 1985-2013. Available at https://datras.ices.dk, accessed 2014.
DATRAS (2015). ICES North Sea International Bottom Trawl Survey For Commercial Fish Species 1985-2014. (DATRAS, ed.): https://datras.ices.dk.
Davies, T. W., Jenkins, S. R., Kingham, R., Kenworthy, J., Hawkins, S. J. & Hiddink, J. G. (2011). Dominance, Biomass and Extinction Resistance Determine the Consequences of Biodiversity Loss for Multiple Coastal Ecosystem Processes. PLOS ONE 6, e28362.
Dornelas, M., Gotelli, N. J., McGill, B. J., Shimadzu, H., Moyes, F., Sievers, C. & Magurran, A. E. (2014). Assemblage time series reveal biodiversity change but not systematic loss. Science 344, 296-299.
Dutz, J., Støttrup, J. G., Stenberg, C. & Munk, P. (2016). Recent trends in the abundance of plaice Pleuronectes platessa and cod Gadus morhua in shallow coastal waters of the
Northeastern Atlantic continental shelf – a review. Marine Biology Research 12, 785-796. Ellingsen, K. E., Anderson, M. J., Shackell, N. L., Tveraa, T., Yoccoz, N. G. & Frank, K. T. (2015). The role of a dominant predator in shaping biodiversity over space and time in a marine ecosystem. Journal of Animal Ecology 84, 1242-1252.
Engelhard, G. H., Righton, D. A. & Pinnegar, J. K. (2014). Climate change and fishing: a century of shifting distribution in North Sea cod. Global Change Biology 20, 2473-2483. ESRI (2015). ArcGIS Desktop: Release 10.1 Redlands, CA: Environmental Systems Research Institute.
García Molinos, J., Halpern, B. S., Schoeman, D. S., Brown, C. J., Kiessling, W., Moore, P. J., Pandolfi, J. M., Poloczanska, E. S., Richardson, A. J. & Burrows, M. T. (2016). Climate velocity and the future global redistribution of marine biodiversity. Nature Clim. Change 6, 83-88.
Genner, M. J., Sims, D. W., Wearmouth, V. J., Southall, E. J., Southward, A. J., Henderson, P. A. & Hawkins, S. J. (2004). Regional climatic warming drives long–term community changes of British marine fish. Proceedings of the Royal Society of London B: Biological Sciences 271, 655-661.
Gotelli, N. J. & Colwell, R. K. (2011). Estimating species richness. Biological diversity: frontiers in measurement and assessment 12, 39-54.
Greenwood, M. F. D. & Maitland, P. S. (2009). Long-term changes in fish-assemblage composition from cooling-water intake screens in the Forth Estuary, Scotland, UK. Marine Biodiversity Records 2, e8.
Hansen, G. J. A., Read, J. S., Hansen, J. F. & Winslow, L. A. (2017). Projected shifts in fish species dominance in Wisconsin lakes under climate change. Global Change Biology 23, 1463-1476.
Henderson, P. A. (2017). Long-term temporal and spatial changes in the richness and relative abundance of the inshore fish community of the British North Sea Coast. Journal of Sea Research 127, 212-226.
Henderson, P. A., Seaby, R. M. H. & Somes, J. R. (2011). Community level response to climate change: the long-term study of the fish and crustacean community of the Bristol Channel. Journal of Experimental Marine Biology and Ecology 400, 78-89.
10
Hiddink, J. G. & Ter Hofstede, R. (2008). Climate induced increases in species richness of marine fishes. Global Change Biology 14, 453-460.
Iacarella, J. C., Adamczyk, E., Bowen, D., Chalifour, L., Eger, A., Heath, W., Helms, S., Hessing-Lewis, M., Hunt, B. P. V., MacInnis, A., O'Connor, M. I., Robinson, C. L. K., Yakimishyn, J. & Baum, J. K. (2018). Anthropogenic disturbance homogenizes seagrass fish communities. Global Change Biology 24, 1904-1918.
ICES (2005). ICES-FishMap is an atlas of North Sea fish, including fact sheets of key species and distribution maps. Available at
http://www.ices.dk/marine-data/maps/Pages/ICES-FishMap.aspx.
ICES (2014). International Council for the Exploration of the Sea (ICES) Data Collections. Available at http://ecosystemdata.ices.dk/.
ICES (2015). Manual for the International Bottom Trawl Surveys. . Series of ICES Survey Protocols 86 pp.
Jackson, J. B. C. (2008). Ecological extinction and evolution in the brave new ocean. Proceedings of the National Academy of Sciences 105, 11458-11465.
Jackson, J. B. C., Kirby, M. X., Berger, W. H., Bjorndal, K. A., Botsford, L. W., Bourque, B. J., Bradbury, R. H., Cooke, R., Erlandson, J., Estes, J. A., Hughes, T. P., Kidwell, S., Lange, C. B., Lenihan, H. S., Pandolfi, J. M., Peterson, C. H., Steneck, R. S., Tegner, M. J. &
Warner, R. R. (2001). Historical Overfishing and the Recent Collapse of Coastal Ecosystems. Science 293, 629-637.
Jacobs, A., Doran, C., Murray, D. S., Telsnig, J. D., Laskowski, K. L., Jones, N. A. R., Auer, S. K. & Præbel, K. (2018). On the challenges and opportunities facing fish biology: a
discussion of five key knowledge gaps. Journal of Fish Biology 92, 690-698.
Jones, F. A. M. & Magurran, A. E. (2018). Dominance structure of assemblages is regulated over a period of rapid environmental change. Biology Letters 14.
Jung, S. & Houde, E. D. (2003). Spatial and temporal variabilities of pelagic fish community structure and distribution in Chesapeake Bay, USA. Estuarine, Coastal and Shelf Science 58, 335-351.
Magurran, A. E. (2013). Measuring biological diversity: John Wiley & Sons.
Magurran, A. E., Dornelas, M., Moyes, F., Gotelli, N. J. & McGill, B. (2015). Rapid biotic homogenization of marine fish assemblages. Nature Communications 6, 8405.
Majewski, A. R., Atchison, S., MacPhee, S., Eert, J., Niemi, A., Michel, C. & Reist, J. D. (2017). Marine fish community structure and habitat associations on the Canadian Beaufort shelf and slope. Deep Sea Research Part I: Oceanographic Research Papers 121, 169-182. Miller, E. F., Pondella, I. I. D. J., Beck, D. S. & Herbinson, K. T. (2011). Decadal-scale changes in southern California sciaenids under different levels of harvesting pressure. ICES Journal of Marine Science 68, 2123-2133.
Moriarty, M., Sell, A. F., Trenkel, V. M., Lynam, C. P., Burns, F., Clarke, E. D., Greenstreet, S. P. R., McGonigle, C. & Handling editor: Michel, K. (2018). Resolution of biodiversity and assemblage structure in demersal fisheries surveys: the role of tow duration. ICES Journal of Marine Science 75, 1672-1681.
11
Obregón, C., Lyndon, A. R., Barker, J., Christiansen, H., Godley, B. J., Kurland, S., Piccolo, J. J., Potts, R., Short, R., Tebb, A. & Mariani, S. (2018). Valuing and understanding fish populations in the Anthropocene: key questions to address. Journal of Fish Biology 92, 828-845.
Oksanen, J., Blanchet, F. G., Friendly, M., Kindt, R., Legendre, P., McGlinn, D. J., Minchin, P. R., O'Hara, R. B., Simpson, G. L., Solymos, P., Henry, M., Stevens, H., Szoecs, E. & Wagner, H. (2017). vegan: Community Ecology Package. R package version 2.4-3.
https://CRAN.R-project.org/package=vegan.
Perry, A. L., Low, P. J., Ellis, J. R. & Reynolds, J. D. (2005). Climate Change and Distribution Shifts in Marine Fishes. Science 308, 1912-1915.
Perry, R. I., Cury, P., Brander, K., Jennings, S., Möllmann, C. & Planque, B. (2010). Sensitivity of marine systems to climate and fishing: Concepts, issues and management responses. Journal of Marine Systems 79, 427-435.
Pershing, A. J., Alexander, M. A., Hernandez, C. M., Kerr, L. A., Le Bris, A., Mills, K. E., Nye, J. A., Record, N. R., Scannell, H. A., Scott, J. D., Sherwood, G. D. & Thomas, A. C. (2015). Slow adaptation in the face of rapid warming leads to collapse of the Gulf of Maine cod fishery. Science 350, 809-812.
Poloczanska, E. S., Burrows, M. T., Brown, C. J., Garcia Molinos, J., Halpern, B. S., Hoegh-Guldberg, O., Kappel, C. V., Moore, P. J., Richardson, A. J., Schoeman, D. S. & Sydeman, W. J. (2016). Responses of marine organisms to climate change across oceans. Frontiers in Marine Science 3.
RCoreTeam (2018). R: A Language and Environment for Statistical Computing. Vienna, Austria: R Foundation for Statistical Computing, http://www.R-project.org/.
Reid, D. G., Kynoch, R. J., Penny, I., Summerbell, K., Edridge, A. & O’Neill, F. G. (2012). A comparison of the GOV survey trawl with a commercial whitefish trawl. Fisheries Research 121-122, 136-143.
Simpson, Stephen D., Jennings, S., Johnson, Mark P., Blanchard, Julia L., Schön, P.-J., Sims, David W. & Genner, Martin J. (2011). Continental Shelf-Wide Response of a Fish
Assemblage to Rapid Warming of the Sea. Current Biology 21, 1565-1570.
Stuart-Smith, R. D., Edgar, G. J. & Bates, A. E. (2017). Thermal limits to the geographic distributions of shallow-water marine species. Nature Ecology & Evolution 1, 1846-1852. ter Hofstede, R., Hiddink, J. G. & Rijnsdorp, A. D. (2010). Regional warming changes fish species richness in the eastern North Atlantic Ocean. Marine Ecology Progress Series. Townhill, B., Pinnegar, J., Tinker, J., Jones, M., Simpson, S., Stebbing, P. & Dye, S. (2017). Non-native marine species in north-west Europe: Developing an approach to assess future spread using regional downscaled climate projections. Aquatic Conservation: Marine and Freshwater Ecosystems 27, 1035-1050.
Turrell, W. R. (1992). New hypotheses concerning the circulation of the northern North Sea and its relation to North Sea fish stock recruitment. ICES Journal of Marine Science: Journal du Conseil 49, 107-123.