warwick.ac.uk/lib-publications
Original citation:
Ursino, Moreno, Yuan, Ying, Alberti, Corinne, Comets, Emmanuelle, Favrais, Geraldine,
Friede, Tim, Lentz, Frederike, Stallard, Nigel and Zohar, Sarah (2018) A dose finding design
for seizure reduction in neonates. Journal of the Royal Statistical Society: Series C (Applied
Statistics) . doi:
10.1111/rssc.12289
Permanent WRAP URL:
http://wrap.warwick.ac.uk/102383
Copyright and reuse:
The Warwick Research Archive Portal (WRAP) makes this work of researchers of the
University of Warwick available open access under the following conditions.
This article is made available under the Creative Commons Attribution-NonCommercial 4.0
(CC BY-NC 4.0) license and may be reused according to the conditions of the license. For
more details see:
http://creativecommons.org/licenses/by-nc/4.0/
A note on versions:
The version presented in WRAP is the published version, or, version of record, and may be
cited as it appears here.
©2018 The Authors Journal of the Royal Statistical Society: Series C (Applied Statistics) Published by John Wiley & Sons Ltd on behalf of the Royal Statistical Society.
This is an open access article under the terms of the Creative Commons Attribution-NonCommercial License, which permits use, distribution and reproduction in any medium, provided the original work is properly cited and is not used for commercial purposes.
0035–9254/18/68000
A dose finding design for seizure reduction in
neonates
Moreno Ursino,
Institut National de la Sant ´e et de la Recherche M ´edicale, Universit ´e Paris Descartes and Universit ´e Paris-Sorbonne, France
Ying Yuan,
University of Texas MD Anderson Cancer Center, Houston, USA
Corinne Alberti,
Institut National de la Sant ´e et de la Recherche M ´edicale, H ˆopital Robert-Debr ´e and Universit ´e Paris Diderot, France
Emmanuelle Comets,
Institut National de la Sant ´e et de la Recherche M ´edicale, Universit ´e Rennes-1 and Universit ´e Paris Diderot, France
Geraldine Favrais,
Centre Hospitaliers R ´egionaux et Universitaire de Tours, France
Tim Friede,
Universit ¨atsmedizin G ¨ottingen, Germany
Frederike Lentz,
Federal Institute for Drugs and Medical Devices, Bonn, Germany
Nigel Stallard
University of Warwick, Coventry, UK
and Sarah Zohar
Institut National de la Sant ´e et de la Recherche M ´edicale, Universit ´e Paris Descartes and Universit ´e Paris-Sorbonne, France
[Received July 2017. Revised April 2018]
Summary. Clinical trials in vulnerable populations are extremely difficult to conduct. A sequen-tial phase I–II trial aimed at finding the appropriate dose of levetiracetam for treating neonatal
Address for correspondence: Moreno Ursino, Institut National de la Sant´e et de la Recherche M´edicale, Unit´e Mixte de Recherche Scientifique 1138, Team 22, Universit´e Paris Descartes et Universit´e Paris-Sorbonne, 15 rue Ecole de M´edecine, Paris 75006, France.
seizures was planned with a maximum sample size of 50 newborns. Three primary outcomes are considered: efficacy and two types of toxicity that occur at the same time but are measured at different time points. In the case of failure, physicians could add a second agent as a rescue medication.The primary outcomes were modelled via a logistic model for efficacy and a weighted likelihood with pseudo-outcomes for the two toxicities taking into account the dependences under Bayesian inference. Simulations were conducted to assess the design properties.
Keywords: Efficacy; Newborns; Phase I–II; Time to event; Toxicity constraints
1. Introduction
The aim of early phase dose finding trials is to obtain reliable information on a drug’s safety, tolerability, pharmacokinetics, mechanism of action and trends regarding efficacy. Usually, these trials are performed on healthy adult volunteers, except when the drug is very toxic as in oncology. In paediatrics clinical trials, the practice of including healthy infants in phase I studies only for safety assessment is generally considered unethical. Drugs or procedures are often directly evaluated for efficacy in clinical trials (Gill, 2004) with certain safety stopping rules to protect infants from toxic drugs or procedures. Such trials are often known as phase I–II trials (Yuanet al., 2016), where efficacy and toxicity are studied simultaneously. Many dose finding designs have been proposed for adults in the oncology setting (Zohar and O’Quigley, 2006; Yuanet al., 2016), but only a few of them were specifically developed for paediatrics or for other indications than oncology. Thallet al.(2014) proposed a dose finding method for neonates with respiratory distress syndrome based on three clinical outcomes.
Conducting early phase clinical trials in neonates is challenging. Correct dosing is obstructed by the fast physiological changes that occur in neonates at this stage of development (Coppini et al., 2016). Neonates are not very small adults or ‘young’ children, but they have a completely different metabolism from adults and older children. Furthermore, there is no direct relationship as a function of body surface or allometry that links the pharmacokinetics and pharmacody-namics variables, such as the clearance or the constant of absorption related to the drug (Petit et al., 2016a, b). As a result, the definitions of efficacy and toxicity end points for neonates are often substantially different from those for adults or children (2 years old or more). In addition, selecting proper efficacy and toxicity end points and measuring them in neonates are more diffi-cult and subjective (Denne, 2012; Thallet al., 2014; Coppiniet al., 2016). For example, because neurological damage cannot be measured before 1 or 2 years after birth, surrogate end points, such as anaphylactic shock or long duration apnoea, must be used as a measure of neurological damage in neonates. In our motivating trial, one potential adverse event (AE) that is caused by the treatment is hearing loss. Such an AE is easy to capture in realtime for adults but difficult to measure in neonates. A specific hearing test must be scheduled and performed to diagnose it. Because of those difficulties coupled with the many ethical challenges, dose finding in neonates has been largely done in anad hocway without formal statistical modelling and considerations.
Usual challenges in these kind of trials include
(a) the definition of multiple types of toxicity, that can be observed or measured at different times after the treatment and can be correlated,
(b) the addition of another rescue drug or treatment, and sometimes it could be unclear whether the resulting toxicity is due to the test treatment or to the additional one and (c) the small target of probability of an AE which is accepted for the treatment.
These characteristics are not only limited to clinical trials in neonates or paediatrics, but also in rare disease in adults, for example. In what follows, we address these challenges by stating a motivating trial in newborns.
neonatal seizures: safety and efficacy phase II study’ (called the ‘LEVNEONAT’ trial; regis-tration number NCT 02229123 atwww.ClinicalTrials.gov) to find the optimal dose of levetiracetam for treating seizures in neonates. As detailed later, this trial has some challenges that are associated with treating neonates. For example, hearing loss cannot be measured in realtime and is only ascertained at day 30, and a new drug may be added during the course of the treatment if clinicians believe that levetiracetam alone is not adequately effective to reduce seizure. To handle these challenges, we model three end points (one efficacy and two toxicity end points) and utilize a pseudolikelihood approach for inference. On the basis of accumulating data, we continuously update the model estimates and adaptively assign doses to new patients. The remainder of this paper is organized as follows. In Section 2, we describe our motivating clinical trial and some challenges. In Section 3, we propose the new design, including statisti-cal models and the dose assignment rule. The simulation settings and results are presented in Section 4. Finally, a discussion is given in Section 5.
The programs that were used to analyse the data can be obtained from
http://wileyonlinelibrary.com/journal/rss-datasets
2. Motivating trial
The aim of this paper is to propose a dose finding design for the LEVNEONAT clinical trial based on the experiences from the ‘Neonatal seizures with medication off-patent’ trial (called the ‘NEMO’ trial; NCT01434225 inwww.ClinicalTrials.gov) (Pressleret al., 2015). The NEMO trial is an open label phase I–II dose finding trial conducted between 2011 and 2013. The objective of the trial was to find the optimal dose of bumetanide that achieved the maximum seizure reduction with an acceptable safety profile out of four study doses (i.e. 0.05, 0.1, 0.2 and 0.3 mg kg−1). The primary efficacy end point was defined as the reduction of the electrographic seizure burden by 80% or more within hours 3 and 4 after the first bumetanide administration compared with the baseline. The safety end point was binary and defined as the occurrence of a list of AEs within 48 h after the first dose. The lowest acceptable efficacy response rate was 50%, and the maximum tolerable toxicity rate was 10%. A phase I–II dose finding design with dual binary efficacy and safety end points was used (Zohar and O’Quigley, 2006). 14 evaluable neonates were included in the trial. Four neonates were included at a dose of 0.05 mg kg−1, three neonates at a dose of 0.1 mg kg−1, six neonates at a dose of 0.2 mg kg−1and one at a dose of 0.3 mg kg−1. During the trial, no major AE was observed according to the definition that was specified in the protocol. However, after 14 neonates had been accrued, an unexpected AE was observed: three neonates experienced hearing loss at different doses. These AEs might have occurred during the treatment phase but could only be measured later by using a specific test as babies could not express this AE earlier. Fig. 1 shows the estimated dose–efficacy and the dose–toxicity relationships with or without including hearing loss as an AE after the accrual of 14 neonates. After including hearing loss as an AE, the model fitted indicated that all doses were unsafe, and thus the trial was terminated early following a recommendation by the Data and Safety Monitoring Board.
0.0
0.2
0.4
0.6
0.
8
1.0
Dose (mg/kg)
Pro
bab
ility
[image:5.485.109.375.57.215.2]0.05 0.1 0.2 0.3
Fig. 1. Estimated dose–efficacy and dose–toxicity relationships with or without hearing loss for the NEMO clinical trial: , dose–response;, dose–toxicity without hearing loss;4, dose–toxicity with hearing loss;
, minimum response target 50%; , maximal toxicity target 10%
time Levetiracetam
loading dose (LD)
T = 0 T = 4h
Efficacy evaluation
Efficacy: Reduction by 80% of seizures
T = 64h T = 8h
Levetiracetam maintenance
doses
every 8 h for 64 hours If no efficacy, possibility of adding a second agent at any
time. A2?
T = 4h T = 6d
Toxicity at short term evaluation
T = [30d] hearing test Toxicity at long term evaluation
Toxicity at short term is predictive for toxicity at long term
Fig. 2. LEVNEONAT clinical trial—doses and end point measurements scheme: the loading dose LD is given at time 0 and after 4 h the efficacy end point is evaluated; up to eight maintenance doses (a quarter of LD) are administrated between hours 6 and 64; the investigators have the option to add a second agent A2 as a rescue medication; after 6 days, the first toxicity end point (short-term toxicity) is measured whereas the long-term toxicity end point (i.e. hearing loss) is assessed after 30 days or when the neonate is released from the hospital, whichever occurs first
[image:5.485.47.438.265.496.2]of agent to be added is at the discretion of the investigator, with the possibility of reducing the maintenance dose. In this trial, the investigators hoped that the dose finding method would reflect the clinical practice as much as possible, including
(a) to account for not only efficacy and short-term toxicity, as in the NEMO trial, but also long-term toxicity (i.e. hearing loss) that cannot be measured earlier,
(b) to consider not only the loading dose but also the number (or quantity) of maintenance doses of levetiracetam and
(c) to account for the fact that the second agent A2 might be added during the course of treatment, and thus toxicity might be caused by levetiracetam, A2, or both.
We have considered two end points for toxicity rather than one combined end point for clinical and logistical reasons rather than statistical. For instance, our two AE definitions differ for short-term and long-short-term toxicities; then from a medical viewpoint the end points cannot be merged, as we are interested in the estimation of each end point separately. Moreover, monitoring babies during the first 6 days of life for toxicity is already difficult. If from day 6 to day 30 the second outcome will not be observed there is no reason to require medical staff to undertake close monitoring when it is not necessary.
The model that was proposed by Thallet al.(2014), which uses elicited numerical utilities for the possible composite outcomes due to two efficacy outcomes and one safety outcome, cannot be adapted to this setting, since it does not take into account the timing of assessment of different outcomes. Another three-outcome model was presented in Zhonget al.(2012), who proposed a trivariate continual reassessment method (CRM) for a toxicity, efficacy and a surrogate efficacy end point. But, even if changing the surrogate efficacy with a surrogate toxicity, the assumption of a surrogate end point is not suitable in this trial. The short-term toxicity is not a surrogate of the long-term toxicity. Moreover, Thallet al.(2014) and Zhonget al.(2012) did not consider adding a second agent during the course of treatment. Here, we model three end points and propose the use of a pseudolikelihood approach for inference.
3. Methods
In this section, we describe three statistical models to describe the relationships between the dose and efficacy and short-term toxicity (denoted as T1) and long-term toxicity (denoted as T2) respectively. These models will be used to guide the dose allocation and selection. The correlation between efficacy and toxicity was not taken into account since in previous studies it was negligible. Letdk,dk∈.d1,d2,: : :,dK/, be the loading dose andd[i] be the dose that is administered to theith subject. LetyE,ibe a binary efficacy indicator that takes a value of 1 if the ith subject experiences efficacy and 0 otherwise,yT1,ibe a binary short-term toxicity indicator that takes a value of 1 if theith subject experiences short-term toxicity T1 and 0 otherwise, and yT2,ibe a binary indicator for long-term toxicity T2.
3.1. Dose–efficacy model
Levetiracetam is administered through a loading dosedk, followed by a series of maintenance doses, which are a quarter of the loading dose. As the efficacy is evaluated before the adminis-tration of the maintenance doses, it depends only ondk. LetpE.x/=P.yE,i=1|d[i]=x/denote the probability of efficacy for a patient receiving dosex. We model the dose–efficacy relationship by using a logistic model, as follows:
whereα1andβ1are intercept and slope parameters respectively, andd˜kis the ‘effective’ dose, defined as the prior estimate of efficacy probability associated with dosedk(Zoharet al., 2013). It is computed fixingα1,β1andpEand inverting equation (1). Research (Zoharet al., 2013; Yuan
et al., 2016) shows that using the effective dose rather than the actual dosage improves the model fitting and estimation. We fix the intercept atα1=3, although other values can be used for other applications (Lee and Cheung, 2009; Chevret, 1993). Shen and O’Quigley (1996) showed that such a one-parameter model performs better than the two-parameter logistic model for dose finding with small samples. The coefficient exp.β1/is greater than 0 to ensure dose monotonicity. We assignβ1a normal prior with mean 0 and standard deviation 1.34 as suggested in Cheung (2011), i.e.β1∼N.0, 1:34/, since we do not have any information to set a more informative prior distribution.
3.2. Short-term toxicity model
The short-term toxicity T1 is assessed within 6 days from the initiation of the treatment. As shown in Fig. 2, one challenge here is that, when clinicians believe that levetiracetam is not adequately effective to reduce seizure, they may reduce or stop the maintenance dose and add a new agent A2 to boost the treatment effect. This makes the modelling of T1 more complicated than standard dose finding trials. The evaluation of toxicity of levetiracetam is confounded by the possible addition of A2 and affected by the number of maintenance doses that a baby actually received. In other words, when toxicity is observed after adding A2, we do not know whether that toxicity comes from levetiracetam, A2 or both. The second challenge is that, although the assessment period for T1 is short (i.e. 6 days), new babies could arrive in hospitals at any time and require immediate treatment. Thus, the so-called ‘late onset outcome’ problem may occur, i.e. when a new baby arrives, some enrolled baby may not have completed the 6-day toxicity evaluation, which hinders the adaptive decision of dose assignment for the new baby. As noted by Liuet al.(2013) and Jinet al.(2014), whether there is a late onset outcome problem depends on not only the length of the assessment period, but also on both the length of the assessment period and the accrual rate. In the LEVNEONAT trial, the assessment period (i.e. 6 days) is shorter than in most trials but, as the accrual rate is fast, we may still face the late onset outcome problem. We handle these two challenges in a unified framework using a weighted pseudolikelihood approach.
We first address the problem of potential late onset outcome. Letyi beyT1,i from now on. After consulting the investigators, it appears that T1 is most likely to occur at the beginning of the assessment period of 0–6 days; therefore, a modified time-to-event (TITE) CRM (Cheung and Chappell, 2000; Braun, 2006) was developed to address the late onset toxicity problem. Let Tidenote the time to toxicity of the ith patient andTmaxbe the maximum length of the toxicity assessment window forT1(i.e. 6 days). Starting from the definition of a conditional distribution, fortT, we obtain
P.Tit|xi/=P.Tit|xi,yi=1/P.yi=1|xi/,
whereP.yi=1|xi/is the probability of short-term toxicity for a patient receiving dosex, denoted aspT1.x/. We modelpT1.x/by using a one-parameter logistic model as follows:
logit{pT1.x/}=α2+exp.γ1/x, x∈{d¯1,: : :,d¯K},
parameterization ensures that toxicity T1 monotonically increases with the dose; we assume a normal priorγ1∼N.0, 1:34/andα2=3.
LetTmaxbe the maximum assessment period, i.e.Tmax= 6 days. Taking a similar approach to Braun (2006), we assume that the scaled time to toxicityt=Tmaxfollows a beta distribution beta.1,ζ/. Thus, we have
P.Tit|xi,Yi=1/=1−
1− t Tmax
ζ
, ζ>0:
We fix the first parameter of the beta distribution at 1 to decrease the complexity of the model while still maintaining flexibility for capturing various shapes of the time to toxicity. In addition, as the sum of the two parameters of the beta distribution is greater than 1, it precludes the U-shape of time to toxicity, which is unlikely in our application.
As the sample size is small and the number of toxicities that were observed in the trial is even smaller, it is critical to choose an appropriate prior forζto avoid an extremely noisy estimate. We elicit the prior distribution of ζ from clinicians as follows. We provide several different distributions of time to toxicity to clinicians and ask them to pick the most likely one. Fig. 3 shows the distributions that we showed to our clinical collaborators. Distribution (b) was picked as the most likely. We then assignζa gamma prior distribution with mean matched to that of the distribution picked. For the LEVNEONAT trial, we setζ∼Ga.5, 1/since the prior mean of distribution (b) was 5. Fig. 3 shows also how the parameterized beta distribution can capture various shapes where toxicity is supposed to occur at the beginning of the period. However, if the posterior estimate ofζis less than 1, this shape is reflected and toxicity occurs more likely at the end of the period. For the LEVNEONAT clinical trialζwas considered to be the same for all doses, to avoid model complexity. Nevertheless, from the monotonicity assumption, the higher is the dose, the earlier that toxicity occurs, andζcould then depend on the dose by settingζi=zλk, whereλ<0 andzkis a transformed value ofdkconstrained to the interval [0, 1] (Braun, 2006). Next, we discuss how to handle the confounding issue due to the possible addition of new agent A2 during the course of administration of maintenance doses. The difficulty is that, if toxicity is observed after A2 has been added, it is not clear that the toxicity is caused by levetiracetam, A2 or both. We tackle this issue by creating a pseudo-observationyÅi to represent how likely the toxicity is attributable to maintenance doses. Specifically, letnidenote the number of times that a maintenance dose has been administered to theith patient, and letxi,mdenote the actual dosage of the maintenance dose (or the actual dosage of the loading dose, since there is a one-to-one relationship). Given the actually observed toxicity outcomeyi, we define a pseudo-observation
yÅi =w.ni,xi,m/yi
with weight
w.ni,xi,m/=
fw.ni,xi,m/τ, if A2 is added,
1, otherwise, .2/
wherefw.ni,xi,m/is a prespecified function, and the constantτ<1 represents the likelihood that the toxicity is due to levetiracetam when all maintenance doses are given. The value of τ should be elicited from clinicians. Basically, equation (2) says that, if A2 is not added, the observed outcomeyi should receive a full weight of 1 because the toxicity is fully attributable to levetiracetam; however, if A2 is added during the treatment, only a fraction of toxicity, i.e. fw.ni,xi,m/τ, should be attributable to levetiracetam. A similar approach has been used by Yuan
(a) (b)
(c) (d)
den
s
[image:9.485.118.363.58.534.2]ity
Fig. 3. Four elicited plots, showing several beta distributions, were given to investigators for the LEV-NEONAT clinical trial (in particular, plot (b) was selected): (a)ζD3I(b)ζD5I(c)ζD7I(d)ζD9
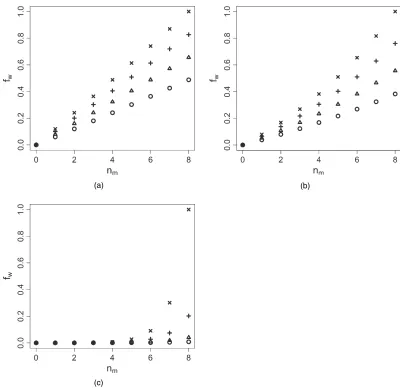
fw.ni,xi,m/=
exp.γnixi,m/−1 exp.γNMxK/−1 ,
(a)
(c)
[image:10.485.44.444.53.441.2](b)
Fig. 4. Values offwfor several doses (, 30 mg kg1;4, 40 mg kg1;C, 50 mg kg1;, 60 mg kg1) versusthe number of maintenance doses and for threeγ-values: (a)γD2104; (b)γD0.002; (c)γD0.02
w.ni,xi,m/=
τL+fw.ni,xi,m/.τ−τL/, if A2 is added,
1, otherwise,
can be used, whereτLrepresents the value to give at the loading dose (the same to all doses for simplicity). An alternative idea, which is not developed in this paper, consists of eliciting each weight directly from clinicians.
Putting all together, givennbabies treated in the trials, the pseudolikelihood for T1 is given by
QL1.γ1|y,α1,ζ/∝ n
i=1
1−
1− ui Tmax ζ pT1 yÅ i 1− 1−
1− ui Tmax
ζ
pT1 1−yÅi
: .3/
We used pseudolikelihood in a general sense that the likelihood that is yielded by equation (3) is not necessarily the true likelihood because we attached an empirical weight to toxicity probabilitypT1. In the special case that the time to toxicity follows a uniform distribution, equation (3) leads to the true likelihood. Without considering the weight,yÅ actually follows the quasi-Bernoulli likelihood (Gourierouxet al., 1984; McCullagh and Nelder, 1989). Because of the weights, it is more appropriate to be called pseudolikelihood as explained.
3.3. Long-term toxicity model
Unlike short-term toxicity T1, which can be observed any time between day 1 and 6, long-term toxicity T2 (i.e. hearing loss) is evaluable only at day 30, although it may occur long before day 30; see Fig. 2. As T1 is potentially predictive of T2, letpT2.x,yT1/=P.yT2=1|x,yT1/; we model T2 by using the logistic model
logit{pT2.x,yT1/}=α3+exp.δ1/x+exp.δ2/yT1, x∈{d˙1,: : :,d˙K}, .4/
where{d˙1,: : :,d˙K}are effective doses standing for the prior estimates of toxicity probability of T2 at each dose, α3 is fixed andδ1and δ2 are parameters to be estimated. Because both exp.δ1/and exp.δ2/are greater than 0, a patient is more likely to experience T2 if he or she has experienced short-term toxicity T1 or/and received a high dose. We do not use a TITE model for T2 because T2 cannot be observed in realtime and can be measured only at day 30. Similarly to T1, the measurement of T2 is also confounded by the potential addition of A2. We use the same pseudo-observation approach to handle that issue by replacing the actually observed toxicity outcomeyT2withyÅT2=w.nm,xm/yT2, wherew.nm,xm/is provided by equation (2). For coherence, we replaceyT1in equation (4) withyÅT1; the same value as used in the model for T1. Let nÅ be the number of patients who have already completed the assessment of T2; the resulting pseudolikelihood can then be written as
QL2.·/=n Å
i=1
pT2.x[i],yÅT1,i/y Å
T2,i{1−pT2.x
[i],yÅT1,i/} 1−yÅ
T2,i:
Prior distributions forδ1 andδ2areN.0, 1:34/andα3=3. Model (4) defines the conditional distribution ofyT2givenyT1; the marginal probability ofyT2, which is denoted aspT2, can be computed by using the law of total probability.
3.4. Avoiding stickiness
allocation
5 10 15
20 DLT15s10 5
[image:12.485.177.319.53.185.2]20 wr 0.0 0.2 0.4 0.6 0.8 1.0
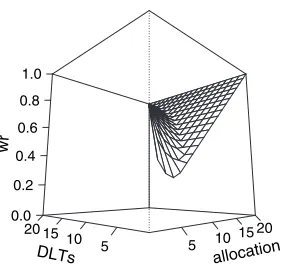
Fig. 5. Three-dimensional plots of wr whennmaxD20 andπD0.5
become stuck at a suboptimal action because it repeatedly takes the suboptimal action; it fails to take and thus to obtain enough data on an optimal action. This has been recognized also in the context of dose finding clinical trials (Azrielet al., 2011; Thall and Nguyen, 2012; Oron and Hoff, 2013; Yuanet al., 2016). In particular, this stickiness property leads to the allocation of many patients at lower doses for a long period before starting the escalation. Thus, following the approach of Resche-Rigonet al.(2008, 2010), we weight the pseudolikelihood that was described above for T1 (3) with wri.·/, which are called relevance weights from now on, which are adaptive weights depending on the number of patients already accrued in the trial and on the number of short-term toxicities already counted at each dose. Letnalloc,dk be the current number of patients allocated at dosekandnDLT,dk be the current number of patients who ex-perienced toxicity at dosek. Regarding the LEVNEONAT clinical trial, we have developed a specific scheme as follows:
wri.yi,di/= ⎧ ⎨ ⎩
1, ifyi=0,
min
max
πnalloc,di nmax +.
1−π/nDLT,di nalloc,di
,nalloc,di nmax
, 1
, ifyi=1,
wherenmaxis a constant, which is usually linked to the target probability, andπis a mixture constant containing the percentage of patients who were allocated at doseiand to the percentage of toxicity seen at dosei. Afternmaxpatients have been allocated at each dose, all the weights are equal to 1. Fig. 5 shows the three-dimensional plot of this function in the case nmax= 20 andπ=0:5, which are constants based on sensitivity analysis. Therefore, a final weighted pseudolikelihood was proposed as follows:
QL1.γ1|y,α1,ζ/= n
i=1
1−
1− ui Tmax
ζ
pT1 wriyÅ
i 1−
1−
1− ui Tmax
ζ
pT1
wri.1−yÅ i/
:
We decided to apply this weight scheme only on T1 since it has the most influence at the beginning of the trial as shown in the next section. Moreover, toxicity in the long term, e.g. hearing loss, is more dangerous, and therefore we would not downgrade this toxicity value.
3.5. Dose allocation rule
Afternneonates have been enrolled, of whomn2,n2n, had finished the entire follow-up until the assessment of T2, the dose for the next cohort of neonates is selected from the set of acceptable doses defined as the doses verifying the following set of conditions, where the probabilities are computed using the current parameter estimates:
(a) P.pT1>τT1+1/ <g.n/,
(b) P.pT2>τT2+2/ <g.n2/1n2>1 and (c) P.pE<τE−E/ <g2.n/1n>11,
where1,2andEare specified constants as discussed below.
Finally, the highest efficient dose under toxicity constraints is selected. 1.:::/ refers to the indicator function, which assumes a value of 1 when the condition in the subscript holds and 0 otherwise. In this way T2 and efficacy constraints influence the dose escalation only when available. Adaptive choices of the thresholds,g.n/andg2.n/, are proposed depending on the number of patients who were already enrolled in the trial for which we have data:
g.n/=max
0:5, 0:9 1 1+0:025n
,
g2.n/=max
0:5, 0:9 1 1+0:02n
:
The errorsE,1and2were set equal to 0:02, based on a sensitivity analysis, and in LEV-NEONAT clinical trialτT1=τT2=0:1 andτE=0:6. In the case of no eligible dose, because the minimum effective dose is a dose that is higher than the maximum tolerated dose, the trial is stopped. Furthermore, the trial is stopped ifP.pT1>τT1|d1/ >0:9,P.pT2>τT2|d1/ >0:9 or P.pE<τE|dK/ >0:9, i.e. if the first dose is too toxic or the last dose is not sufficiently efficient, similarly to what is proposed in Thall and Cook (2004). The no-skipping rule is applied, i.e. a dose level can be assigned only if at least one patient is allocated to all lower doses.
At the end of the trial, the minimum effective dose is computed as
de, min=arg min
d∈D|pˆE.d/−τe| and the maximum tolerated dose as
dt, max=min.arg min
d∈D|pˆT1.d/−τp1|, arg mind∈D|pˆT1.d/−τp2|/:
The dose that is recommended at the end is equal todt, maxifde, mindt, maxand none otherwise. The ˆpE.d/, ˆpT1and ˆpT1.d/are defined as the posterior median values of those probabilities given the dosed.
4. Evaluation of the method proposed
4.1. Simulation setting
Table 1. Results for the first three scenarios in terms of correct dose selection for sample sizes of 30, 40 and 50 neonates†
Results for the following doses: PCSs for the following sample sizes:
1 2 3 4 30 40 50
Scenario 1 (recommended dose 3)
pT1,true 0.001 0.01 0.1 0.2 M10.673 M10.737 M10.798
pT2,true 0.001 0.01 0.1 0.2 M20.582 M20.685 M20.766
pE,true 0.6 0.7 0.8 0.9
pa 0 0 0 0
Scenario 2 (recommended dose 3)
pT1,true 0.001 0.01 0.1 0.2 M10.641 M10.742 M10.788
pT2,true 0.001 0.01 0.1 0.2 M20.53 M20.657 M20.717
pE,true 0.6 0.7 0.8 0.9
pa 0.5 0.5 0.5 0.5
pT1|A2,true 0.005 0.05 0.15 0.25
pT2|A2,true 0.005 0.05 0.15 0.25
Scenario 3 (recommended dose 4)
pT1,true 0.001 0.001 0.01 0.1 M10.8 M10.839 M10.871
pT2,true 0.001 0.006 0.026 0.09 M20.698 M20.742 M20.781
pE,true 0.5 0.6 0.7 0.8
pa 0.5 0.5 0.5 0.5
pT1|A2,true 0.005 0.005 0.05 0.15
pT2|A2,true 0.005 0.005 0.05 0.15
†In the second to fifth columns, values forpT1,pT2 andpE along withpa,pT1|A2and pT2|A2used in simulations are summarized for each dose. In the sixth to eighth columns, the percentages of correct selection, PCS, are given.
simulations. We did not change them since they come from clinical relevance; however, we tested them in several scenarios, i.e. we changed the position of the true dose to be selected. The time to toxicity was simulated from an exponential distribution with rate 1=40 h−1, and the number of maintenance doses follows a beta–binomial distribution witha=7 andb=6 to be close to the total number of maintenance doses. This action reflects the physicians’ behaviour of trying to administer all maintenance doses. For simplicity, A2 was considered added after the efficacy evaluation, if it was added. The target probabilities that were chosen for simulations were those specified in the LEVNEONAT protocol, i.e.τT1=τT2=0:1 andτE=0:6.
(a) pT2|Y1=0,truefor the probability of T2 without T1, (b) pT2|Y1=1,truefor the probability of T2 along with T1 and (c) pT2|A2,true, for the probability of T2 when A2 is added.
For simplicity, only marginal probabilitiespT2,truewere reported, but all values can be found in the Web Table 1 in the Web appendix A.
All the scenarios were simulated with (M1) or without relevance weights (M2) associated with the pseudolikelihood scheme. The percentage of correct dose selection, PCS, at the end of the trial, the number of neonates that experienced toxicities,ntox, and dose allocation percent-ages were compared to evaluate our design proposition performance. The posterior quantities were computed by using Hamiltonian Monte Carlo sampling, usingRstanversion 2.6.0 (Stan Development Team, 2016).
4.2. Results
[image:15.485.80.403.323.597.2]Results are shown in Tables 1 and 2. More results in terms of the number of newborns that showed toxicity,ntox, and dose allocation over the entire trial are given in the Web-based supporting materials appendix A. In scenario 1, where A2 was not added, M1had high PCS compared with M2 on the basis of 30 patients and more, above 67%. This simple setting evaluates the
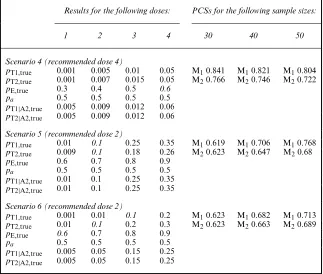
Table 2. Results for the last three scenarios in terms of the correct dose selection for sample sizes of 30, 40 and 50 neonates†
Results for the following doses: PCSs for the following sample sizes:
1 2 3 4 30 40 50
Scenario 4 (recommended dose 4)
pT1,true 0.001 0.005 0.01 0.05 M10.841 M10.821 M10.804
pT2,true 0.001 0.007 0.015 0.05 M20.766 M20.746 M20.722
pE,true 0.3 0.4 0.5 0.6
pa 0.5 0.5 0.5 0.5
pT1|A2,true 0.005 0.009 0.012 0.06
pT2|A2,true 0.005 0.009 0.012 0.06
Scenario 5 (recommended dose 2)
pT1,true 0.01 0.1 0.25 0.35 M10.619 M10.706 M10.768
pT2,true 0.009 0.1 0.18 0.26 M20.623 M20.647 M20.68
pE,true 0.6 0.7 0.8 0.9
pa 0.5 0.5 0.5 0.5
pT1|A2,true 0.01 0.1 0.25 0.35
pT2|A2,true 0.01 0.1 0.25 0.35
Scenario 6 (recommended dose 2)
pT1,true 0.001 0.01 0.1 0.2 M10.623 M10.682 M10.713
pT2,true 0.01 0.1 0.2 0.3 M20.623 M20.663 M20.689
pE,true 0.6 0.7 0.8 0.9
pa 0.5 0.5 0.5 0.5
pT1|A2,true 0.005 0.05 0.15 0.25
pT2|A2,true 0.005 0.05 0.15 0.25
influence of relevance weights, i.e. M1versusM2. Scenario 2 was similar to scenario 1 but with the administration of A2 associated withpa=0:5. In this setting, the PCSs were higher than in scenario 1, as A2 allowed a better estimation of T1 and T2, keeping a similar amount of observedntox across trials (Table 1 in the Web appendix A). Again, PCS by using M1exceeds that by using M2. In scenario 3, the optimal dose under toxicity restrictions was the last of the panel, and A2 was added; the PCS obtained was above 80% by using M1. A higher difference in PCS was observed, compared with scenarios 1 and 2, between M1and M2.
In scenario 4, all doses were safe but only the last was considered efficacious regarding the target of 60%. In this case, the PCSs were above 71% for all sample sizes and regarding M1and M2. Scenario 5 was selected to evaluate a situation where the probabilities of T1 remain the same whereas it increases for T2 when adding A2. The PCSs obtained were higher for M2for sample sizes of 30. In scenario 6 the T1 and T2 were simulated independently from each other. The observed PCS, in this case, was around 60% for all sample sizes and regarding M1and M2. In the Web appendix A, two additional scenarios are given (7—too toxic—and 8—not effi-cient) that evaluate the efficiency of our proposed stopping rules. In these cases, stopping was recommended in 90% on average of cases where all doses were too toxic and in 94% on average of cases where all the doses were not efficient.
In the Web appendix B, we compared the performance of a modification of the TITE CRM when combining the two toxicities in only one variable,YT. We ran simulations in six scenarios, which was considered important to see differences between our method and the modified TITE CRM method (referred as Mtitecrm). This simpler method tends to overdosing patients and the PSCs are lower, above all for small sample sizes.
5. Discussion
The objective of our work was to propose a dose finding method for trials in paediatrics and, more specifically, in neonate populations when delayed toxicities are observed such as in the LEVNEONAT trial. To date, such approaches have been rare in the literature. Indeed, there are fewer clinical trials in neonates, and therefore only a few methods have been proposed or adapted for this vulnerable population. Recently, the European Medicines Agency and Food and Drug Administration have proposed a modification of the ‘Guidance for Industry: E11 clinical investigation of medicinal products in the paediatric population’ where the need for better designs and methods for paediatrics was pointed out. In this work, we have specifically taken into account in our models the real practical issues that prevent us from using other methods that have been proposed for adults. In general, this design could be also used for the evaluation of other drugs treating seizures in neonates, on one hand, or other diseases where toxicities are correlated and a rescue agent is used when one treatment does not work, on the other hand. The models that are presented are very flexible and can be easily adapted to other situations. For example, it is possible to include the scaled time-to-toxicity part, which here was parameterized as a beta distribution, also in the long-term toxicity model to take care of late onset toxicity. The weights that are used for creating the pseudo-observations and the relevance weights can be customized according to prior knowledge on the toxicity and efficacy of the drug. Then, since in our proposed method the two toxicities are estimated in a joint likelihood, it is very easy to add a new constraint on the probability than at least one of the two types of toxicity is lower than the unacceptable threshold. Indeed, the formula can be written as P.Y1=1∪Y2=1/=pT1+pT2|Y1=0.1−pT1/:
method was based on the modelling of efficacy, short-term and long-term toxicities taking into account the number of maintenance doses and a second agent that was highly correlated to a failure outcome. The model was built with the collaboration of investigators and other collaborators who were involved in this trial to develop the best model to answer the clinical question and practice constraints. We modelled T2 conditionally on T1 since we followed the physicians’ knowledge and experience. We tested this hypothesis by adding scenarios where T1 is not predictive for T2, and we found that the model could still achieve proper estimates. A beta distribution was used for the TITE part in the T1 model again after discussing with the investigators. We did not test the case where toxicities appear more at the end of the observational window, but our parameterζis free to take values for which the beta shape is inverted. A richer and more complicated model could have been proposed; however, the small sample size, the small toxicity targets and the constraints on data acquisition led to simplifying some of its aspects. For example, the model does not take into account the correlation between efficacy and toxicity. We decided not to complicate the model since in previous studies the correlation was negligible. However, working with marginal distributions, we do not expect that adding correlation in the model should change the results much (Cunanan and Koopmeiners, 2014). Nevertheless, our proposition was sufficiently richer to reflect the complexity of this dose finding clinical trial. When modelling, there should be a balance between simplicity and the right complicated way to represent clinical considerations and that, when information is available, it should be introduced in the design. Then, this method has the advantage of being easily customized, depending on the application, and this is the reason for thead hocchoices.
In general, the simulation study showed that the model proposed could be a good trade-off between a high PCS and a reasonable number of observed short- and long-term toxicities under small sample constraints. The clinical relevance weights made it possible to avoid becoming stuck during the dose allocation process. Moreover, the model was shown to be robust, i.e. the PCS was less sensitive to sample size. Scenarios were selected to test several possible situations. The probability of adding A2 was set at 50% and not more since we believe that it is useless to perform a clinical trial where most of the neonates received other competing drugs. All fixed parameters were chosen using first investigators’ advice and then testing them in a sensitivity analysis. After the NEMO experience, we took care in modelling T2, and also physicians selected the new drug better. The first inclusion in the LEVNEONAT trial took place in September 2017.
In conclusion, this design was the result of a successful and close collaboration across statis-ticians, physicians and other trial collaborators. In the last 20 years, many dose finding designs have been proposed in the oncology setting and almost none for paediatrics. There is a crucial need for efficient designs in this population, and this paper is an example of how and what can be done. Outcomes that cannot be measured in realtime, such as hearing loss, and the adding of rescue medications are very common features in paediatrics trials and this design can be easily customized for them.
Acknowledgements
We should like to show our gratitude to Estelle Boivin, Bruno Giraudeau, Julie Leger, Elie Saliba and Elsa Tavernier, who are involved in the LEVNEONAT clinical trial, for sharing their opinions and being ready to help and give information to adapt the model for this trial. We also thank two reviewers for their suggestions.
technological development and demonstration under grant agreement FP HEALTH 2013-602144.
References
Azriel, D., Mandel, M. and Rinott, Y. (2011) The treatment versus experimentation dilemma in dose finding studies.J. Statist. Planng Inf.,141, 2759–2768.
Braun, T. M. (2006) Generalizing the TITE-CRM to adapt for early- and late-onset toxicities.Statist. Med.,25, 2071–2083.
Cheung, Y. K. (2011)Dose Finding by the Continual Reassessment Method. Boca Raton: CRC Press.
Cheung, Y. K. and Chappell, R. (2000) Sequential designs for phase I clinical trials with late-onset toxicities. Biometrics,56, 1177–1182.
Chevret, S. (1993) The continual reassessment method in cancer phase I clinical trials: a simulation study.Statist. Med.,12, 1093–1108.
Coppini, R., Simons, S. H., Mugelli, A. and Allegaert, K. (2016) Clinical research in neonates and infants: chal-lenges and perspectives.Pharmcol. Res.,108, 80–87.
Cunanan, K. and Koopmeiners, J. S. (2014) Evaluating the performance of copula models in phase I-II clinical trials under model misspecification.BMC Med. Res. Methodol.,14, article 51.
Denne, S. C. (2012) Pediatric clinical trial registration and trial results: an urgent need for improvement.Pediatrics,
129, e1320–e1321.
Gill, D. (2004) Ethical principles and operational guidelines for good clinical practice in paediatric research: recommendations of the ethics working group of the confederation of European Specialists in Paediatrics (CESP).Eur. J. Pediatr.,163, 53–57.
Gourieroux, C., Monfort, A. and Trognon, A. (1984) Pseudo maximum likelihood methods: theory.Econometrica,
52, 681–700.
Jin, I. H., Liu, S., Thall, P. F. and Yuan, Y. (2014) Using data augmentation to facilitate conduct of phase I–II clinical trials with delayed outcomes.J. Am. Statist. Ass.,109, 525–536.
Lee, S. M. and Cheung, Y. K. (2009) Model calibration in the continual reassessment method.Clin. Trials,6, 227–238.
Liu, S., Yin, G. and Yuan, Y. (2013) Bayesian data augmentation dose finding with continual reassessment method and delayed toxicity.Ann. Appl. Statist.,7, 2138–2156.
McCullagh, P. and Nelder, J. (1989)Generalized Linear Models, 2nd edn. London: Chapman and Hall. Oron, A. P. and Hoff, P. D. (2013) Small-sample behavior of novel phase I cancer trial designs.Clin. Trials,10,
63–80.
Petit, C., Jullien, V., Samson, A., Guedj, J., Kiechel, J. R., Zohar, S. and Comets, E. (2016a) Designing a pediatric study for an antimalarial drug by using information from adults.Antimicrob. Agents Chemther.,60, 1481–1491. Petit, C., Samson, A., Morita, S., Ursino, M., Jullien, V., Guedj, J., Comets, E. and Zohar, S. (2016b) Unified approach for extrapolation and bridging of adult information in early-phase dose-finding paediatric studies. Statist. Meth. Med. Res., to be published.
Pressler, R. M., Boylan, G. B., Marlow, N., Blennow, M., Chiron, C., Cross, J. H., de Vries, L. S., Hallberg, B., Hellstr ¨om-Westas, L., Jullien, V., Livingstone, V., Mangum, B., Murphy, B., Murray, D., Pons, G., Rennie, J., Swarte, R., Toet, M. C., Vanhatalo, S., Zohar, S. and the Neonatal Seizure Treatment with Medication Off-patent (NEMO) Consortium (2015) Bumetanide for the treatment of seizures in newborn babies with hypoxic ischaemic encephalopathy (NEMO): an open-label, dose finding, and feasibility phase 1/2 trial.Lancet Neurol.,
14, 469–477.
Resche-Rigon, M., Zohar, S. and Chevret, S. (2008) Adaptive designs for dose-finding in non-cancer phase II trials: influence of early unexpected outcomes.Clin. Trials,5, 595–606.
Resche-Rigon, M., Zohar, S. and Chevret, S. (2010) Maximum-relevance weighted likelihood estimator: applica-tion to the continual reassessment method.Statist. Interfc.,3, 177–184.
Shen, L. Z. and O’Quigley, J. (1996) Consistency of continual reassessment method under model misspecification. Biometrika,83, 395–405.
Stan Development Team (2016) RStan: the R interface to Stan. R Package Version 2.6.0. (Available from
http://mc-stan.org.)
Thall, P. F. and Cook, J. D. (2004) Dose-finding based on efficacy–toxicity trade-offs.Biometrics,60, 684–693. Thall, P. F. and Nguyen, H. Q. (2012) Adaptive randomization to improve utility-based dose-finding with bivariate
ordinal outcomes.J. Biopharm. Statist.,22, 785–801.
Thall, P. F., Nguyen, H. Q., Zohar, S. and Maton, P. (2014) Optimizing sedative dose in preterm infants undergoing treatment for respiratory distress syndrome.J. Am. Statist. Ass.,109, 931–943.
Yuan, Z., Chappell, R. and Bailey, H. (2007) The continual reassessment method for multiple toxicity grades: a Bayesian quasi-likelihood approach.Biometrics,63, 173–179.
Zhong, W., Koopmeiners, J. S. and Carlin, B. P. (2012) A trivariate continual reassessment method for phase I/II trials of toxicity, efficacy, and surrogate efficacy.Statist. Med.,31, 3885–3895.
Zohar, S. and O’Quigley, J. (2006) Identifying the most successful dose (MSD) in dose-finding studies in cancer. Pharmceut. Statist.,5, 187–199.
Zohar, S., Resche-Rigon, M. and Chevret, S. (2013) Using the continual reassessment method to estimate the minimum effective dose in phase II dose-finding studies: a case study.Clin. Trials,10, 414–421.
Supporting information
Additional ‘supporting information’ may be found in the on-line version of this article: