warwick.ac.uk/lib-publications Manuscript version: Published Version
The version presented in WRAP is the accepted version.
Persistent WRAP URL:
http://wrap.warwick.ac.uk/109056
How to cite:
The repository item page linked to above, will contain details on accessing citation guidance from the publisher.
Copyright and reuse:
The Warwick Research Archive Portal (WRAP) makes this work of researchers of the University of Warwick available open access under the following conditions.
This article is made available under the Attribution-NonCommercial-NoDerivs 3.0 UK: England & Wales (CC BY-NC-ND 3.0 UK) and may be reused according to the conditions of
the license. For more details see: https://creativecommons.org/licenses/by-nc-nd/3.0/
Publisher’s statement:
Please refer to the repository item page, publisher’s statement section, for further information.
Typeset using LTEXmanuscriptstyle in AASTeX62
Three-Dimensional Oscillations of Twenty One Halo Coronal Mass Ejections by Multi-Spacecraft
Harim Lee,1 Y.-J. Moon,1, 2 V. M. Nakariakov,1, 3 Hyeonock Na,1 Il-Hyun Cho,2 and 2
Eunsu Park1 3
1School of Space Research, Kyung Hee University, Yongin 17104, Korea
4
2Department of Astronomy and Space Science, Kyung Hee University, Yongin 17104, Korea
5
3Centre for Fusion, Space & Astrophysics, Physics Department, University of Warwick, Coventry CV4 7AL, UK
6
(Received; Revised ..; Accepted October 1, 2018) 7
Submitted to ApJ 8
ABSTRACT 9
We investigate the 3D structure of kinematic oscillations of full halo coronal mass 10
ejections (FHCMEs) using multi-spacecraft coronagraph data from two non-parallel 11
lines-of-sight. For this, we consider 21 FHCMEs which are simultaneously observed by 12
SOHO and STEREO A or B, from August 2010 to August 2012 when the spacecraft 13
were roughly in quadrature. Using sequences of running difference images, we estimate 14
the instantaneous projected speeds of the FHCMEs at 24 different azimuthal angles 15
in the planes of the sky of those coronagraphs. We find that all these FHCMEs have 16
experienced kinematic oscillations characterized by quasi-periodic variations of the in-17
stantaneous projected radial velocity with the periods ranging from 24 to 48 minutes. 18
The oscillations detected in the analyzed events are found to show distinct azimuthal 19
wave modes. Thirteen events (about 62%) are found to oscillate with the azimuthal 20
Corresponding author: Yong-Jae Moon
wave number m = 1. The oscillating directions of the nodes of the m = 1 mode for 21
these FHCMEs are quite consistent with those of their position angles (or the direction 22
of eruption), with the mean difference of about 23 degrees. The oscillation amplitude 23
is found to correlate well with the projected radial speed of the coronal mass ejection. 24
An estimation of Lorentz accelerations shows that they are dominant over other forces, 25
implying that the magnetic force be responsible for the kinematic oscillations of coro-26
nal mass ejections. However, we may not rule out other possibilities: a global layer of 27
enhanced current around the CMEs or non-linear nature of its driver, for example, the 28
effect of vortex shedding. 29
Keywords: Sun: coronal mass ejections (CMEs) — Sun: oscillations 30
1. INTRODUCTION 31
Coronal mass ejections (CMEs) are the most spectacular eruptions from the Sun into the helio-32
sphere. They are usually thought to be the main source of strong geomagnetic storms (e.g., Gosling
33
et al. 1991; Gosling 1993). It has been well known that the interplanetary propagation of CMEs 34
is controlled by the ambient solar wind (e.g., Lindsay et al. 1999; Gopalswamy et al. 2000,2001a,b; 35
Vrˇsnak & ˇZic 2007). Several authors (e.g., Vrˇsnak et al. 2004; Yashiro et al. 2004) suggested that 36
the interaction between CMEs and the solar wind is an important mechanism that determines CME 37
kinematics. 38
Dynamical processes in the solar corona are often accompanied by the excitation of various kinds of 39
oscillations of coronal plasma non-uniformities, with the periods ranging from a fraction of a second 40
to several hours. The majority of coronal oscillations have been identified as magnetohydrodynamic 41
(MHD) modes of various plasma non-uniformities (see, e.g., De Moortel & Nakariakov 2012; Liu &
42
Ofman 2014, for comprehensive reviews). The interest in MHD oscillations is related to many open 43
questions, such as heating of the plasma, the presence of additional sinks for the energy released in 44
flares, triggering the energy releases, and MHD seismology — diagnostics of plasma parameters and 45
CMEs may be accompanied by MHD oscillations that appear naturally as the response of the 47
elastic and compressive plasma to the energy deposition. The first observation of oscillations in 48
CME kinematics was reported byKrall et al. (2001). Examining the evolution of the speed patterns 49
of the leading-edge and trailing-edge features for a flux-rope-like CME, they found that the projected 50
CME speeds varied with the period of about 4–6 hr. Shanmugaraju et al.(2010) examined the speed– 51
distance profiles of 116 CMEs observed with at least 10 height–time data points, and found that the 52
about fifteen CMEs had quasi-periodic oscillation patterns in the evolution of their speed. The 53
oscillation periods were estimated to be within the range of the upper and lower limit of the Alfv´en 54
travel times along the magnetic ropes of CMEs. Lee et al. (2015) presented the first detection of 55
both radial and azimuthal oscillations in halo CMEs (HCMEs) observed by LASCO C3. They found 56
that the instantaneous projected radial velocity varies quasi-periodically, with the period ranging 57
from 24 to 48 minutes, and that the oscillations of seven CMEs are associated with distinct m = 1 58
azimuthal wave modes, where m is the azimuthal wave number. Michalek et al.(2016) performed a 59
comprehensive statistical study on the kinematics of 187 limb CMEs observed with LASCO. They 60
found that 22% of the CMEs observed in 1996–2004 years revealed periodic variations of the projected 61
radial acceleration and speed, with the average amplitude 87 km s−1, mean period 241 minutes and 62
wavelength 7.8 R. 63
Lee et al. (2015) suggested that the kinematic oscillations of CMEs could be associated with a 64
“zigzag”trajectory of the plasmoid, caused by the periodic shedding of vortices from its alternate sides 65
in the direction perpendicular to the path (Nakariakov et al. 2009). In this scenario, the oscillation 66
period anti-correlates with the CME speed, which was found to be consistent with observations. 67
Michalek et al. (2016) concluded that properties of CME oscillations are consistent with the thin 68
magnetic rope oscillation model of Cargill et al. (1994). Recently, Takahashi et al. (2017) developed 69
a theoretical model of quasi-periodic oscillations of CME ropes, based on time-dependent magnetic 70
reconnection in eruptive flares. The oscillation period was estimated as the ratio of the width of 71
the reconnection outflow near the CME flux rope, and the Alfv´en speed in the inflow region near 72
demonstrated the possibility of an oscillatory behavior of the CME radial and expansion speeds with 74
the periods ranging from ten to several hundred minutes at a heliocentric distance of about 10 R. 75
An important feature of this mechanism is the linear increase in the period with the distance from 76
the Sun, which could be tested observationally. 77
Thus, many authors have shown a variety of oscillatory patterns in the CME kinematics using 78
single spacecraft observations, revealing that it is a common feature of CME propagation. Those 79
findings are supported by the results of theoretical estimations and modeling. However, single-view 80
observations do not provide information about the 3D structure of the oscillations, as coronagraphic 81
observations of CMEs are subject to projection effects (see, e.g. Bronarska & Michalek 2018, for a 82
recent discussion). In particular, it is not clear whether the apparent oscillatory variations of the 83
projected speed of CMEs are radial or azimuthal, i.e. whether the oscillations are polarised along or 84
across the CME propagation direction. There has been so far no attempt to make a simultaneous 85
observation of 3D CME oscillations using imaging observations from different lines-of-sight (LoS). 86
In this paper, we present the first detection of both radial and azimuthal oscillations of full HCMEs 87
using multi-spacecraft observations with non-parallel LoS, and determination of their wave modes. 88
The paper is organized as follows. In Section 2, we describe the data and analysis. Results are given 89
in Section 3. A brief summary and discussion are presented in Section 4. 90
2. DATA 91
In this study, we consider full HCMEs (FHCMEs) observed by the Solar and Heliospheric Observa-92
tory (SoHO) / the Large Angle SpectrosCopic Observatory (LASCO,Brueckner et al. 1995) C3 and 93
the Solar TErrestrial Relations Observatory (STEREO, Kaiser et al. 2008))/ the Sun–Earth Con-94
nection Coronal and Heliospheric Investigation (SECCHI) COR2 from June 2011 to August 2012, 95
when these space missions were approximately in quadrature. During this period of time, the an-96
gular separation of the STEREO-A and -B spacecraft from the Sun–Earth line was in the ranges 97
of 94◦–123◦ and 93◦–115◦, respectively. The field of view of LASCO C3 is 3.7–30 R, and that of 98
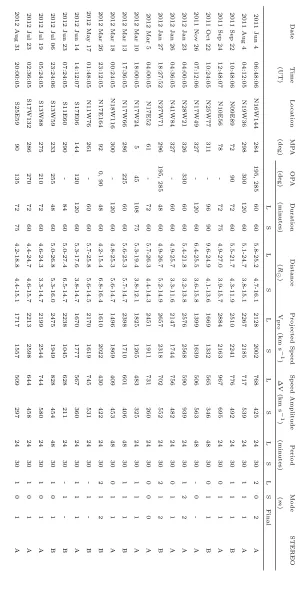
We choose 21 well-observed FHCMEs whose front structures are clearly seen in both C3 and COR2, 100
and whose evolution was traced by at least five consecutive measurements, made at the heights from 101
3.2 to 26.8 R with the time cadence of about 12–15 minutes. The dates, times, source locations 102
and other properties of the events are summarized in Table 1. 103
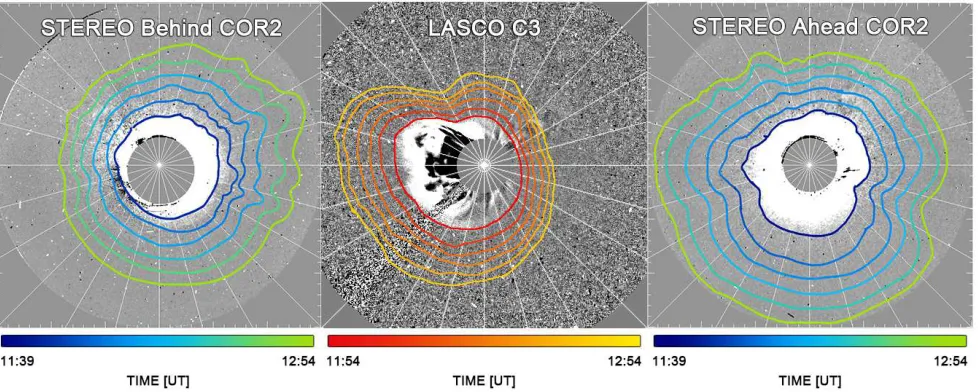
Figure 1 shows running difference images of the 2011 September 22 event, obtained with three 104
satellites: STEREO-B COR2, LASCO C3, and STEREO-A COR2. For each running difference 105
image, we estimate locations of the FHCME’s front edge at every 15◦ of the azimuthal angle (see 106
Figure1). The projected instantaneous speedVinsof the FHCME was determined using two successive
107
height-time measurements at every azimuthal angle. 108
Some uncertainties in determining the speedVinsmay exist because the determination of the HCME
109
front edge locations are made by visual inspection. To estimate the uncertainty of the instantaneous 110
speed estimation, we made ten independent trials of the measurements of the front edge locations, 111
i.e. the technique used by Lee et al. (2015). Then the error is estimated as the standard deviation 112
of those independent measurement, typically about 170 km s−1. 113
To make the running difference images, we use Level 0.5 data obtained by the LASCO/EIT Im-114
ages Query Form (https://sharpp.nrl.navy.mil/cgi-bin/swdbi/lasco/images/form), and the SECCHI 115
Flight images Query Form (https://secchi.nrl.navy.mil/cgi-bin/swdbi/secchi flight/images/form). 116
3. RESULTS AND DISCUSSION 117
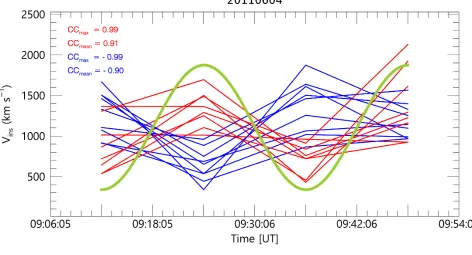
Figure2gives an example of the instantaneous speed measurements, showing the speed as a function 118
of time along different azimuths for the 2011 June 4 event, together with the best-fitting harmonic 119
function. The speed is seen to quasi-periodically oscillate with the distance from the Sun, rather 120
than monotonically increase or decrease. The apparent oscillation was fitted by a harmonic function 121
Vins = ∆V sin(ω(t−K))+b, where ∆V is the amplitude,ωis the cyclic frequency,K is the phase, and
122
b is the mean value, which are determined by the least-square method. Following this approach, we 123
estimate the speed amplitudes ∆V at every azimuth angle, stepping by 15◦, of all events. We restrict 124
our attention to the datasets which have the absolute values of the cross-correlation coefficients with 125
CME speed evolution along a number of azimuthal rays positively correlates with the harmonic func-127
tion, with the maximum cross-correlation coefficient CCmax = 0.99 and the mean cross-correlation
128
coefficientCCmean= 0.91. The speed variation along other azimuthal rays in this CME shows strong
129
anti-correlation with this function, CCmax =−0.99 and CCmean=−0.90. Following this procedure,
130
we estimate instantaneous radial speeds at every 15◦ azimuthal direction, for 21 FHCMEs. We find 131
that all the FHCMEs have oscillatory patterns in the instantaneous projected speeds. In addition, 132
we estimate the maximum observed projected speedsVpro of the FHCMEs, which are obtained from
133
a linear fit of height-time data at every azimuthal angle. Parameters of the detected oscillations, and 134
the CME speeds are given in Table 1. 135
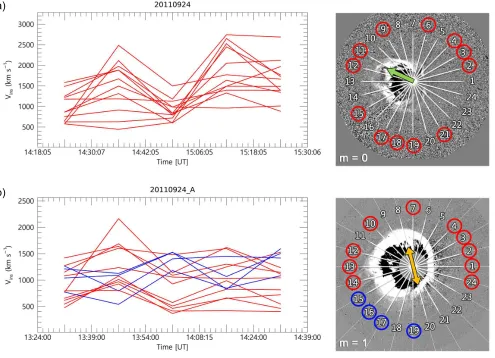
Figure3shows an example in which the oscillatory pattern of instantaneous projected speeds has a 136
systematic azimuthal dependence. This dependence occurs to be different if observed from different 137
LoS, with LASCO C3 and STEREO-A COR2 in the CME shown in the figure. To quantify the 138
azimuthal dependence of the oscillatory patterns, we estimate it as a harmonic function exp(imθ), 139
where θ is the azimuthal angle, and m is an integer representing the azimuthal wave number. The 140
azimuthal wave number m is estimated by the following procedure: (1) according to the phase 141
of the oscillations (see the left panels of Fig. 3) we group the oscillations at all azimuthal angles 142
into the “positive”, “negative”, and “non-oscillatory” groups; (2) we position nodal lines between 143
the azimuthal rays corresponding to the “positive” and “negative” groups; (3) the azimuthal mode 144
numbermof the oscillation is obtained as the number of the nodal lines. The instantaneous projected 145
speed pattern along a given azimuthal angle is considered to belong to either “positive” or “negative” 146
groups if it has the cross-correlation coefficient with the best-fitting harmonic functions either larger 147
than 0.6, or smaller than −0.6, respectively. The oscillation position angle (OPA) is defined as a 148
position angle of the direction that is perpendicular to the nodal line for m = 1, and 45◦ from the 149
nodal line for m = 2. 150
As seen in the left panel of Fig.3a, the oscillatory patterns observed with LASCO C3 in all azimuthal 151
angles have the same phase, and hence positively correlate with the same harmonic function. As 152
depending upon the azimuthal angle, two opposite phases. In the “positive” group of the azimuths 154
the oscillations correlate positively with a chosen harmonic function, while oscillations that belong 155
to the “negative” group correlate with this function negatively. As seen in the right panel of Fig. 3, 156
the azimuthal distribution of the “positive” and “negative” groups observed with COR2 indicates 157
the m= 1 mode. Thus, in this CME the oscillatory pattern observed with LASCO C3 corresponds 158
to the m = 0 mode, while the oscillation observed from another LoS, with STEREO-A COR2, 159
corresponds to the m = 1 mode. The oscillatory patterns are presented in more than 50% of the 160
azimuthal angles. The observed maximum projected speed are found to be about 2,900 km s−1 for 161
LASCO C3 and about 2,200 km s−1 for STEREO-A COR2, respectively. The instantaneous speed 162
oscillation amplitude are estimated to be about 970 km s−1 for LASCO C3 and about 700 km s−1
163
for STEREO-A COR2, respectively. The oscillation period of the FHCME is about 24 minutes for 164
LASCO C3 and 30 minutes for STEREO-A COR2. 165
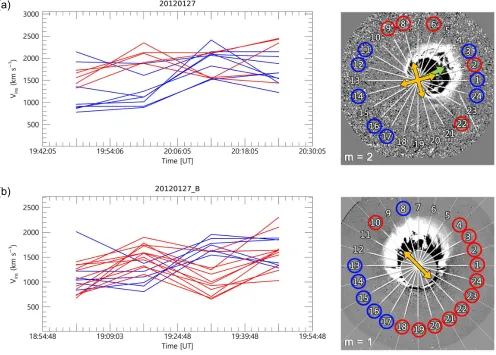
Figure 4 gives an example of a CME with another azimuthal oscillatory pattern. As seen in the 166
right panel of Fig.4, the oscillatory patterns are clearly presented for more than 50% of the azimuthal 167
angles. The observed maximum projected speeds are found to be about 2,700 km s−1 for LASCO 168
C3, and about 2,300 km s−1 for STEREO-B COR2, respectively. The instantaneous speed oscillation 169
amplitudes are found to be about 700 km s−1 for LASCO C3 and about 600 km s−1 for STEREO-B
170
COR2, respectively. The oscillation period of the FHCME is about 24 minutes for LASCO C3, and 171
30 minutes for STEREO-B COR2. As seen in the left panel of Fig. 4, the oscillatory patterns have 172
two opposite phases: positive correlations at some azimuthal angles and negative correlations at the 173
other angles with the same harmonic function. Thus, the oscillation observed in this event is likely 174
of the m = 2 mode from the LASCO C3 LoS, and the m= 1 mode from the COR2 LoS. 175
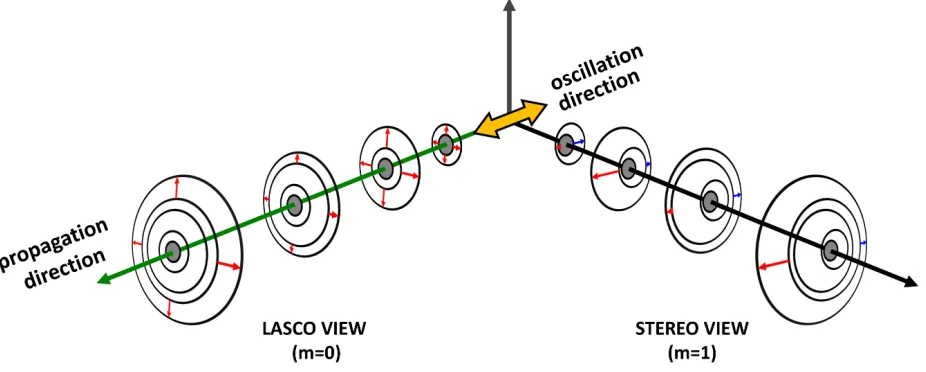
Figure 5 shows a sketch of the possible 3D structure of the kinematic oscillation of the FHCME 176
shown in Fig. 3. If the propagation direction of a CME and its oscillation direction are same, i.e. 177
the oscillation is polarised in the radial (vertical) direction, and the CME is seen from the LoS 178
parallel to this direction, oscillatory patterns along each azimuth should have the same phase (i.e., 179
from another direction. In particular, the apparent oscillatory patterns on either sides of the CME 181
may have opposite phases, i.e. the positive phase at one side and negative phase at the other side 182
(m = 1), if the LoS is perpendicular to the oscillation polarisation direction, see the STEREO view 183
in Fig. 5. This fact shows that when the propagation direction is close to the oscillation direction, 184
its wave mode is not properly identified in the coronagraph observation with the LoS parallel to the 185
propagation direction. In particular, an m = 1 mode would be seen as an m = 0 mode. Therefore, 186
in the identification of the oscillation mode we take a higher azimuthal mode out of two possible 187
modes determined with different observational angles. Results obtained by this procedure for all 21 188
FHCMEs analyzed in this study are summarized in Table 1. 189
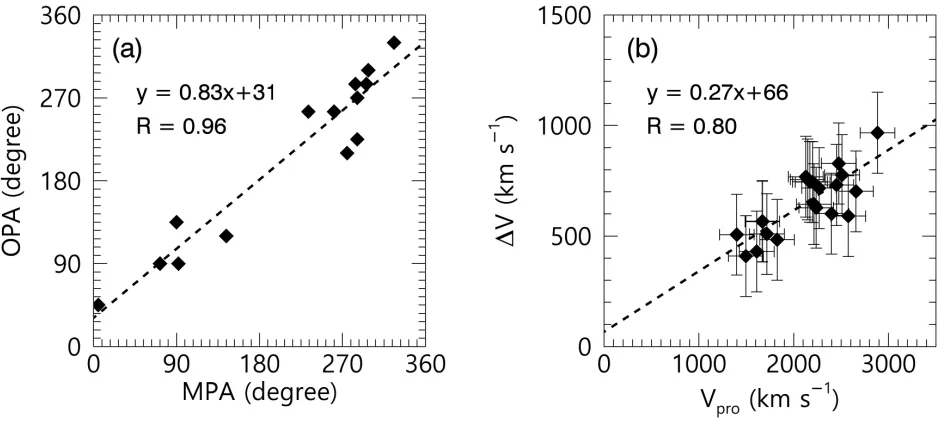
Figure6a shows a relationship between the OPAs determined in this study and the measurement 190
position angles (MPA, obtained from the LASCO catalogue) that corresponds to the projected di-191
rections of solar eruptions. In this plot, we use 13 events (ten events for m= 1 and three events for 192
m= 2), and neglected 9 other events that either are of m= 0 or ambiguous. We find that the OPAs 193
are quite consistent with the MPAs with the correlation coefficient of 0.92, and the mean absolute 194
difference of 23◦. This finding indicates that kinematic oscillations of these FHCMEs are mainly 195
related to solar eruptions. Figure 6b shows a relationship between the oscillation amplitude and the 196
maximum projected speed determined with LASCO C3. We find that there is a good correlation 197
between these two quantities with the correlation coefficient of 0.80. 198
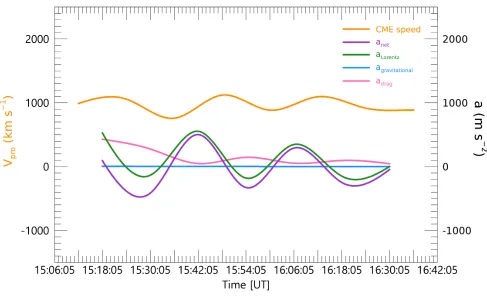
The net acceleration (an) of a CME consists of the combination of the Lorentz acceleration (aL),
199
gravitational acceleration (g = 274/R2), and the aerodynamic drag acceleration (a
d) (Cargill et al.
200
1996; Cargill 2004;Vrˇsnak et al. 2004, 2010) 201
an=aL−g+ad=aL−g−γ(v−w)|v−w|, (1)
where γ is a drag parameter, v is the CME speed, and w is the ambient solar wind speed. The 202
parameter γ (cm−1) is given by 203
γ =Cd
Aρw
where Cd represents the dimensionless drag coefficient, A is the cross section area of the CME
204
perpendicular to the direction of the propagation,ρw is the ambient solar wind density, and mis the
205
CME mass. To estimate these parameters, we use the equations (3)-(6) of Vrˇsnak et al.(2010). The 206
mass of CME was estimated from brightness in LASCO C3 images (for details see Vourlidas et al.
207
2000, 2010). The Lorentz acceleration can be estimated by usingan estimated from the CME speed
208
profile, the drag parameter γ given by Vrˇsnak et al. (2010), and w = 400 km s−1. Figure 7 shows
209
the instantaneous projected speed and the estimations of these three accelerations as a function of 210
time for the analysed event. As seen in the figure, the Lorentz acceleration is dominant over the 211
other ones so that it can be approximated as the net acceleration, which is the derivative of a CME 212
speed. It is also noted that the effect of the drag force may be underestimated or overestimated due 213
to the uncertainties of the drag coefficient and CME mass (Vourlidas et al. 2000, 2010; Sachdeva
214
et al. 2015). Usually, the propagation phase of fast CMEs starts from a few solar radii (Vrˇsnak
215
2006; Bein et al. 2011; Carley et al. 2012; Sachdeva et al. 2017). At large heights, the dynamics of 216
CMEs has been assumed to be dominated by the aerodynamic drag (Gopalswamy et al. 2000,2001a; 217
Vrˇsnak & Gopalswamy 2002; Yashiro et al. 2004; Tappin 2006; Manoharan 2006; Vrˇsnak & ˇZic
218
2007; Vrˇsnak et al. 2008, 2010;Subramanian et al. 2012; Sachdeva et al. 2015; Takahashi & Shibata
219
2017). Our results are inconsistent with the assumption of the past studies. We may conjecture a 220
possibility that there is a global layer of enhanced current around the CMEs. Another possibility is 221
that the kinematic oscillation is the result of local or non-linear nature of its driver as proposed in 222
Nakariakov et al. (2009) andTakahashi et al. (2017). 223
4. SUMMARY AND CONCLUSION 224
Our study has shown the periodic variation of the instantaneous projected speed of FHCMEs, and 225
allowed for determining the modes of the oscillation polarization, based on the imaging coronagraph 226
observations from different LoS, obtained simultaneously with different spacecraft. We consider 21 227
FHCMEs, which were simultaneously observed by SOHO and STEREO A & B from August 2010 to 228
August 2012 when the spacecraft were roughly in quadrature. We estimate the instantaneous speeds 229
find that all these FHCMEs have experienced quasi-periodic variations of the instantaneous projected 231
velocity. The oscillation amplitude is found to correlate well with the projected speed. Durations of 232
the observed oscillations are found to range from 48 to 120 minutes. The oscillation period ranges 233
from 24 to 48 minutes with the average of 33.3 minutes. The range of the detected periods is restricted 234
by the time resolution of the coronagraphs used, and the duration of the detection. The oscillations 235
of 21 events are found to be associated with distinct azimuthal wave modes, and the m = 1 mode is 236
dominant (13 events, 62%). 237
Properties of the kinematic oscillation patterns determined in this study, i.e. the periods, ampli-238
tudes, and durations, are similar to those reported byKrall et al.(2001),Shanmugaraju et al.(2010), 239
Lee et al.(2015), andMichalek et al.(2016). In particular, Lee et al.(2015) determined projected az-240
imuthal wave modes of nine HCMEs. However, previous studies of this phenomenon were performed 241
from a single LoS only, with the LASCO coronagraph, which did not allow the authors to account 242
for the projection effects in the identification of the azimuthal mode of oscillation. The present study 243
based on the use of observations of the oscillations from different LoS with different spacecraft, re-244
duces the ambiguity of the azimuthal wave number identification. The oscillations are found to be 245
polarized in the direction of the CME propagation. Oscillations of this polarization have already 246
been detected at much smaller scale as vertical oscillations of a magnetic flux rope rising up in the 247
corona (Kim et al. 2014). Estimations of the accelerations of the detected CMEs demonstrated that 248
the effect of the Lorentz force is dominant over other forces such as the gravity and drag force. Thus, 249
the magnetic force is likely to be responsible for the kinematic oscillations, and that the oscillations 250
could be modeled by the approach introduced in (Cargill et al. 1994). On the other hand, the depen-251
dence of the oscillation amplitude on the CME speed, confirmed by this study, indicate a nonlinear 252
nature of the oscillations (Nakariakov et al. 2009; Takahashi et al. 2017), associated with the vortex 253
shedding phenomenon (Lee et al. 2015). However, the radial (vertical) polarization of the detected 254
oscillations does not seem to be consistent with the intrinsically perpendicular (horizontal) direction 255
further development of the theory of kinematic oscillations of CMEs, in particular, accounting for 257
their 3D nature and nonlinearity. 258
This work was supported by the BK21 plus program through the National Research Foundation 259
(NRF) funded by the Ministry of Education of Korea, the Basic Science Research Program through 260
the NRF funded by the Ministry of Education (NRF-2016R1A2B4013131), NRF of Korea Grant 261
funded by the Korean Government (NRF-2013M1A3A3A02042232), the Korea Astronomy and Space 262
Science Institute under the R&D program supervised by the Ministry of Science, ICT and Future 263
Planning, the Korea Astronomy and Space Science Institute under the R&D program ‘Development 264
of a Solar Coronagraph on International Space Station (Project No. 2017-1-851-00)’ supervised by 265
the Ministry of Science, ICT and Future Planning, and Institute for Information & communications 266
Technology Promotion(IITP) grant funded by the Korea government(MSIP) (2018-0-01422, Study 267
on analysis and prediction technique of solar flares). V.M.N. acknowledges STFC consolidated grant 268
ST/P000320/1. 269
The SOHO/LASCO CME catalog (http://cdaw.gsfc.nasa.gov/CME list/) is generated and main-270
tained at the CDAW Data Center by NASA and the Catholic University of America in cooperation 271
with the Naval Research Laboratory. SOHO is a project of international cooperation between ESA 272
and NASA. The STEREO/SECCHI data are produced by an international consortium of the NRL, 273
LMSAL and NASA GSFC (USA), RAL and University of Birmingham (UK), MPS (Germany), CSL 274
(Belgium), IOTA and IAS (France). 275
REFERENCES
Bein, B. M., Berkebile-Stoiser, S., Veronig, A. 276
M., et al. 2011, ApJ, 738, 191 277
Bronarska, K., & Michalek, G. 2018, Advances in 278
Space Research, 62, 408 279
Brueckner, G. E., Howard, R. A., Koomen, M. J., 280
et al. 1995, SoPh, 162, 357 281
Cargill, P. J. 2004, SoPh, 338, 453 282
Cargill, P. J., Chen, J., & Garren, D. A. 1994, 283
ApJ, 423, 854 284
Cargill, P. J., Chen, J., Spicer, D. S., & Zalesak, 285
Carley, Eoin P., McAteer, R. T. James, & 287
Gallagher, Peter T. 2012, ApJ, 752, 36 288
De Moortel, I., & Nakariakov, V. M. 2012, Royal 289
Society of London Philosophical Transactions 290
Series A, 370, 3193 291
Gopalswamy, N., Lara, A., Lepping, R. P., et al. 292
2000, Geophys. Res. Let., 27. 145 293
Gopalswamy, N., Lara, A., Yashiro, S., Kaiser, M. 294
L., & Howard, R. A., 2001a, J. Geophys. Res., 295
106, 29207 296
Gopalswamy, N., Yashiro, S., Kaiser, M. L., 297
Howard, R. A., & Bougeret, J.-L. 2001b, J. 298
Geophys. Res., 106, 29219 299
Gosling, J. T. 1993, J. Geophys. Res., 98, 18937 300
Gruszecki, M., Nakariakov, V. M., van 301
Doorsselaere, T., & Arber, T. D. 2010, Physical 302
Review Letters, 105, 055004 303
Gosling, J. T., McComas, D. J., Phillips, J. L., & 304
Bame, S. J. 1991, J. Geophys. Res., 96, 7831 305
Kaiser, M. L., Kucera, T. A., Davila, J. M., St. 306
Cyr, O. C., Guhathakurta, M., & Christian, E. 307
2008, Space Sci. Rev., 136, 5 308
Kim, S., Nakariakov, V. M., & Cho, K.-S. 2014, 309
ApJL, 797, L22 310
Krall, J., Chen, J., Duffin, R. T., Howard, R. A., 311
& Thompson, B. J. 2001, ApJ, 562, 1045 312
Lee, H., Moon, Y.-J., & Nakariakov, V. M. 2015, 313
ApJL, 830, 1 314
Lindsay, G. M., Luhmann, J. G., Russell, C. T., & 315
Gosling, J. T. 1999, SoPh, 104, 12515 316
Liu, W., & Ofman, L. 2014, SoPh, 289, 3233 317
Manoharan, P. K. 2006, SoPh, 235, 345 318
Michalek, G., Shanmugaraju, A., Gopalswamy, N., 319
Yashiro, S., & Akiyama, S. 2016, SoPh, 291, 12 320
Nakariakov, V. M., Aschwanden, M. J., & Van 321
Doorsselaere, T. 2009, A&A, 502, 661 322
Sachdeva, Nishtha, Subramanian, Prasad, 323
Colaninno, Robin, & Vourlidas, Angelos 2015, 324
ApJ, 809, 158 325
Sachdeva, Nishtha, Subramanian, Prasad, 326
Vourlidas, Angelos, & Bothmer, Volker 2017, 327
SoPh, 292, 118 328
Sheeley, N. R., Wang, Y.-M., Hawley, S. H., et al. 329
1997, ApJ, 484, 1 330
Shanmugaraju, A., Moon, Y.-J., Cho, K.-S., et al. 331
2010, ApJ, 708, 450S 332
Subramanian, Prasad, Lara, Alejandro, 333
&Borgazzi, Andrea 2012, Geophys. Res. Lett., 334
39, 19107 335
Takahashi, T., & Shibata, K. 2017, ApJL, 837, 336
L17 337
Takahashi, T., Qiu, J., & Shibata, K. 2017, ApJ, 338
848, 2 339
Tappin, S. J. 2006, SoPh, 233, 233 340
Vourlidas, A., Subramanian, P., Dere, K. P., & 341
Howard, R. A. 2000, ApJ, 534, 456 342
Vourlidas, A., Howard, R. A., Esfandiari, E., 343
Patsourakos, S., Yashiro, S. & Michalek, G. 344
2010, ApJ, 722, 1522 345
Vrˇsnak, B. 2001, J. Geophys. Res.,106, A11 346
Vrˇsnak, B. 2006, Adv. Space. Res., 38, 431 347
Vrˇsnak, B., & Gopalswamy, N. 2002, J. Geophys. 348
Vrˇsnak, B., & ˇZic, T. 2007, Astron. and 350
Astrophys., 472, 937 351
Vrˇsnak, B., Ruˇzdjak, D., Sudar, D., & 352
Gopalswamy, N. 2004, Astron. and Astrophys., 353
423, 717 354
Vrˇsnak, B., Vrbanec, D., & ˇCalogovi´c, J. 2008, 355
Astron. and Astrophys., 490, 811 356
Vrˇsnak, B., ˇZic, T., Falkenberg, T. V., M¨ostl, C., 357
Vennerstrom, S., & Vrbanec, D. 2004, Astron. 358
and Astrophys., 512, 43 359
Yashiro, S., Gopalswamy, N., Michalek, G., et al. 360
Figure 1. Running difference images of the 2011 September 22 FHCME at 11:39 - 12:54 UT. All
measure-ments are made at every 15◦ (white lines). The color contour lines show the locations of the front edges of
Figure 2. Profiles of the instantaneous projected speeds measured along different azimuthal angles in the
2011 June 4 FHCME. Only the speed profiles with the absolute values of the correlation coefficients with
the harmonic function shown in green, larger than 0.6 are shown. The red and blue lines show positive and
Figure 3. Oscillatory patterns in the 2011 September 24 FHCME (Left), and their azimuthal dependences
(Right) observed with: (a) LASCO and (b) STEREO-A. In the left panels, the red and blue lines have the
same meaning as in Figure 1. In the right panels, the red and blue circles indicate the azimuths in which
the oscillations correlate either positively (red), or negatively (blue) with the best-fitting harmonic function.
The yellow and green arrows show the OPAs and MPAs, respectively. In the left bottom, the azimuthal
Figure 4. Oscillatory patterns of the 2012 January 27 FHCME (Left) and its azimuthal dependence (Right)
Figure 5. A simplified schematic diagram of the kinematic oscillation of the 2011 September 24 FHCME
observed from different angles with two coronagraphs. The yellow arrow indicates the direction of the
oscillation. The green arrow corresponds to the propagation direction of the FHCME. The red and blue
arrows show the variation of the instantaneous projected speeds which have two opposite phases: positive
Figure 6. Correlations of various parameters of oscillating FHCMEs from LASCO C3: (a) MPA and OPA
and (b) the observed maximum projected speed (Vpro) and the oscillation amplitude (∆V). The dashed lines
indicate linear fits to the data. The error bars correspond to the standard deviations of the speeds from five
Figure 7. Profiles of the instantaneous projected speed and acceleration of the 2012 March 10 event from
LASCO C3. The orange line indicates the maximum projected speed of the CME. The purple, green, blue