warwick.ac.uk/lib-publications
Manuscript version: Author’s Accepted Manuscript
The version presented in WRAP is the author’s accepted manuscript and may differ from the
published version or Version of Record.
Persistent WRAP URL:
http://wrap.warwick.ac.uk/115961
How to cite:
Please refer to published version for the most recent bibliographic citation information.
If a published version is known of, the repository item page linked to above, will contain
details on accessing it.
Copyright and reuse:
The Warwick Research Archive Portal (WRAP) makes this work by researchers of the
University of Warwick available open access under the following conditions.
Copyright © and all moral rights to the version of the paper presented here belong to the
individual author(s) and/or other copyright owners. To the extent reasonable and
practicable the material made available in WRAP has been checked for eligibility before
being made available.
Copies of full items can be used for personal research or study, educational, or not-for-profit
purposes without prior permission or charge. Provided that the authors, title and full
bibliographic details are credited, a hyperlink and/or URL is given for the original metadata
page and the content is not changed in any way.
Publisher’s statement:
Please refer to the repository item page, publisher’s statement section, for further
information.
DBEst: Revisiting Approximate Query Processing
Engines with Machine Learning Models
Qingzhi Ma
University of Warwick
[email protected]
Peter Triantafillou
University of Warwick
[email protected]
ABSTRACT
In the era of big data, computing exact answers to analyt-ical queries becomes prohibitively expensive. This greatly increases the value of approaches that can compute effi-ciently approximate, but highly-accurate, answers to analyt-ical queries. Alas, the state of the art still suffers from many shortcomings: Errors are still high, unless large memory in-vestments are made. Many important analytics tasks are not supported. Query response times are too long and thus ap-proaches rely on parallel execution of queries atop large big data analytics clusters, in-situ or in the cloud, whose acqui-sition/use costs dearly. Hence, the following questions are crucial: Can we develop AQP engines that reduce response times by orders of magnitude, ensure high accuracy, and support most aggregate functions? With smaller memory footprints and small overheads to build the state upon which they are based? With this paper, we show that the answers to all questions above can be positive. The paper presents DBEst1, a system based on Machine Learning models (re-gression models and probability density estimators). It will discuss its limitations, promises, and how it can complement existing systems. It will substantiate its advantages using queries and data from the TPC-DS benchmark and real-life datasets, compared against state of the art AQP engines.
CCS CONCEPTS
•Information systems→Database query processing; Query optimization;Online analytical processing engines.
1’Est’ derives from the Latin verb ‘to be’and the prefix from ‘estimator’
Permission to make digital or hard copies of all or part of this work for personal or classroom use is granted without fee provided that copies are not made or distributed for profit or commercial advantage and that copies bear this notice and the full citation on the first page. Copyrights for components of this work owned by others than the author(s) must be honored. Abstracting with credit is permitted. To copy otherwise, or republish, to post on servers or to redistribute to lists, requires prior specific permission and/or a fee. Request permissions from [email protected]. SIGMOD ’19, June 30-July 5, 2019, Amsterdam, Netherlands
© 2019 Copyright held by the owner/author(s). Publication rights licensed to ACM.
ACM ISBN 978-1-4503-5643-5/19/06. . . $15.00 https://doi.org/10.1145/3299869.3324958
KEYWORDS
Analytics, big data, efficiency, machine learning
ACM Reference Format:
Qingzhi Ma and Peter Triantafillou. 2019. DBEst: Revisiting Approx-imate Query Processing Engines with Machine Learning Models.
In2019 International Conference on Management of Data (SIGMOD
’19), June 30-July 5, 2019, Amsterdam, Netherlands.ACM, New York,
NY, USA, 18 pages. https://doi.org/10.1145/3299869.3324958
1
INTRODUCTION
We live in the era of big data, whose timely, accurate, and inexpensive analysis bears great opportunities and benefits which permeate practically all facets of our lives.Analytical queries in this realm typically rely on two fundamental com-ponents. Firstly, selection operators (such as range predi-cates) help focus on specific data regions. Secondly, aggrega-tion funcaggrega-tions (such as AVG, SUM, COUNT, PERCENTILE, VARIANCE) are applied on the selected data regions to pro-vide key insights. In SQL, a core component of a large class of analytical queries takes the form:
S EL E C T AF ( y ) FROM T
WHERE x B E T W E E N lb AND ub ;
where range predicates on attributes (x) are used to define a data region within that of (a csv file or) table T, and an ag-gregation function AF is used on attributey. A close look at many real-world data sets and analytical workloads reveals that certain types of data attributes play a key role. Obviously, AFs operate on numerical attributes. Additionally, selection operators often operate on numerical attributes as well, or equivalently on ordinal categorical attributes, such as dates, time, location, etc. Examples abound: Sensor and IoT datasets are a significant contributor to the big data phenomenon. Smart city analytical queries involve ranges on time, loca-tion, wind speed, air pressure e.g., to analyze pollution (e.g., PM2.5, CO2 levels, etc. [33]). Smart home analytics involve measurements (temperature, humidity, etc.) to analyze home power consumption. Power plants in operation, engineering plants, scientific applications (from astronomy to bio-medical applications) are awash with such data and analytics needs.
and deriving descriptive statistics information (using AFs) about said subspaces. Within data warehouses/databases, the above query type may be augmented withGROUP BY
operators, whereby the AF is performed separately for each value of the group attribute. Finally, queries may involve more than one table, requiring their join and performing the above analyses on the join-result table.
Unfortunately, the timely, accurate, and inexpensive anal-ysis of big data presents formidable challenges. Traditional solutions do not scale well, suffer from long response times, and/or require large money investments to deploy them on top of big data analytics stacks (e.g., [17, 57, 59]). To ad-dress these challenges, AQP strives for approximate-but-accurate-enough answers which can be delivered swiftly. AQP has been studied for over two decades now, and signifi-cant progress has been made. Nonetheless, as data continue to grow in size, AQP engines struggle to keep up.
Motivations
The state of the art in AQP research has been dominated by sampling-based approaches, broadly divided into two categories. First, techniques that rely on online sampling, create samples on the fly during query execution and use them to approximate answers. The second category of re-search, exploits the fact that often query workloads are (at least partially) predictable, in the sense that one can know beforehand the popular query templates, including for exam-ple the attributes for range predicates, the joined tables and join keys, the grouping attributes, used together. Given this knowledge, these works create offline samples for selected tables and column sets, kept in memory, and process queries over said samples. But, across the spectrum, the state of the art still suffers from several shortcomings.
How long does it take a state of the art AQP engine to answer an analytical query of the types above over a mid-sized table (say, of a few Billion tuples)? Are, say, several minutes, acceptable? Is it acceptable to rely on the use of large clusters of tens or hundreds of nodes/cores upon which each query is sent to execute in order to bring response times to a few seconds? What if analysts cannot afford to procure such infrastructures or pay the cost to use them online on clouds? What are the implications of having each query execute across all nodes/cores on system throughput? Even then, can we do better than seconds? How much space is required to achieve such response times? Is ca. 10% relative error acceptable given the above time/space/money investments? And, how many analytical operators (i.e., AFs and other analytics tasks) can be supported, even at such costs?
This paper is driven by these questions, the answers to which currently leave a lot to be desired. We revisit the
problem and solution space.The overriding guiding prin-ciple is to develop and study a model-driven solution, instead of a data-driven solution, where queries are an-swered by models of data and not the data itself (or samples of it). The principal challenges and goals are to develop and experimentally substantiate such a model-based AQP engine that is much more efficient, ensures high accu-racy, and investigate its benefits and limitations.The key insights of this work is to exploit the ability of models to generalize. This affords the luxury of building the models from very small samples. Combined, these facts ensure small overheads, with shorter response times, even with just a single-thread, thus rendering analytics less costly and achieving much higher system throughput.
Contributions
This paper presents the design and implementation of DBEst, an AQP engine supporting the aforementioned analytical needs, using prebuilt, a priori state (i.e., models over samples of datasets), while offering, compared to the state of the art: • orders of magnitude shorter query response times, • orders of magnitude higher throughput
• significantly smaller memory footprints per query, • high accuracy,
• support for all mentioned aggregate functions, and • short state-building times.
The paper will:
• show how to develop and train appropriate models and how to use them to answer analytical queries,
• analyze the sensitivity of and stress DBEst’s performance on key parameters, such as sample sizes used to derive the models, the selectivity of selection operators, the effect of groups in Group By, the effect of joins, etc.
• perform a comprehensive performance evaluation of DBEst, comparing it against state of the art big data AQP engines, (BlinkDB and VerdictDB), using queries based on the TPC-DS queries and its schema/data and synthetic queries over real-life UCI-ML repository datasets.
• evaluate single-threaded and multi-core DBEst performance and show that even the sequential DBEst can often achieve large (>10x) query processing speedups against a 12-core state of art AQP engine and that this can help achieve 10x to 30x speedups in system throughput.
of aggregation functions over the dependent variable, when independent-variable values are missing or hypothesized, (iv) quickly discovering relationships between attributes, (v) quickly visualizing descriptive statistics for the dependent attribute in data subspaces, etc. In general, DBEst provides support for predictive analytics, hypotheses testing, etc.
[image:4.612.60.288.249.318.2]2
THE DBEST AQP ENGINE
2.1
System Overview
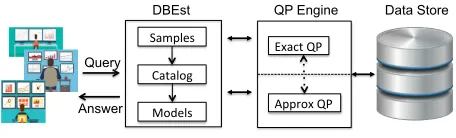
Fig. 1 shows the architecture of DBEst. DBEst is independent of the underlying storage layer; it can be just a local FS, an RDBMS, or a distributed FS, and/or a NoSQL DB.
QP Engine DBEst
Analysts
Catalog Samples
Models
Data Store
Exact QP
Approx QP
Query
Answer
Figure 1: DBEst architecture.
There are three major components: (1) The sampling mod-ule interacts with the storage layer to build samples; (2) The models module, consists of density estimators and regres-sion models, which are built from the samples. (3) The model catalog stores information for the available models and their correspondence to the column sets and tables of the base data they model. When a query arrives, DBEst reads the model catalog to check for models that could answer it. If so, the particular models will be used to process the query. If not, the query will be sent to an underlying system in the level below it, as shown in the architecture. This can be another AQP engine (e.g., one with online sampling, QuickR [29]) or it can go directly to an exact answer QP engine.
2.2
Supported Queries
DBEst belongs in the class of AQP for predictable/popular query templates. In this class, as mentioned, DBEst supports analytical queries, involving range predicates and aggre-gate functions, includingCOUNT, SUM, AVG, VARIANCE, STDDEV and PERCENTILE. DBEst also supportsGROUP BY
operators. To be concrete, the following is typical in queries in TPC-DS [36]. Given a tablestore_sales, with the col-umn of interest,ss_quantity, return the average value of
ss_ext_discount_ amtwithin a specific range.
S E L E C T s s _ s t o r e _ s k , SUM( s s _ s a l e s _ p r i c e )
FROM s t o r e _ s a l e s
WHERE s s _ s o l d _ d a t e _ s k B E T W E E N lb AND ub
GROUP BY s s _ s t o r e _ s k ;
returns the sum ofss_sales_pricewithin the given range ofss_sold_date_sk, for eachss_store_skgroup value.
Thus, DBEst supports straightforwardly selections on nu-merical and ordinal categorical attributes for all AFs men-tioned above, optionally coupled withGROUP BYoperators. DBEst can also provide support for selections on nominal categorical attributes, as will be discussed later.
DBEst does not support ad hoc join queries with no pre-built models. In these cases, DBEst will revert to the under-lying AQP engine (e.g., QuickR [29], or VerdictDB [39]).
DBEst supports joins for predictable/popular joined tables using two alternative approaches. The first approach follows the following steps: First, precompute the join result table, then build a (small) sample over it, and finally build regres-sion and density estimator models over this sample. Please note that this is particularly possible for DBEst, as neither the original join result nor any large sample of it need be maintained - both join result and the sample can simply be discarded after models are built. Only the models need be stored and used during query processing. And models are very small in size (typically a few 100s KBs). This is in con-trast to the state of the art AQP engines [29, 39] which must compute the join based on (universe/hashed) per-table sam-ples (each having typically 10s of millions of tusam-ples) online during query execution. The performance evaluation section will provide details and quantify the resulting benefits.
The second approach improves on the precomputation time when joining very large tables. Specifically, each large join table can be sampled (using hashed samples) and the join be computed based on these samples (a la VerdictDB and QuickR). Finally, a small uniform sample is built from the sample join and models are built from this small sample.
DBEst does not support general nested queries. When nested queries can be ’flattened’ using joins, (as done in VerdictDB [39]) then DBEst can support these nested queries using the above explained support for joins. Finally, DBEst does not currently support UDAs.
2.3
DBEst Query Processing Foundations
In contrast to competing AQP approaches where samples are generated and maintained to answer queries, DBEst chooses an alternative approach. It builds models, specifically regres-sion models and density estimators, through which aggregate queries are answered with high accuracy and efficiency and at lower costs. In this section, we describe in detail the math-ematical foundations for providing approximate answers for analytical queries.categories:density-basedandregression-based. For density-based aggregate functions, only the density estimator D(x) is needed to make the prediction; for regression-based ag-gregate functions, both the density estimator D(x) and the regression model R(x) are involved. Table 1 contains the notation used in this section.
Notation Description
T original table
Q a query
AF
a supported aggregate function, is one of COUNT, SUM, AVG, VARIANCE, STDDEV, PERCENTILE
x the independent variable (column), usually accompanied with a condition.
y the dependent variable (column) in the query, which is the aggregate attribute
p thep
thpercentile point for
aPERCENTILEquery.
CP a unique column pair, consisting of x and y N the size of Table T
n the size of the sample
S(CP,n) the sample, for column pair CP, with the sample size of n
lb the lower bound of x for the aggregate query ub the high bound of x for the aggregate query
R(x) the regression model of x, training from [x,y] pairs.
[image:5.612.328.558.311.451.2]D(x) the density estimator over column x, which is normalized to unity.
Table 1: Notation in §2
We now discuss how each aggregate is processed in DBEst. The PERCENTILE AF has a syntax a la HIVE, which is:
S E L E C T P E R C E N T I L E ( x , p ) FROM T ;
which returns an approximatepthpercentile of the numeric columnxfor TableT.
For regression-based aggregate functions, as a regression modelR(x)is built betweenyandx,R(x)is used to provide an approximate answer fory. DBEst could answer two kinds of VARIANCE AFs: regression-based and density-based. Density-based VARIANCE AFs take the following general form:
S E L E C T V A R I A N C E ( x ) FROM T
WHERE x B E T W E E N lb AND ub ;
where only (column) x is involved in the query. Regression-based VARIANCE queries take the following form:
S E L E C T V A R I A N C E ( y ) FROM T
WHERE x B E T W E E N lb AND ub ;
having both independent and dependent variables. These require both the density estimator and the regression model.
2.3.1 Computing Aggregates with Density Estimators.
Density-Based Aggregate Functions includeCOUNT, VARIANCE, STDDEVandPERCENTILE.
COUNT. Formally:
COU NT(y) ≈N·
∫ ub
lb D(x)dx
(1)
The integral of the density estimator is evaluated in inter-val given in the range selection operator, i.e.,∫lbubD(x)dx, yielding the proportion of data points that lie within this range. N (the size of the table), scales up∫lbubD(x)dxto be an approximate representation of the total number of points in this range.
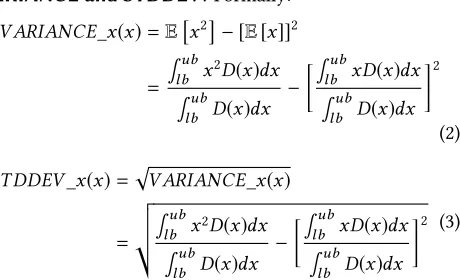
VARIANCE and STDDEV.Formally:
V ARIANCE_x(x)=E
x2
− [E[x]]2
= ∫ub
lb x2D(x)dx
∫ub
lb D(x)dx
− ∫ub
lb xD(x)dx
∫ub
lb D(x)dx
2
(2)
ST DDEV_x(x)=pV ARIANCE_x(x)
= v u u t∫ub
lb x2D(x)dx
∫ub
lb D(x)dx
− ∫ub
lb xD(x)dx
∫ub
lb D(x)dx
2 (3)
By definition, the variance ofxis equal toEx2− [E[x]]2.
The expectation ofxandx2could be calculated via the inte-grals involving the density estimatorD(x)as shown above.
PERCENTILE. In general,PERCENTILEreturns the valuep,
for whichP(x <α)=p. Thus, given the probability density estimatorD(x)and thepth percentile point, the problem translates to finding the valueα that meets∫−∞α D(x)dx =
p. Note,∫−∞α d(x)dx is the cumulative distribution function (CDF), and is usually denoted as F(x). Thus, the problem becomes finding the root for equation
F(x)=p (4)
If the reverse of the CDF,F−1(p), could be obtained, then the pthpercentile for Columnxis
α=F−1(p) (5)
2.3.2 Computing Aggregates with Regression Models. Aggre-gates that can be computed using regression models include
SUM, AVG, VARIANCEandSTDDEV.
AVG. Formally:
AVG(y)=E[y]
≈E[R(x)]
= ∫ub
lb D(x)R(x)dx
∫ub
lb D(x)dx
(6)
The average value ofy, or its expectation E[y], could
be approximately treated as the expectation ofR(x), which isE[R(x)]. To calculate the average value of a continuous
functionR(x), we only need to know its density function.
SUM. Formally:
SU M(y)=COU NT(y) ·AVG(y)
≈COU NT(y) ·E[R(x)]
=N· ∫ ub
lb D(x)dx·
∫ub
lb D(x)R(x)dx
∫ub
lb D(x)dx
=N· ∫ ub
lb D(x)R(x)dx
(7)
The sum ofyequals the product of the count and the aver-age value ofy. From Equation 1 and 6, we get the approximate representations of the count and average value ofy: mul-tiplying equation 1 by equation 6, we get the approximate representation of SUM(y), which isN ·∫lbubD(x)R(x)dx.
VARIANCEandSTDDEV. (Please refer toDensity-Based
Aggre-gate Functionsfor the density-basedVARIANCEandSTDDEV
AFs). Formally:
V ARIANCE_y(y)=Ey2
− [E[y]]2
≈ER2(x)
− [E[R(x)]]2
= ∫ub
lb R2(x)D(x)dx
∫ub
lb D(x)dx
− ∫ub
lb R(x)D(x)dx
∫ub
lb D(x)dx
2
(8)
ST DDEV_y(y)=pV ARIANCE_y(y)
≈pV ARIANCE_x(R(x))
= v u u t∫ub
lb R2(x)D(x)dx
∫ub
lb D(x)dx
− ∫ub
lb R(x)D(x)dx
∫ub
lb D(x)dx
2
(9)
By definition, the variance ofyis equal toEy2− [E[y]]2.
ReplacingywithR(x), gives an approximation ofVARIANCE(y).
Supporting Group By
DBEst supportsGROUP BYqueries of the form: S EL E C T z, AVG( y ) FROM T
WHERE x B E T W E E N lb AND ub
GROUP BY z;
DBEst’s rationale is to treat each value ofzas a separate data set over which to evaluate the given AF. Therefore, during sampling, a sample is recorded per eachzvalue. Sub-sequently, the models are built and used per each such sample to compute the AFs, as detailed above.
Thus, given aGROUP BYquery, DBEst will call all models built for thezvalues, and the predictions from all models form the result for this particular query.
Supporting Multivariate Selection Operators
So far, supported queries included a range predicate over a single attribute. The multivariate range-selection operator can be straightforwardly supported. The mathematical foun-dation for multivariate aggregate query processing is similar to the univariate query processing. TakeAVGqueries as an example and an aggregate query with the following form:S EL E C T AVG( y ) FROM T
WHERE x1 B E T W E E N lb1 AND ub1 AND x2 B E T W E E N lb2 AND ub2 ;
TheAVGaggregate ofycould be approximately treated as:
AVG(y)=E[y]
≈E[R(x1,x2)]
= ∫ub1
lb1 ∫ub2
lb2 D(x1,x2)R(x1,x2)dx2dx1
∫ub1
lb1 ∫ub2
lb2 D(x1,x2)dx2dx1
(10)
And this could be extended to higher dimensions, as well as other aggregates, following the formulas given earlier.
Supporting Categorical Attributes
For ordinal attributes the treatment is straightforward as attribute values essentially map to ordered numbers. Hence, supported queries include range predicates on such attributes. For nominal attributes there is no simple way to transfer the values to meaningful numbers. DBEst’s support for nomi-nal categorical attributes mimics the support forGROUP BY
attributes by maintaining regression and density estimator models for each nominal value, such as store_ids, city, or classes of products in a commercial application, etc.
Limitations
overall training time. (Fortunately, this task is embarrassingly parallelizable). Likewise, this affects also query response times: Each model (one per group) needs be evaluated; again, this is embarrassingly parallelizable.
Similarly, although per-model the space savings of DBEst are very large, the required space grows linearly with the number of groups. DBEst has the following alternatives: First, to not build models when the number of groups is too large. This is inline with what VerdictDB does for "large cardinality" groups, reverting to an exact answer QP engine for such queries. Admittedly, alas, the problem for DBEst is more serious. Second, to ‘sacrifice’DBEst’s space savings in order to just enjoy the large speedups when processing queries over the models instead of on (sampled) data.
Even further, DBEst can store models for queries having very large group cardinalities in an SSD. We have imple-mented this creatingmodel bundles, each of which bundles all the models needed by a query with a large number of groups. Concretely, consider a query that requires a join of a (10m-row sample of a) large fact table with a small dimension table and 500 of groups (models). Serializing this bundle of 500 models amounts to 97MBs. Reading from the SSD and deserializing such a bundle takes <132ms. Added to the ca. 600ms needed to process this join withGROUP BYquery in DBEst gives a total of <800ms response time. To put this in context, VerdictDB requires ca. 8secs for such a query, a speedup of 10x.
Small groups pose additional limitations. Specifically, build-ing models over small groups is an overkill; it is preferable to just keep and process the small number of tuples in the group. This is inline with what state of the art AQP engines: they do not build samples over small tables. Even QuickR [29] which builds samples online, discovered that a 25% of all queries in TPC-DS cannot be supported due to groups not having enough support.
Finally, unlike sampling-based AQP engines, DBEst cur-rently does not provide a priori error guarantees.
3
IMPLEMENTATION
As shown in Fig. 1, a sample is firstly generated for every column set of interest, which is used to train a regression model and a density estimator, which are in turn then used to answer analytical queries on this column set.
Sampling
Stratified sampling [34] is usually the first choice when we try to filter or group data. It avoids the difficulties when deal-ing with rare groups and highly skewed data distributions. However, it also increases the difficulty if we try to build a regression model or a density estimator over a stratified sample. DBEst relies solely on reservoir sampling [55] to
generate uniform samples over the original table. Different
GROUP BY values are recorded from the original table dur-ing the traindur-ing process, and they are further used to check whether any group is underrepresented in the samples. Our experiments show that this suffices to provide excellent per-formance with respect to accuracy and efficiency for all AFs and forGROUP BY, across all tested data sets.
As DBEst is a model-based AQP engine, any samples it builds are deleted after model training. Thus, DBEst sig-nificantly reduces memory requirements, as its models are significantly smaller than the samples. Also, as accuracy de-pends on sample sizes, this indirectly affords the opportunity to use larger samples for training models.
Density Estimator
There are many existing density estimation methods, in-cluding the kernel estimator, the nearest neighbor method, the variable kernel method, orthogonal series estimators, etc [51]. Histograms are the simplest form of density esti-mators and have enjoyed a prominent role in DBs [3] for enhancing query processing performance. However, their discrete nature is at odds with the continuous-function view employed within DBEst. Therefore, the kernel density esti-mation method is chosen as the density estimator in DBEst as it has been found to be highly accurate and efficient.
The density estimation implementation is based on
sklearn.neighbors.KernelDensityfrom the scikit-learn package [42], which uses the Ball Tree or KD Tree. In ad-dition, kernel density estimation can be performed in any number of dimensions, allowing DBEst to extend its support for multivariate query processing.
Regression Model Selection
High performance regression models include XGBoost [12], catboost [45], LightGBM [30], gradient boosting (GBoost) [21], etc. DBEst resorted to boosted regression tree models since its models must be powerful so to generalize as they are built from small samples.
regressors is best for a given range predicate.The XGBoost classifier was used for this purpose. To shed light into the im-pact of the regression model, our evaluation section provides more details for the related times-accuracy-speed trade-offs.
Selecting which Models to Build
This is a generic problem faced by all related efforts in AQP, that build, a priori state (samples, sketches, or ML models, as we do) for popular/predictable queries. Approaches range from trying all combinations for column sets (e.g. [1, 10]), mining query logs, like BlinkDB [4] which showed that in-teresting column sets can be identified early in the execution of a typical workload, or depending on users, like VerdictDB [38], to identify popular tables, etc. DBEst is rather orthog-onal to this - any of the above approaches can be used. All experiments assume knowledge of said column sets of inter-est, given which DBEst builds samples, models, and evaluates queries.
Integral Evaluation
The efficiency of the integral evaluation implementation has a great impact on the performance of DBEst, with in-teresting accuracy-efficiency trade-offs. Fortunately, this is a well-studied problem. The integral evaluation package adopted in DBEst comes from theintegrate module in
SciPy[27], which uses a technique from the Fortran library
QUADPACK[43]. The underlying Gauss-Kronrod quadrature sums are fundamental to many of the automatic subroutines inQUADPACK. Given an integral
Iw[lb,ub]f = ∫ ub
lb w(x)f(x)dx (11)
over an interval [lb, ub], wherew(.)is a weight function, then a quadrature sum yields an approximation
Iw[lb,ub]f ≈
n
Õ
k=1
wkf(xk) (12)
In Equation 12, the numbersx1,x2, ...,xn are nodes, and
w1,w2, ...,wnare weights corresponding to these nodes. To
calculate a numerical approximation for the integral prob-lem within absolute accuracyϵa or a relative accuracyϵr, QUADPACKcomputes the sequences
{Rnk,Enk},k =1,2, ...,N (13)
WhereRnkis an estimation to the integral value, andEnkis an error estimation at the iteration stepnk.QUADPACKchooses an adaptive approach that the position of the integration points of thenthiterate depends on the information gathered from iterate 1, ...,n−1.
Parallel/Distributed Computation
Much of DBEst’s internal functioning is embarrassingly par-allelizable and can be performed on centralized data nodes or on clusters of data nodes within big data analytics stacks. First, sampling is easily parallelizable, as different nodes stor-ing dataset partitions can independently participate in the sampling process. Secondly, model training can be performed in parallel. And, for models supportingGROUP BYqueries, samples for each group can be distributed and model training can occur in parallel. As mentioned, the chosen regression model is an ensemble, consisting currently of two different regression models (gradient boosting and XGBoost). Each of these can be trained in parallel. In fact, several open-source packages are available. For the parallel implementation of DBEst we have used these packages.
Thirdly, query processing can easily be parallel. Alterna-tively, DBEst query execution can remain sequential and ad-ditional nodes/cores in the system can be utilized to process other queries, improving significantly system throughput. Our evaluation section will quantify such savings.
ForGROUP BYqueries, evaluation of the models of the different group attribute values can be done in parallel. Our implementation for this feature is currently suboptimal: (i) as it is Python-based, we ran into the Global Interpreter Lock problem (only 1 thread can use the interpreter at a time) and the fix we implemented (based on using multiple separate processes is suboptimal); (ii) the packages we use for model evaluation and integral computation are amenable to parallel execution but currently we have implemented no control to orchestrate overall core/node assignment to tasks. As a result, these subtasks conflict with each other for resources. Despite this, our results show that parallel DBEst can achieve speedups per query which can be >10x faster for queries involving joins with or withoutGROUP BY.
Actually, a key goal is to avoid relying on big data clusters or multi-core/node use during query execution as much as possible. And as we shall see, sequential DBEst, even for large data sets, often outperforms multi-core VerdictDB.
4
PERFORMANCE EVALUATION
we have experimented with a few complex queries as found in TPC-DS for stress-testing purposes.
Experiments ran on an Ubuntu 18.04 Server with 12 Intel Xeon X5650 cores, 64GB RAM and 4TB of SSD disk space.
4.1
Experimental Setup
4.1.1 TPC-DS Workload.
We used scale factors 40-1000, resulting in the largest ta-ble having≈2.6 Billion rows and>1TB of data. The queries involved 16 column pairs from 4 tables. We performed 5 experiments: a.)Multi-column-pair analysiscontains≈100 SELECT-FROM-WHERE queries with a range predicate on one attribute and an AF on another, involving all 16 col-umn pairs. b.)Sensitivity analysisconsists of 1,000 queries, measuring performance under various AFs, varying query ranges, and sample sizes. The column pair [ss_list_ price, ss_wholesale_cost] is selected and 200 queries are ran-domly generated for each ofCOUNT, SUM, AVG, PERCENTILE, VARIANCEandSTDDEV. Sample sizes are 10k, 100k, 1 million tuples, and the query range varies from 0.1%,0.5%, 1% to 10% of the range-attribute’s domain. c.)Group-by analysis contains 30 randomly generated queries for the column pair
ss_sold_date_sk, ss_sales_pricewith theGroup By at-tributess_store_sk. d.)Join analysiscontains 42 randomly generated join queries between tablestore_salesand table
storeon join key ss_store_sk. The performance of ag-gregates onss_whole_sale_costandss_net _profitis analyzed by varyings_number_of_employees. (e)Complex
TPC-DSuses query number 7 and (complex subqueries of)
query 5 and 77 from TPC-DS involving 2-way and 5-way joins, 2-4 AFs, and 57 to 25,000 groups (in Appendix D).
4.1.2 Combined Cycle Power Plant Workload.
CCPP [56] contains 9568 rows showing hourly average am-bient variables of a power plant. It is scaled up to 2.6 billion records. There are 5 columns: Temperature (T), Ambient Pressure (AP), Relative Humidity (RH), Exhaust Vacuum (V), and Net hourly energy output (EP). 108 queries are randomly generated for three column pairs[T,EP], [AP,EP]and[RH, EP], with query ranges varying from 0.1%,1%,5% to 10%.
4.1.3 Beijing PM2.5 Workload.
This data set [33] contains PM2.5 data of Beijing Interna-tional Airport and US Embassy. There are 43824 records totally and this dataset is similarly scaled up. The target is to predict pm2.5[PM25] level, given Dew Point (DEWP), Pres-sure (PRES), Temperature (TEMP), Cumulated wind speed (IWS), etc. 72 queries are randomly generated for four col-umn pairs [DEMP, PM25], [PRES, PM25], [TEMP, PM25] and [IWS, PM25], and similar range-query selectivity was used.
4.1.4 Baseline Comparison Setup.
We compare DBEst against state of the art AQP engines:
VerdictDB [38] (source code obtained from [39], BlinkDB [4] (source code obtained from [48]). We also compare with the results from an exact-answer columnar analytics RDBMS (MonetDB [25]) using uniform samples to approximate re-sults (in Appendix C). Initially, DBEst is configured to run using a single thread and BlinkDB is deployed in pseudo-cluster mode in order to compare fairly (without hiding costs for acquiring/using large clusters). After that, DBEst is con-figured to use all cores. VerdictDB always runs over Spark using all 12-cores.
4.2
DBEst Sensitivity Analysis
We stress-test DBEst under varying (i) range-query sizes (se-lectivity), (ii) sample sizes (used to build the density estimator and regression models), and (iii) across all AFs.
4.2.1 Sample Size Effect.
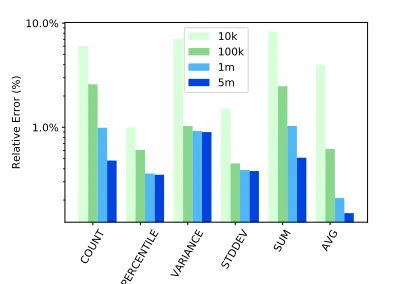
Query ranges are set at 1% of the domain size. Sample sizes vary from 10k, 100k, 1M, and 5M records. Fig. 2 shows DBEst’s relative errors. The relative error is less than 10%,
COUNT
PERCENTILE VARIANCE STDDEV
SUM AVG 1.0%
10.0%
Relative Error (%)
[image:9.612.335.538.335.477.2]10k 100k 1m 5m
Figure 2: Influence of Sample Size on Relative Error
regardless of sample size, and as the sample size increases the relative error drops significantly, bringing it to below 1% when the sample has 1 million records.
Fig. 3 shows the corresponding query response times. As expected, smaller samples yield shorter response times and that approximately, an order of magnitude smaller sample yields an order of magnitude shorter response time. The message here is that with a sample of 10k records, response times are well below 100 milliseconds! And this buys a rela-tive error of<10%. Investing into samples of 100k records, brings down relative errors to below 1% forPERCENTILE, VARIANCE, STDDEV, AVGand to a few % forCOUNT, SUM
while response times hover around 0.3 second.
COUNT
PERCENTILE VARIANCE STDDEV
SUM AVG 102
101
100
101
Query Response Time (s)
[image:10.612.338.538.83.231.2]10k 100k 1m 5m
Figure 3: Influence of Sample Size on Response Time
103 104 105 106
Sample Size 80
100 120 140
Training Time (s)
DBEst VerdictDB
(a) Training Time
103 104 105 106
Sample Size 101
100
101
102
Space Overhead (MB)
DBEst VerdictDB
[image:10.612.74.275.87.232.2](b) Space Overhead
Figure 4: DBEst vs VerdictDB Overheads
Results show that envisaged DBEst sample sizes, yield big im-provements in state building times compared to VerdictDB. Fig. 4(b) shows the space overhead of DBEst and VerdictDB. Recall, DBEst needs to maintain only the models and not the samples for query execution. The space overhead of DBEst is 1 to 2 orders of magnitude less than VerdictDB’s.
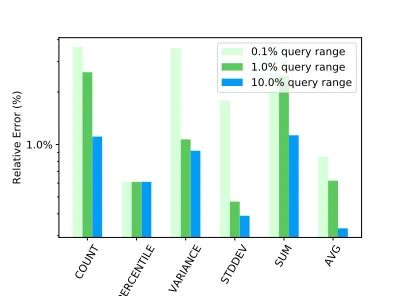
4.2.2 Query Range Effect.
[image:10.612.333.538.277.422.2]Sample sizes are fixed at 100k, and query ranges vary (0.1%, 1% to 10%). In Fig. 5, as ranges increase, we see a decrease in the error for all AFs. This is expected as smaller samples are pressed hard to find enough representatives. However, accuracy performance is nonetheless excellent.
Fig. 6 shows response times. Except forPERCENTILE, (as multiple integrals are involved in finding thepthpoint and times are 1.2secs) the query time for all other AFs is less than 1 second. As expected, query times increase as query ranges increase, as integral evaluation take more time.
4.3
CCPP Workload Performance
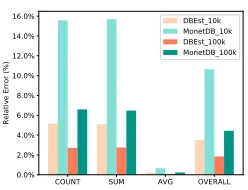
CCPP is scaled to include 2.6 billion records, (similar to the scaled-up TPC-DS) totaling around 1.4TB in size. 108 queries are randomly generated forCOUNT, SUMandAVGfor 3 col-umn pairs, stress-testing with low-selectivity query ranges
COUNT
PERCENTILE VARIANCE STDDEV
SUM AVG 1.0%
Relative Error (%)
0.1% query range 1.0% query range 10.0% query range
Figure 5: Influence of Query Range on Relative Error
COUNT
PERCENTILE VARIANCE STDDEV
SUM AVG 0.0
0.2 0.4 0.6 0.8 1.0 1.2
Query Response Time (s)
0.1% query range 1.0% query range 10.0% query range
Figure 6: Influence of Query Range on Response Time
(0.1%, 0.5% to 1%). We compare the accuracy performance between DBEst, VerdictDB, and BlinkDB over samples sizes varying of 10k to 100k.
COUNT SUM AVG OVERALL
0.0% 2.5% 5.0% 7.5% 10.0% 12.5% 15.0% 17.5%
Relative Error (%)
DBEst_10k BlinkDB_10k VerdictDB_10k
Figure 7: Relative Error: CCPP Dataset (10k Sample)
[image:10.612.56.281.289.380.2] [image:10.612.354.510.515.631.2]COUNT SUM AVG OVERALL 0.0%
1.0% 2.0% 3.0% 4.0% 5.0% 6.0% 7.0%
Relative Error (%)
[image:11.612.352.510.96.214.2]DBEst_100k BlinkDB_100k VerdictDB_100k
Figure 8: Relative Error: CCPP Dataset (100k Sample)
error is more than 10% for 10k samples (especially forCOUNT
andSUM). For 100k samples, DBEst error drops to 1.9% and the error of VerdictDB drops to 3.5%. Thus, to achieve the same accuracy, VerdictDB acquires one order of magnitude larger sample size. The accuracy of BlinkDB is worse than VerdictDB.
Fig. 9 shows the query times for DBEst and VerdictDB. For DBEst they are less than 0.3 seconds. The average query response time is around 0.02 seconds if the sample size is 10k, and increases to 0.27 seconds for 100k samples. The time cost for VerdictDB varies between 0.6 to 0.9 seconds. Hence, DBEst brings speedups from ca. 4x to ca. 30x. Please note that VerdictDB uses all 12 cores, while DBEst uses 1 thread.
COUNT SUM AVG OVERALL
102
101
100
Qeury Response Time (s)
DBEst_10k VerdictDB_10k
(a) 10k sample size
COUNT SUM AVG OVERALL
0.0 0.1 0.2 0.3 0.4 0.5 0.6
Qeury Response Time (s)
DBEst_100k VerdictDB_100k
(b) 100k sample size
Figure 9: Response Time for CCPP Dataset
We also conduct the experiments using MonetDB [25], and the comprehensive comparison results between DBEst and MonetDB are shown in Appendix C.
4.4
TPC-DS Workload Performance
Using appropriate values (from the sensitivity analysis) we evaluate accuracy, response times and time/space overheads for both DBEst and VerdictDB for TPC-DS.
4.4.1 Accuracy.
Fig. 10 shows the average relative errors. Given the same sample size, DBEst always achieves better prediction accu-racy than VerdictDB for aggregatesCOUNT, SUMandAVG. For
COUNT SUM AVG OVERALL
0.0% 2.0% 4.0% 6.0% 8.0% 10.0% 12.0% 14.0%
Relative Error (%)
DBEst_10k VerdictDB_10k DBEst_100k VerdictDB_100k
Figure 10: Relative Error: DBEst vs VerdictDB
this workload, if/when the sample size is 10k, there is a big difference in accuracy: Overall, DBEst achieves 5.26% relative error, while VerdictDB involves more than 10% relative error. For 100k samples, both DBEst and VerdictDB have excellent error, and DBEst wins only slightly.
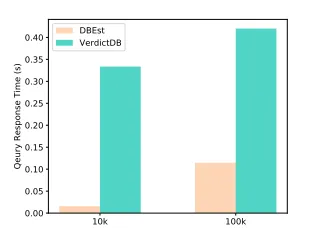
[image:11.612.92.247.97.216.2]4.4.2 Query Response Time.
Fig. 11 shows corresponding query times of DBEst and Ver-dictDB. For 10k samples, DBEst takes less than 0.02 seconds
10k 100k
0.00 0.05 0.10 0.15 0.20 0.25 0.30 0.35 0.40
Qeury Response Time (s)
[image:11.612.359.518.370.484.2]DBEst VerdictDB
Figure 11: Response Time: DBEst vs VerdictDB
to process a query, while VerdictDB takes around 0.33 sec-ond! Query response times of DBEst increase to 0.12 second for 100k samples while VerdictDB requires >0.40 seconds to process the same queries. Juxtaposing the last two fig-ures yield consistent conclusions with what we observed from the sensitivity analysis with respect to trade-offs be-tween response times and accuracy. Overall, DBEst enjoys speedups from ca. 3.5x to ca. 16x than VerdictDB and better accuracy. Please note that VerdictDB times use all 12 cores, while DBEst uses just 1 thread.
4.4.3 Overheads.
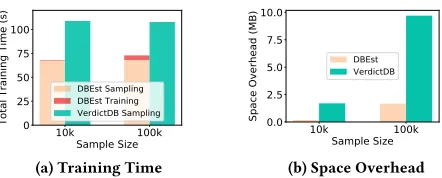
[image:11.612.56.287.428.521.2]around 68s to generate a sample and 0.65s to build the mod-els. While the average time for VerdictDB to generate the sample is around 108s. When the sample size increases to 100k, the time cost to generate samples remains the same, while it takes around 4.97s for DBEst to build the models. Overall, the total state building time of DBEst is less than that of VerdictDB.
10k 100k
Sample Size 0
25 50 75 100
Total Training Time (s)
DBEst Sampling DBEst Training VerdictDB Sampling
(a) Training Time
10k 100k
Sample Size 0.0
2.5 5.0 7.5 10.0
Space Overhead (MB)
DBEst VerdictDB
[image:12.612.60.281.195.284.2](b) Space Overhead
Figure 12: Overheads: DBEst vs VerdictDB
Fig. 12(b) shows the space overheads. For 10k samples it takes DBEst about 0.192MB to keep one regression model and one density estimator, while the memory overhead for VerdictDB is 1.7MB to keep the sample. For 100k samples, DBEst needs about 1.68MB to keep the models, while Ver-dictDB needs ca. 9.7MB for its samples. So, in terms of space DBEst offers an improvement from 5x to 9x.
4.5
Beijing Workload Performance
The Beijing data set is scaled up to 100 million records, and 72 queries are randomly generated across AFs.
Fig. 13 displays relative errors obtained by DBEst and VerdictDB. We notice a big difference in accuracy when small samples are used. For 10k samples, the average relative error by DBEst is 4.72%, while the relative error by VerdictDB is 9.57%. For 100k samples, the relative errors drop to 1.67% and 4.41%, respectively. Thus, as before, sample-based AQPs
COUNT SUM AVG OVERALL
0.0% 2.0% 4.0% 6.0% 8.0% 10.0% 12.0%
Average Relative Error (%)
[image:12.612.355.511.264.379.2]DBEst_10k VerdictDB_10k DBEst_100k VerdictDB_100k
Figure 13: Accuracy: DBEst vs VerdictDB
give higher errors if the sample size is small (especially when range predicate selectivity is small). As DBEst adopts models on top of samples, which can generalize, DBEst requires smaller samples to make more accurate estimations.
Fig. 14 shows the corresponding query response times for various sample sizes. Even if the sample size is 10k, VerdictDB still needs at least 0.38s to produce the answer, while around 0.6s are needed for 100k samples. With 10k samples, DBEst needs only 0.013s to provide an answer; with 100k samples, DBEst needs around 0.23s, This agrees with the above sensi-tivity study. Overall, DBEst brings speedups from ca. 3x to ca. 30x compared to VerdictDB. Please note that VerdictDB times use all 12 cores, while DBEst uses just 1 thread.
COUNT SUM AVG OVERALL
102
101
Average Response Time (s)
DBEst_10k VerdictDB_10k DBEst_100k VerdictDB_100k
Figure 14: Response Time: DBEst vs VerdictDB
4.6
TPC-DS Group By Performance
In total, 90 queries are used for the[ss_wholesale_cost_sk, ss_list_price]column pair from the TPC-DS workload, having 30 queries for each ofCOUNT, SUMandAVG, where theGROUP BYattribute isss_store _sk. The table used is
store_salesand is scaled up to include 100 million tuples. There are 57 distinct values for theGROUP BYattribute. The sample size for DBEst is chosen so that on average there will be 10k rows for eachGROUP BYvalue.
Fig. 15(a) shows average relative errors (averaged over all 57 groups). ForCOUNTandSUM, DBEst outperforms VerdictDB significantly. ForAVG, both have similar relative error, which is less than 3%, and DBEst performs slightly better.
Query response times are shown in Fig. 15(b). VerdictDB takes slightly less time than DBEst for aGROUP BYquery. Note, VerdictDB uses all cores, while DBEst only uses one. §4.7 will show a DBEst with parallelGROUP BYprocessing.
[image:12.612.89.246.561.679.2]COUNT SUM AVG OVERALL 0.0%
5.0% 10.0% 15.0%
Relative Error (%)
DBEst VerdictDB
(a) Relative Error
COUNT SUM AVG OVERALL 0.0
0.5 1.0 1.5
Response Time (s) DBEstVerdictDB
[image:13.612.54.290.95.188.2](b) Response Time
Figure 15: Query Performance for 57 Group Values
DBEst VerdictDB 0
25 50 75 100 125
Total Training Time (s)
DBEst Sampling DBEst Training VerdictDB Sampling
(a) Training Time
DBEst VerdictDB 0
20 40 60
Space Overhead (MB)
[image:13.612.363.513.210.314.2](b) Space Overhead
Figure 16: Overheads for 57 Group Values
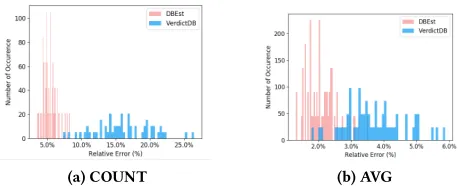
[image:13.612.59.282.242.335.2]We now study error performance for individual groups. Fig. 17 shows the histogram of the relative error for the 57 groups forSUMqueries. The average error for theSUMqueries in DBEst is 5.84% and for VerdictDB 16.32%. More than 80% of the 57 groups have a relative error <7.0% for DBEst. For VerdictDB, the minimum achieved error is around 10%. Note also that variance around the mean is smaller for DBEst and large for VerdictDB. The maximum relative errors are ca. 10% and 24%, respectively, and several groups suffer from errors >20% with VerdictDB. Fig. 22 in Appendix A shows the histograms and same conclusions forCOUNTandAVG.
Figure 17: Accuracy Histogram: SUM for 57 Groups
4.7
Parallel Query Execution
Previous experiments had DBEst run with a single thread, while VerdictDB (or Spark) made use of all 12 cores. Here, we show DBEst’s performance when running in parallel.
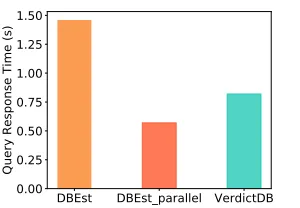
4.7.1 Parallel GROUP BY.
If there arendistinct groups DBEst buildsnmodels uses them all to answer the query. Thenmodels can be evaluated in parallel. Recall that, our current implementation for parallel model evaluation is suboptimal.
DBEst DBEst_parallel VerdictDB 0.00
0.25 0.50 0.75 1.00 1.25 1.50
Query Response Time (s)
Figure 18: Group By Query Response Time Reduction
Single-threaded DBEst needs 1.46s, while VerdictDB using all 12 cores needs 0.82s. Multi-core DBEst brings the total query response time down to 0.57s, as shown in Fig. 18.
To be fair, with the current implementation, DBEst would take more time than VerdictDB when the number of groups exceeds ca. 100. But this is largely an implementation issue, as in principle, per-group model evaluation is embarrassingly parallelizable. It is also important to note that theGroup By
queries tested did not involve any joins. As will be shown later, processing even relatively small joins is ca. 60x more expensive in VerdictDB (as it needs to compute the join of million-tuple samples), whereas DBEst does not. In such cases,Group Byin DBEst becomes better practically always than VerdictDB (since when the number of groups becomes very high, none of the systems would develop samples/mod-els and let the exact-answer QP engine handle such queries). Nonetheless, as we see below, it may be preferable to accept longer query processing times, even using per-query single-threaded execution, in order to increase system throughput.
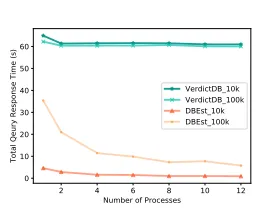
4.7.2 Throughput with Parallel Execution.
All state of the art AQP engines utilize many or all nodes/-cores in the systemfor each query execution-intra-query
parallelism- in order to reduce response times to acceptable
levels. In principle, this will reduce overall system through-put, as concurrently executing queries would conflict for threads/cores. DBEst allows for largeinter-query parallelism levels, as most queries execute using a single thread.
[image:13.612.90.260.530.664.2]2 4 6 8 10 12 Number of Processes 0
10 20 30 40 50 60
Total Qeury Response Time (s)
[image:14.612.105.245.75.179.2]VerdictDB_10k VerdictDB_100k DBEst_10k DBEst_100k
Figure 19: Throughput of Parallel Execution (CCPP)
cores are used. With 12 cores, the total time drops from 35.4s to 5.78s (from 4.6 to 0.9) for 100k (10k) samples. However, for VerdictDB, as each query uses all cores, the total query processing time remains unaffected. The same experiments are run for the TPC-DS and Beijing PM2.5 datasets, and the same conclusion hold, see Appendix B for more information. DBEst improves throughput by ca. 6x to 30x.
4.8
Join Query Processing
We now demonstrate DBEst’s performance for join queries. Two tables from TPC-DSstore_salesandstore, are joined onss_store_sk. Aggregates onss_net_profitandss_ wholesale_costare analyzed by varyingstore.s_number _of_employees. 42 queries are used for the [s_number_of_
COUNT SUM AVG OVERALL
0.0% 1.0% 2.0% 3.0% 4.0% 5.0% 6.0%
Relative Error (%)
DBEst_10k DBEst_100k DBEst_1m VerdictDB_10m
Figure 20: Join Accuracy Comparison
employees,ss_net_profit] and [s_number_of_employees,
ss_wholesale _cost] column pairs, having 14 queries for each ofCOUNT, SUMandAVG. VerdictDB joins a sample of the large fact table (default size of 10m tuples) with the actual small 60-row dimension table.
Fig. 20 shows the overall DBEst error is 4.48% (10k samples) and 2.24% (1m samples). As VerdictDB uses a very large 10m sample, the error is slightly better (1.66%). Appendix D will show cases where VerdictDB has a higher error than DBEst. Appendix C will also show how robust DBEst accuracy is for joins even when stressed with skewed join-attribute dis-tributions, unlike other approaches.
Turning to Fig. 21, for 10k samples, DBEst needs only 0.028s and 0.37MB. For 1m samples, it needs 0.82s and 1.12MB.
DBEst_10k DBEst_100k DBEst_1m VerdictDB_10m
101
100
Query Response Time (s)
(a) Response Time
DBEst_10k DBEst_100k DBEst_1m VerdictDB_10m
100
101
102
Space Overhead (MB)
[image:14.612.320.549.94.189.2](b) Space Overhead
Figure 21: Join Performance Comparison
VerdictDB, takes 6.7s, while requiring >270MB. Overall, DBEst achieves speedups from 8x to >200x and smaller space over-head from ca. 100x to 250x. The improvements would be much larger if two large tables were joined.
4.9
Major Lessons
The major lessons learned are as follows: DBEst
• brings big (orders of magnitude) gains in query processing times. Even single-threaded DBEst often outperforms a 12-core installation of a state of the art AQP engine. • allows for inter-query parallelism, which can lead to up to
30x improvement in throughput.
• is particularly frugal in system resource demands, e.g., in cores and memory, while achieving low response times. • ensures high accuracy with small per-group variance, with
small overheads (state building times, and space). • can trade-off accuracy vs efficiency: multiple models with
different-size samples can be developed and the one that caters to efficiency vs accuracy targets can be used. • operation (sampling, training, and evaluation) can be
par-allelized, making it suitable for scale-out/up installations. • can process joins with up to ca. 250x speedups, compared to the state of the art. Furthermore, its accuracy is high even when stress-tested, with skewed and non-skewed join-attribute distributions, unlike related work.
• is significantly space/time-challenged with large numbers of groups in Group By. To ameliorate this, DBEst can create model bundles, serialize and store them, say, in SSDs. Thus only the small state crucial for the query at hand is needed in memory. Our experiments show the time for IO and deserialization is very small (ca. 100ms for 500-group bundles), ensuring still large speedups. Additionally, the bundles can be processed in parallel by different cores and/or different nodes in a scale-out cluster, able to attain thus sub-second latency even for large group numbers.
5
RELATED WORK
[image:14.612.98.251.402.504.2]Spark SQL [8], Impala [32], Amazon Redshift [23], and Shark [19] have been a catalyst for analytical query processing. Efficient analytical QP engines with columnar data repre-sentations have also been developed (e.g., MonetDB [25] or, for streaming environments, Trill [18], which can also run in distributed .NET environments, (Orleans [9]). A related thread concerns applying data pre-fetching techniques [26], including semantic windows [28], or developing caches for analytical query results e.g., Data Canopy [58].
With respect to AQP research, the existing solution space is quite complex. Some approaches based on data sketches have received considerable attention [14–16]. Others focus on progressive/online aggregation [13, 18, 24, 37, 46]. Nonethe-less, AQP research has been largely dominated by sampling-based approaches [1, 2, 4, 10, 20, 22, 29, 38, 40, 41, 44]. A different perspective is to think of forgetting data (items). DBs with ‘amnesia’[31] could be viewed as equivalent to sampling approaches in that forgotten items correspond to non-sampled items. It would be interesting to see how such an approach compares with state of the art AQP engines.
State of the art sampling-based AQP approaches are broadly divided into two categories and in general no single approach is a ‘silver buller’[52]. Techniques that rely on online sam-pling, create samples on the fly and use them to approximate answers. But, even the best such efforts (e.g., [29]) only de-liver a ca. 2x speedup. The second category can bring much bigger speedups [1, 4, 10, 38, 41] exploiting the fact that often query workloads are (at least partially) predictable: one can know beforehand popular query templates, including the joined tables and join keys, attributes for range predicates and grouping, etc. STRAT [10] creates a stratified sample over the unions of columns that occur in theGROUP BYorHAVING
clauses. It considers all combinations of the column pairs. BlinkDB [4] showed that such templates can be identified from a small prefix of a workload. VerdictDB [38] depends on users providing this information. Samples are created for predictable/popular tables and column sets offline and kept in memory and queries are processed over the samples reducing drastically execution times.
Works on predictable queries with prebuilt, a priori sam-ples are closest to DBEst. BlinkDB [4] relies on uniform and stratified sampling and can trade-off performance vs accu-racy, while it supports theCOUNT, SUM, AVGAFs. DBL [41], builds a ‘learning’layer on top of AQPs (like BlinkDB) in an effort to learn how to reduce errors. VerdictDB [38] develops uniform, hashed, and stratified samples and supports cur-rentlyCOUNT, SUM, AVG. Samples are at least 10m-tuples each. It contributes fast error approximation techniques, pro-viding error guarantees with low costs. Our work was in-spired by such efforts. DBEst extends the state of the art in this domain. It uniquely combines regression and density estimator models, which can generalize and provide high
accuracy, even when built over very small samples. These models are very compact guaranteeing large speedups in query times. However, unlike sampling-based AQP research, currently DBEst does not provide a priori error guarantees. With respect to model-based approaches, [50] developed clustering techniques to derive low-error density estimators (DEs) and showed how to use them for COUNT/SUM/AVG. It does not use regression models (RMs) and pits DEs vs sampling. FunctionDB, [53] builds Piecewise Linear (PLR) functions over complete datasets and query these functions instead: Queries define data regions, R, using ranges. AFs are computed integrating PLR over sampled data points in R. No DEs are employed and sampling online is expensive, while PLR often suffers from high errors. More recent research on applying ML models include DBL [49] and [5–7]. Most of these works make assumptions of the expected workload. Recent work on learning to forecast workloads [35] may help overcome some of these assumptions. DBEst builds SML models and queries are answered without any sample, or base data accesses and DBEst models are “first class citizens”, unlike DBL, being the only way to answer queries. Unlike [5–7] it does not depend on a large number of prior queries to learn while it handles many, not just one AF.
6
CONCLUSION
With this paper we presented DBEst, an SML-model-based AQP engine. DBEst’s salient feature is that it processes queries using regression and density-estimator models. Its key in-sight is that derived models can generalize nicely, thus able to attain high accuracy despite being built from very small sam-ples. These facts allow DBEst to offer highly accurate AQP with dramatic speedups, while being very frugal in memory requirements, as models are very compact. DBEst’s philoso-phy additionally departs from related work in being frugal with respect to demands for system resources during AQP: often single-threaded DBEst outperforms multi-core AQP engines. The paper studied DBEst’s sensitivity on key pa-rameters and systematically evaluated it against two state of the art AQP engines, studying separately the effects of range predicate selectivities,GROUP BY, and join operations, as well as the impact of using multiple cores/nodes. Future work fo-cuses on sampling strategies, density estimators, and regres-sion models offering better efficiency-overheads-accuracy trade-offs, SML models for advanced selection operations on nominal categorical attributes, and better integration of DBEst with other AQP and exact-answer engines.
ACKNOWLEDGMENTS
REFERENCES
[1] Swarup Acharya, Phillip B Gibbons, Viswanath Poosala, and Sridhar Ramaswamy. 1999. The Aqua approximate query answering system. InACM Sigmod Record, Vol. 28. ACM, 574–576.
[2] Swarup Acharya, Phillip B Gibbons, Viswanath Poosala, and Sridhar Ramaswamy. 1999. Join synopses for approximate query answering. InProceedings of ACM Sigmod. ACM.
[3] D Adams. 2014. Oracle Database Online Documentation 12c Release 1 (12.1).Application Development(2014).
[4] Sameer Agarwal, Barzan Mozafari, Aurojit Panda, Henry Milner, Samuel Madden, and Ion Stoica. 2013. BlinkDB: queries with bounded errors and bounded response times on very large data. InProceedings of the 8th ACM European Conference on Computer Systems. ACM, 29–42. [5] C. Anagnostopoulos and P. Triantafillou. 2015. Learning Set
Cardinal-ity in Distance Nearest Neighbours. InProceeding of IEEE International Conference on Data Mining, (ICDM15).
[6] C. Anagnostopoulos and P. Triantafillou. 2017. Efficient Scalable Accu-rate Regression Queries in In-DBMS Analytics. InProceeding of IEEE International Conference on Data Engineering, (ICDE17).
[7] C. Anagnostopoulos and P. Triantafillou. 2017. Query-Driven Learning for Predictive Analytics of Data Subspace Cardinality.ACM Trans. on Knowledge Discovery from Data, (ACM TKDD)(2017).
[8] Michael Armbrust, Reynold S Xin, Cheng Lian, Yin Huai, Davies Liu, Joseph K Bradley, Xiangrui Meng, Tomer Kaftan, Michael J Franklin, Ali Ghodsi, et al. 2015. Spark sql: Relational data processing in spark. InProceedings of the 2015 ACM SIGMOD international conference on management of data. ACM, 1383–1394.
[9] Sergey Bykov, Alan Geller, Gabriel Kliot, James R Larus, Ravi Pandya, and Jorgen Thelin. 2011. Orleans: cloud computing for everyone. In Proceedings of the 2nd ACM Symposium on Cloud Computing. ACM, 16.
[10] Surajit Chaudhuri, Gautam Das, and Vivek Narasayya. 2007. Opti-mized stratified sampling for approximate query processing. ACM Transactions on Database Systems (TODS)32, 2 (2007), 9.
[11] Surajit Chaudhuri, Rajeev Motwani, and Vivek Narasayya. 1999. On random sampling over joins. InACM SIGMOD Record, Vol. 28. ACM, 263–274.
[12] Tianqi Chen and Carlos Guestrin. 2016. Xgboost: A scalable tree boosting system. InProceedings of the 22nd acm sigkdd international conference on knowledge discovery and data mining. ACM, 785–794. [13] Tyson Condie, Neil Conway, Peter Alvaro, Joseph M Hellerstein,
Khaled Elmeleegy, and Russell Sears. 2010. MapReduce online.. In Nsdi, Vol. 10. 20.
[14] Graham Cormode. 2011. Sketch techniques for approximate query processing. Foundations and Trends in Databases. NOW publishers (2011).
[15] Graham Cormode, Minos Garofalakis, Peter J Haas, Chris Jermaine, et al. 2011. Synopses for massive data: Samples, histograms, wavelets, sketches.Foundations and Trends® in Databases4, 1–3 (2011), 1–294. [16] Graham Cormode and Shan Muthukrishnan. 2005. An improved data
stream summary: the count-min sketch and its applications.Journal of Algorithms55, 1 (2005), 58–75.
[17] Jeffrey Dean and Sanjay Ghemawat. 2008. MapReduce: simplified data processing on large clusters.Commun. ACM51, 1 (2008), 107–113. [18] B. Chandramouli et al. 2014. Trill: A High-Performance Incremental
Query Processor for Diverse Analytics. InProceedings of the 32nd international conference on Very large data bases. VLDB Endowment. [19] C. Engle et al. 2012. Shark: Fast Data Analysis Using Coarse-grained
Distributed Memory. InProceeding of ACM SIGMOD.
[20] P. B. Gibbons et al. 1998. AQUA: System and Techniques for Approxi-mate Query Answering.Bell Laboratories(1998).
[21] Jerome H Friedman. 2002. Stochastic gradient boosting.Computational Statistics & Data Analysis38, 4 (2002), 367–378.
[22] W. Gatterbauer and D. Suciu. 2015. Approximate lifted inference with probabilistic databases. InProceedings of VLDB.
[23] Anurag Gupta, Deepak Agarwal, Derek Tan, Jakub Kulesza, Rahul Pathak, Stefano Stefani, and Vidhya Srinivasan. 2015. Amazon redshift and the case for simpler data warehouses. InProceedings of the 2015 ACM SIGMOD international conference on management of data. ACM, 1917–1923.
[24] Joseph M Hellerstein, Peter J Haas, and Helen J Wang. 1997. Online aggregation. InAcm Sigmod Record, Vol. 26. ACM, 171–182. [25] S Idreos, F Groffen, N Nes, S Manegold, S Mullender, and M Kersten.
2012. MonetDB: Two Decades of Research in Column-oriented Data-base. (2012).
[26] Stratos Idreos, Olga Papaemmanouil, and Surajit Chaudhuri. 2015. Overview of data exploration techniques. InProceedings of the 2015 ACM SIGMOD International Conference on Management of Data. ACM, 277–281.
[27] Eric Jones, Travis Oliphant, Pearu Peterson, et al. 2001–. SciPy: Open source scientific tools for Python. http://www.scipy.org/
[28] Alexander Kalinin, Ugur Cetintemel, and Stan Zdonik. 2014. Interactive data exploration using semantic windows. InProceedings of the 2014 ACM SIGMOD international conference on Management of data. ACM, 505–516.
[29] S. Kandula. 2016. Quickr: Lazily Approximating Complex AdHoc Queries in BigData Clusters. InProceedings of the 2016 ACM SIGMOD International Conference on Management of Data. ACM.
[30] Guolin Ke, Qi Meng, Thomas Finley, Taifeng Wang, Wei Chen, Weidong Ma, Qiwei Ye, and Tie-Yan Liu. 2017. Lightgbm: A highly efficient gradient boosting decision tree. InAdvances in Neural Information Processing Systems. 3146–3154.
[31] Martin Kersten and Lefteris Sidirourgos. 2017. A Database System with Amnesia. InProceeding of CIDR.
[32] Marcel Kornacker, Alexander Behm, Victor Bittorf, Taras Bobrovytsky, Casey Ching, Alan Choi, Justin Erickson, Martin Grund, Daniel Hecht, Matthew Jacobs, et al. 2015. Impala: A Modern, Open-Source SQL Engine for Hadoop.. InCidr, Vol. 1. 9.
[33] Xuan Liang, Tao Zou, Bin Guo, Shuo Li, Haozhe Zhang, Shuyi Zhang, Hui Huang, and Song Xi Chen. 2015. Assessing Beijing’s PM2. 5 pollu-tion: severity, weather impact, APEC and winter heating.Proceedings of the Royal Society A: Mathematical, Physical and Engineering Sciences 471, 2182 (2015), 20150257.
[34] Sharon Lohr. 2009.Sampling: design and analysis. Nelson Education. [35] Lin Ma, Dana Van Aken, Ahmed Hefny, Gustavo Mezerhane, Andrew
Pavlo, and Geoffrey J Gordon. 2018. Query-based Workload Forecasting for Self-Driving Database Management Systems. InProceedings of the 2018 International Conference on Management of Data. ACM, 631–645. [36] Raghunath Othayoth Nambiar and Meikel Poess. 2006. The making
of TPC-DS. InProceedings of the 32nd international conference on Very large data bases. VLDB Endowment, 1049–1058.
[37] Niketan Pansare, Vinayak R Borkar, Chris Jermaine, and Tyson Condie. 2011. Online aggregation for large mapreduce jobs.Proc. VLDB Endow 4, 11 (2011), 1135–1145.
[38] Yongjoo Park, Barzan Mozafari, Joseph Sorenson, and Junhao Wang. 2018. VerdictDB: universalizing approximate query processing. In Proceedings of the 2018 International Conference on Management of Data. ACM, 1461–1476.
[39] Yongjoo Park, Barzan Mozafari, Joseph Sorenson, and Junhao Wang. 2019. VerdictDB. https://verdictdb.org/. (Accessed on 02/16/2019). [40] Yongjoo Park, Ahmad Shahab Tajik, Michael Cafarella, and Barzan
smarter every time. InProceedings of the 2017 ACM International Con-ference on Management of Data. ACM, 587–602.
[41] Yongjoo Park, Ahmad Shahab Tajik, Michael Cafarella, and Barzan Mozafari. 2017. Database learning: Toward a database that becomes smarter every time. InProceedings of the 2017 ACM International Con-ference on Management of Data. ACM, 587–602.
[42] F. Pedregosa, G. Varoquaux, A. Gramfort, V. Michel, B. Thirion, O. Grisel, M. Blondel, P. Prettenhofer, R. Weiss, V. Dubourg, J. Vanderplas, A. Passos, D. Cournapeau, M. Brucher, M. Perrot, and E. Duchesnay. 2011. Scikit-learn: Machine Learning in Python.Journal of Machine Learning Research12 (2011), 2825–2830.
[43] Robert Piessens, Elise de Doncker-Kapenga, Christoph W Überhuber, and David K Kahaner. 2012. QUADPACK: a subroutine package for automatic integration. Vol. 1. Springer Science & Business Media. [44] N. Potti and J. M. Patel. 2015. Daq: a new paradigm for approximate
query processing. InProceedings of VLDB.
[45] Liudmila Prokhorenkova, Gleb Gusev, Aleksandr Vorobev, Anna Veronika Dorogush, and Andrey Gulin. 2017. CatBoost: unbiased boosting with categorical features. arXiv preprint arXiv:1706.09516(2017).
[46] B. C. Ooi S. Wu and K.-L. Tan. 2010. Continuous Sampling for Online Aggregation over Multiple Queries. InProceedings of Acm Sigmod. ACM.
[47] Bikas Saha, Hitesh Shah, Siddharth Seth, Gopal Vijayaraghavan, Arun Murthy, and Carlo Curino. 2015. Apache tez: A unifying framework for modeling and building data processing applications. InProceedings of the 2015 ACM SIGMOD international conference on Management of Data. ACM, 1357–1369.
[48] Ariel Kleiner Ameet Talwalkar Sameer Agarwal, Henry Milner. 2013. BlinkDB: Sub-Second Approximate Queries on Very Large Data. https: //github.com/sameeragarwal/blinkdb.
[49] Maximilian Schleich, Dan Olteanu, and Radu Ciucanu. 2016. Learning linear regression models over factorized joins. InProceedings of the 2016 International Conference on Management of Data. ACM, 3–18. [50] Jayavel Shanmugasundaram, Usama M. Fayyad, and Paul S. Bradley.
1999. Compressed Data Cubes for OLAP Aggregate Query Approxi-mation on Continuous Dimensions. InProceeding of ACM SIGKDD. [51] Bernard W Silverman. 2018.Density estimation for statistics and data
analysis. Routledge.
[52] Srikanth Kandula Surajit Chaudhuri, Bolin Ding. 2017. Approximate Query Processing: No Silver Bullet. InProceedings of the 2017 ACM SIGMOD international conference on Management of data.
[53] A. Thiagarajan and S. Madden. 2008. Querying continuous functions in a database system. InACM SIGMOD.
[54] Ashish Thusoo, Joydeep Sen Sarma, Namit Jain, Zheng Shao, Prasad Chakka, Suresh Anthony, Hao Liu, Pete Wyckoff, and Raghotham Murthy. 2009. Hive: a warehousing solution over a map-reduce frame-work.Proceedings of the VLDB Endowment2, 2 (2009), 1626–1629. [55] Srikanta Tirthapura and David P Woodruff. 2011. Optimal random
sam-pling from distributed streams revisited. InInternational Symposium on Distributed Computing. Springer, 283–297.
[56] Pınar Tüfekci. 2014. Prediction of full load electrical power output of a base load operated combined cycle power plant using machine learning methods.International Journal of Electrical Power & Energy Systems60 (2014), 126–140.
[57] Vinod Kumar Vavilapalli, Arun C Murthy, Chris Douglas, Sharad Agarwal, Mahadev Konar, Robert Evans, Thomas Graves, Jason Lowe, Hitesh Shah, Siddharth Seth, et al. 2013. Apache hadoop yarn: Yet an-other resource negotiator. InProceedings of the 4th annual Symposium on Cloud Computing. ACM, 5.
[58] Abdul Wasay, Xinding Wei, Niv Dayan, and Stratos Idreos. 2017. Data canopy: Accelerating exploratory statistical analysis. InProceedings of
the 2017 ACM International Conference on Management of Data. ACM, 557–572.
[59] Matei Zaharia, Reynold S Xin, Patrick Wendell, Tathagata Das, Michael Armbrust, Ankur Dave, Xiangrui Meng, Josh Rosen, Shiv-aram VenkatShiv-araman, Michael J Franklin, et al. 2016. Apache spark: a unified engine for big data processing.Commun. ACM59, 11 (2016), 56–65.
[60] Zhuoyue Zhao, Robert Christensen, Feifei Li, Xiao Hu, and Ke Yi. 2018. Random Sampling over Joins Revisited. InProceedings of the 2018 International Conference on Management of Data. ACM, 1525–1539.
A
DETAILED ANALYSIS: GROUP BY
§4.6 shows in detail the error distribution forGROUP BY
queries involvingSUM. Here, we demonstrate the same for AFsCOUNTandAVG, as shown in Fig. 22.
[image:17.612.320.550.279.372.2](a) COUNT (b) AVG
Figure 22: Accuracy Histogram for 57 GROUPS
ForCOUNT, the average relative errors by DBEst and Ver-dictDB are 5.34% and 16.13%, respectively. It is also noticeable that the error has a smaller variance from DBEst, while Ver-dictDB tends to produce a bad prediction with a big variance. The same conclusion holds for AFAVGas well.
0 2 4 6 8 10 12
Number of Processes 0
5 10 15 20 25 30
Total Qeury Response Time (s)
VerdictDB_10k VerdictDB_100k DBEst_10k DBEst_100k
(a) TPC-DS
0 2 4 6 8 10 12
Number of Processes 0
10 20 30
Total Qeury Response Time (s)
VerdictDB_10k VerdictDB_100k DBEst_10k DBEst_100k
(b) Beijing PM2.5
Figure 23: Throughput with Parallel Query Execution