warwick.ac.uk/lib-publications
Manuscript version: Author’s Accepted ManuscriptThe version presented in WRAP is the author’s accepted manuscript and may differ from the published version or Version of Record.
Persistent WRAP URL:
http://wrap.warwick.ac.uk/110832
How to cite:
Please refer to published version for the most recent bibliographic citation information. If a published version is known of, the repository item page linked to above, will contain details on accessing it.
Copyright and reuse:
The Warwick Research Archive Portal (WRAP) makes this work by researchers of the University of Warwick available open access under the following conditions.
Copyright © and all moral rights to the version of the paper presented here belong to the individual author(s) and/or other copyright owners. To the extent reasonable and
practicable the material made available in WRAP has been checked for eligibility before being made available.
Copies of full items can be used for personal research or study, educational, or not-for-profit purposes without prior permission or charge. Provided that the authors, title and full
bibliographic details are credited, a hyperlink and/or URL is given for the original metadata page and the content is not changed in any way.
Publisher’s statement:
Please refer to the repository item page, publisher’s statement section, for further information.
Impact of High-Intensity Polio Eradication Activities on Children’s
Routine Immunisation Status in Northern India: Generating New
Evidence From Household Surveys by Measuring Programme Exposure
on the Child Level
Abstract
The objective of this paper is to analyse and quantify the side effects of the Polio Eradication
Initiative on routine immunisation performance in India. Past studies have faced
methodological challenges in assessing these side effects. This paper offers a methodological
alternative for health policy analysts. The research uses secondary household survey data
from the Indian District-Level Household and Facility Survey (DLHS), focusing on children
aged 10-30 months in the Northern Indian states of Uttar Pradesh (n=34 327) and Bihar
(n=20 525). Covering the years 2002 to 2008, this is the latest large-scale data from India that
enables the matching technique used in this paper. District-level programme intensity data of
the Polio Eradication Initiative in India was reconstructed using publicly available resources.
The methodological innovation compared to previous studies consists of matching each child
in the DLHS data set with a child-specific value of programme exposure depending on its
district of residence, its birth date, and the date of the survey interview. Average and
age-specific associations between polio programme exposure and children’s full immunisation
status were assessed using logistic regression, controlling for other determinants of
immunisation. The regression results show that the link is negative in Uttar Pradesh and
positive in Bihar. Age-specific analysis shows that the positive association diminishes for
older children in Bihar and that a negative association emerges and become increasingly
pronounced for older children in Uttar Pradesh. This indicates that heterogeneous results
emerge across two neighbouring states with similar programme intensity and suggests that
accrue. The method described in this paper, based on an analytical focus on individual-level
programme exposure, can therefore help health policy implementers and evaluators to
1 Introduction
More than 100 global health initiatives (GHIs) provide donor-generated funding of billions of
dollars each year and are directed at health problems as diverse as blindness, malnutrition, or
malaria [1]. A widely-held stance is that such interventions can strengthen but also disrupt
country health systems. Concerns arise especially where mass campaigns are conducted at
high intensity (e.g. measles campaigns or malaria mass drug administration) or if
un-integrated initiatives duplicate functions of country health systems (e.g. in the case of some
HIV/AIDS control and social marketing activities) [2; 3].
Although the existing literature on the GPEI is extensive, gaps remain in quantitative
assessments of the interactions with country health systems [2]. In an effort to broaden the
evaluation toolkit for GHIs, this paper uses micro-level campaign exposure data to analyse
the relationship between the Indian Polio Eradication Initiative (PEI, initiated in 1994) and
routine immunisation (RI) performance in the Northern Indian states of Uttar Pradesh and
Bihar between 2002 and 2008 as a case study of the interactions between high-intensity GHI
mass campaigns and country health systems.
The few quantitative evaluations of the PEI include descriptive statistical analyses by
Aylward et al. [4], and multivariate before-and-after comparisons by Bonu et al. [5] and Bonu
et al. [6]. A major challenge of these analyses is that they conflate the introduction of polio
mass campaigns with broader health system and socio-economic developments, making it
difficult to attribute effects to polio eradication. Studies that appreciate interactions between
intervention and health system more explicitly include national-level time-series analyses by
Gauri and Khaleghian [7], who assess polio coverage rates alongside political determinants of
immunisation, and Closser et al. [8], whose use of programme intensity data links the PEI
heterogeneous effects that might alleviate or exacerbate existing patterns of social
marginalisation, and the absence of discernible effects in these studies contradicts qualitative
assessments that consistently report both positive and negative interactions between polio
eradication and national routine immunisation programmes [8-11]. In other words, we still
lack a quantitative methodology that enables us to better understand the side-effects of
mass-campaign-based public health efforts such as polio eradication on country health systems.
The methodology introduced in this paper yields two principal insights. First, exposure to an
additional polio mass immunisation campaign in Uttar Pradesh between 2002 and 2008 was
on average linked to lower odds for a child to attain full routine immunisation status, whereas
the relationship was positive in Bihar. Second, the negative association is more pronounced
for older children in Uttar Pradesh. In Bihar, the size of the positive link is smaller for older
children. These findings are consistent with the notion that PEI and country health systems
interact and suggest that this interaction can be heterogeneous even within one high-intensity
context.
2 Methods
The logistic regression model in Equation (1) was estimated to examine the relationship
between the PEI and RI in India. The model assesses the association between the
immunisation status of a child and the number of polio immunisation rounds to which it has
been exposed (pol), controlling for other determinants of full immunisation. Common
determinants of immunisation in the literature [7; 12-20] are child characteristics like age and
sex (CHI), characteristics of the mother like education (MOT), household characteristics like
wealth (HH), and health system characteristics (INF, controlled for by location and time
dummy variables). I also include an interaction term between campaign exposure and child
than young children’s scheduled routine immunisation sessions (INT). The variables and
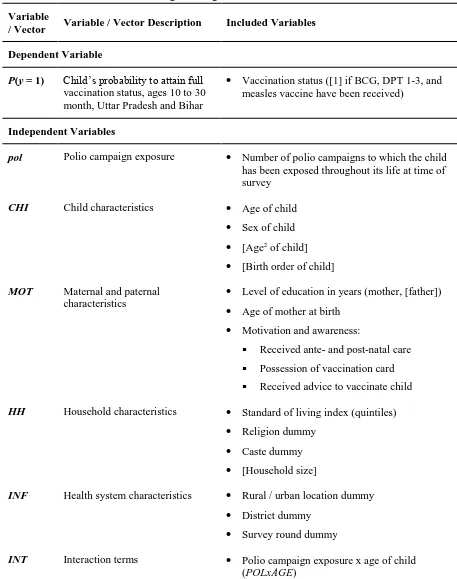
vectors in the regression model are displayed in Table 1 (variables in brackets entered the full
model but have been excluded from the restricted model that is reported in Section 3).
Goodness-of-fit of the restricted model was based on the Pseudo-R² and the Akaike
Information Criterion (AIC) [21-23]. Logistic regression was chosen because of the binary
nature of the immunisation index [24; 25]. Robustness checks are described in the Discussion
Section 4 and a selection is presented in the supplementary Appendix Tables A1 (Uttar
Pradesh) and A2 (Bihar). The model was estimated using the statistical software Stata 12
[26].
logit[P(y = 1)] = α + βppol + βcCHI + βmMOT + βhHH + βiINF + βxINT (1)
I draw on data from the District-Level Household and Facility Survey (DLHS), which
includes district identifiers for Uttar Pradesh and Bihar [27-29]. The DLHSs use systematic
stratified sampling to survey women, their husbands, village leaders, and health facilities
across India. This analysis uses repeated cross-sections of the last two survey rounds,
conducted in 2002-2004 (DLHS II) and 2007-2008 (DLHS III). The inclusion of two survey
rounds helps to increase the variance of campaign exposure as the PEI became more intense
over time. The sample of children was limited to the ages of 10 to 30 months in order to
match the available campaign data (see below).
The immunisation status as dependent variable consists of a binary index that takes the value
of 1 if full immunisation is attained. A child achieves this status if it has received all three
doses of the diphtheria, pertussis, and tetanus vaccine (DPT) and the oral polio vaccine
official Indian immunisation schedule [30; 31], I excluded OPV and hepatitis B from the
immunisation index owing to potential endogeneity and recall biases (OPV) and low
coverage (hepatitis B).1 The data used for constructing this immunisation index is based on
parent recall and vaccination card information [19].
Table 1. Variables Included in Logistic Regression Model <<INSERT TABLE 1 HERE>>
Source: Own elaboration.
The independent variable of principal interest is the child’s exposure to polio mass
immunisation campaigns (pol). This is a child-specific variable, indicating the number of
polio immunisation campaigns that took place during the child’s lifetime in the respective
district. These 6-11-day-long mass immunisation campaigns take place on pre-specified dates
and typically include one day during which children are vaccinated at “immunisation booths”
(Uttar Pradesh) and 1-2-week-long house-to-house vaccination activities (Uttar Pradesh and
Bihar) in order to vaccinate all children below the age of five years (either nationally or in
selected regions) [11]. So-called “mop-up” campaigns complement these activities, taking a
similar shape but being performed in reaction to polio outbreaks to contain further
transmission of the disease.
In order to construct this exposure variable, the DLHS data had to be complemented by the
district-level intensity of polio immunisation in Uttar Pradesh and Bihar. Because
administrative programme data was inaccessible, I reconstructed this data using publicly
available data and documents from the Indian National Polio Surveillance Project and the
GPEI. I subsequently matched the district-level campaign data with the child-level DLHS
data, creating a unique value of campaign exposure for each child based on its birth month
and the month of the survey interview (see Fig. 1; child age was capped at 30 months because
polio campaign activity only dates back as far as 1999 while the first DLHS II interview was
conducted in January 2002). This means that children of the same age in the same district can
be exposed differently to the PEI, which helps us isolate potential synergetic or disruptive
effects between the programmes on the service delivery level.2 In other words, this
methodology exploits exogenous variation in the survey data collection to establish a unique
child-level value of exposure to the polio campaigns. Whereas the data used to construct the
2The dates within each of the districts in Uttar Pradesh and Bihar were surveyed span up to 21 months per
campaign intensity is uniform on the district level, more fine-grained administrative data
from other programmes might offer opportunities to exploit further within-district variation
Fig. 1. Schematic Depiction of Constructing the Polio Campaign Exposure Variable (pol) <<INSERT FIGURE 1 HERE>>
Source: Own illustration.
The sign and significance of the polio campaign exposure variable indicate whether a higher
exposure to the polio programme is associated positively or negatively with the log odds of a
child to receive full immunisation. This relationship can be interpreted with the help of
theoretical arguments, for instance the balance between counteracting forces like health
workforce absorption and increased awareness about public health programmes [e.g. 8].
Given that Uttar Pradesh and Bihar are two contexts in which polio eradication has taken
place at very high intensities (children being exposed to up to 24 immunisation rounds by the
age of 30 months in 2008), it is reasonable to hypothesise that a discernible statistical
relationship exist, even if its direction is ambiguous from a theoretical perspective.
Because disruptive effects of the PEI may be mitigated if missed vaccinations can be easily
followed up during subsequent routine immunisation sessions, I will also examine
age-specific effects through the interaction between the age of the child and the exposure to polio
immunisation campaigns (POLxAGE). By interacting polio campaigns with child age, we can
identify different levels of the campaign impact depending on a child’s age. For instance, if
the campaign exposure variable is negative and the interaction term is positive, this would be
consistent with the argument that negative effects of the PEI diminish the older the child is.
3 Results
I first investigate the overall link between polio eradication and routine immunisation uptake.
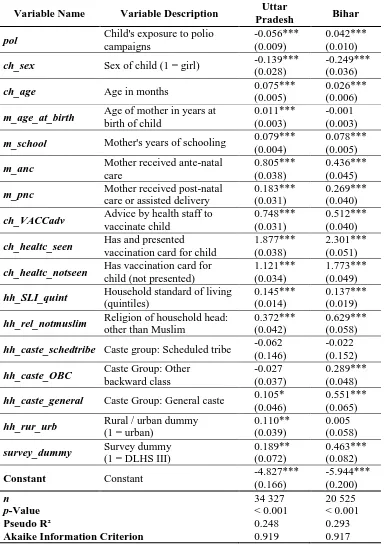
Table 2 presents the results for the restricted regression model. The control variables show
the expected signs in accordance with the immunisation literature. Not shown are the district
dummy variables to control for district-specific effects on children’s immunisation status.
The main insight from this table relates to the association between the exposure to polio
campaigns and a child’s odds to be fully immunised. The variable of interest (pol) is
coefficient of -0.056 corresponds to a decrease of 5.45% in the odds of a child to be fully
immunised when exposed to an additional polio campaign, in the presence of the given
control variables.3 In Bihar, exposure to an additional campaign corresponds to 4.3% higher
odds of full immunisation. This means that, for example, increasing the exposure from 14 to
15 polio campaigns would coincide with a lower probability of full immunisation from 12.2%
to 11.6%, given a hypothetical male child at the age of 20 months in the district of Bareilly in
Uttar Pradesh who represents median sample characteristics of the DLHS III. On average
across the sample, this translates into a 0.83 percentage point lower (Uttar Pradesh) and a
0.63 percentage point higher (Bihar) expected probability of receiving full immunisation with
every additional polio mass immunisation campaign.4
In short, children in Bihar exhibit a higher probability of vaccination uptake when exposed to
higher polio campaign intensity. Conversely, high exposure is linked to lower attainment of
full immunisation in Uttar Pradesh (I discuss in Section 4 whether we could consider these
relationships to be causal).
3The change in the odds is calculated from the coefficient as follows: 1 – e1*(-0.056) = 1 – 0.9455 = 0.0545 [21].
The odds of an event with a probability of success p are (p / [1 – p]).
4Owing to constant change in the odds of full immunisation, the response in terms of expected probability is
Table 2. Overall Regression Results in Uttar Pradesh and Bihar (Restricted Model) <<INSERT TABLE 2 HERE>>
Source: Own estimation.
Notes. Coefficients reported. Standard errors in parentheses. District dummy variables not displayed. Coefficient values of different models cannot be immediately compared due to varying samples.
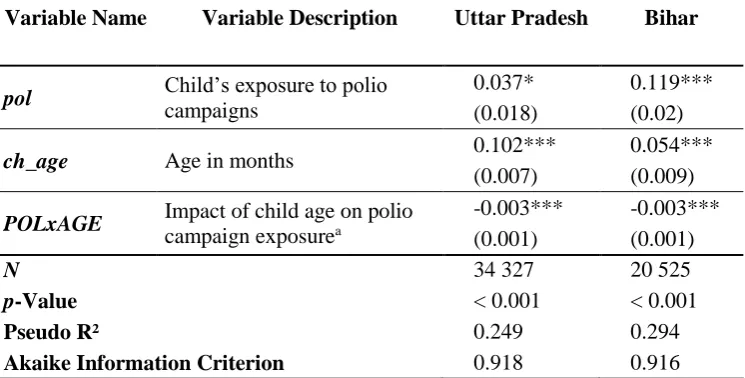
The second area of investigation concerns age-specific relationships between immunisation
status and PEI exposure. The regression results are summarised in Table 3 and show that, for
both Uttar Pradesh and Bihar, the signs of the campaign exposure variable (pol) and the
child’s age (ch_age) are positive and significant, whereas the coefficient of the interaction
term is negative and significant at the 0.1 per cent level. Because older children are more
likely to be exposed to a higher number of campaigns, Table 4 further analyses the exposure
for sub-samples stratified by age. The broad trend of these results is consistent with the
pooled samples: Whereas point estimates are predominantly negative in Uttar Pradesh, they
tend to be positive in Bihar. All statistically significant results are negative in Uttar Pradesh
and positive in Bihar.
Fig. 2 summarises Tables 3 and 4 and depicts the change in the log-odds of the polio
campaign coefficient depending on the child’s age for Uttar Pradesh and Bihar in the pooled
sample (lines) and across sub-samples stratified by age (bars). The graphical analysis
reinforces the varying conclusions for the two Indian states. Panel a displays the results for
Uttar Pradesh and suggests that the polio campaign exposure coefficient turns negative at an
age of 12 to 13 months in the pooled sample, and that statistically significant results for
individual age sub-samples are all negative and clustered at higher ages (24 to 27 months).
Starting from a higher level, the association of an additional polio campaign with the odds of
attaining full immunisation status in Bihar (Panel b) remains positive for all age groups, but it
Table 3. Comparison of Age-Specific Model Results Uttar Pradesh and Bihar <<INSERT TABLE 3 HERE>>
Source: Own estimation.
Notes. Coefficients reported. Standard errors in parentheses. Only main results displayed. Coefficient values of different models cannot be immediately compared due to varying samples.
aSuggested interpretation of interaction term.
*p < 0.05, **p < 0.01, ***p < 0.001.
Table 4. Main Age-Stratified Regression Results in Uttar Pradesh and Bihar (Restricted Model)
<<INSERT TABLE 4 HERE>> Source: Own estimation.
Notes. Coefficients reported. Standard errors in parentheses. Control variables (restricted model) not displayed. Coefficient values of different models cannot be immediately compared due to varying samples.
*p < 0.05, **p < 0.01, ***p < 0.001.
Fig. 2. Relationship Between Polio Campaign Exposure and Child Age <<INSERT FIGURE 2 HERE>>
If these statistical associations point at a causal relationship (which needs to be established in
further research using e.g. household panel data), this would suggest that young children in
Uttar Pradesh are less affected by disruptions of routine immunisation than older children,
who are less likely to catch up when exposed to an additional polio immunisation campaign.
In Bihar, it would suggest that a positive stimulus accrues largely at the scheduled routine
immunisation session rather than at follow-up sessions for unvaccinated children.
4 Discussion
The statistical associations presented in this paper are consistent with the claim that
counteracting forces have resolved, on average, into negative effects for routine
immunisation in Uttar Pradesh and positive effects for Bihar. The age-specific analysis
further suggests that the main channel through which negative effects accrue is not the
scheduled routine immunisation session itself but rather the catch-up of unvaccinated older
children. In contrast, where synergies are realised, positive outcomes appear to be
concentrated around the scheduled routine session. I discuss in this section the extent to
which a causal interpretation of these results is justified, and the implications for our
understanding of the impact of PEI using this evaluation approach.
Robustness tests have demonstrated little or no sensitivity of the statistical results towards
alternative immunisation indices, parent recall, sub-sample analyses of districts with poor
immunisation coverage, models including a squared child age and exposure variables, and
alternative functional forms (probit models and linear models with robust standard errors;
results presented in supplementary tables). Given my analysis of repeated cross-sectional data
sets (rather than e.g. panel data), it is difficult to establish firmly a causal relationship with
these results. However, I have reason to believe that causality – if present – is more likely to
non-OPV full routine immunisation status that is less influenced by OPV mass campaigns
(e.g. less likely to influence recall), children at the same age with different levels of exposure
show systematically different immunisation results, and the results are reproduced in districts
with very low immunisation coverage where we would otherwise expect the confounding
effect to disappear. Given that the same estimation methodology yielded heterogeneous
outcomes in Uttar Pradesh and Bihar, it is also unlikely that the underlying polio campaign
data biases the results systematically in either direction.
Limitations apply despite the robustness of the results. Firstly, as the statistical model is
focused on programme intensity, potential systemic effects of the PEI on routine
immunisation cannot be fully explored in this study. Nation-wide longitudinal and
higher-frequency data might help to shed light on systemic changes following the introduction of the
programme. Secondly, due to data availability, the statistical analysis covered the period from
2002 to 2008. Recent programme developments such as India’s “107 Block Plan” are
therefore not reflected in the research findings [8]. Thirdly, although this study has revealed
considerable inter-state variations in Northern India, it does not shed light on how these
patterns materialise. Identifying and modelling political determinants in a state or
cross-country study could contribute to understanding factors of success or failure of global health
interventions. For instance, Atun et al. [3] emphasise political desirability and government
commitment as factors for the integration of GHIs into national health system, which might
be modelled through the presence of democratic institutions to understand the demands of the
local population (e.g. public engagement, consultations, and other feedback mechanisms) [2].
Lastly, the analysis focused only on the link between the PEI and routine immunisation. The
PEI may also interact with other elements of the Indian health system, such as antenatal care
[8]. The data set developed for this analysis provides scope for studying such interactions in
The possibility that older children benefit less or are further excluded from the routine
immunisation activities in Bihar and Uttar Pradesh offers further space for reflection. In light
of the observed patterns, we could hypothesise that programme governance of the PEI is
geared towards readily measured elements as basis for operational and strategic
decision-making, discriminating against areas on which “evidence” sheds no light. In the current
context, where routine immunisation strengthening is promoted as a strategic objective and
programme surveillance emphasises young children in particular [e.g., 32], such a bias could
discriminate against older children who have already missed the opportunity to receive their
routine immunisation in a timely manner. This would accentuate the exclusion of groups who
already lag behind scheduled shots (and who are thus less readily “measured”). However,
neither programmatic biases nor operational differences in the polio eradication activities
explain the fundamentally different trends across the two states. Uttar Pradesh and Bihar
follow the same programme policies after all. It is, however, possible that the overarching
policies are interpreted and operationalised differently in Bihar and Uttar Pradesh. More
general factors of “political will,” differences in healthcare governance, and other
state-specific factors may be at work as well, yet this remains subject to further research.
5 Conclusion
This paper has contributed to the evaluation of the Polio Eradication Initiative's using a novel
methodology that goes beyond previous approaches of descriptive statistical analysis,
before-and-after comparisons, and the study of national-level trends. I provided quantitative
evidence that is consistent with the often-alleged interactions between the Polio Eradication
Initiative and the Indian health system through the national routine immunisation programme.
Although causality of the statistical associations needs to be established in future research,
scheduled routine shots, whereas negative effects might be particularly pronounced for
unvaccinated children in Uttar Pradesh who had missed their routine immunisation sessions
several months earlier. The different trends also point at the importance of state-level factors
in determining the response of local health systems to global health interventions.
Despite the limitations of this study, the research findings underline the need to address
potential interferences and synergies between intervention and health system. I conclude here
with three suggestions. Firstly, if it is misperceived that the Polio Eradication Initiative is
neutral to the routine immunisation status of older children simply because missed shots
could easily be followed up, this can become an obstacle to realising improvements and
actually generating synergies between the programmes. Catch-up mechanisms for routine
immunisation deserve particularly attention in this respect.
Secondly, the methodology used in this paper can be applied to assess the interactions
between other programmes with a mass campaign design and public health services such as
routine immunisation or antenatal care. Such analyses can guide corrective action for
programme managers but should be complemented with qualitative research to examine the
specific channels through which interferences and synergies arise. Such studies may go
beyond the logistic regression framework with age-stratified results used in this paper to
address the correlation between child age and campaign exposure, using for example
multilevel or survival analysis frameworks.
Thirdly, prospective health initiatives can benefit from ex-ante appraisals of interactions with
local health systems. In a recent report by the German KfW Development Bank, Haenssgen
and Nohr [33] explore the applicability of these conclusions to social marketing in HIV/AIDS
initiatives and argue that health interventions and national health systems can interact along
various interfaces such as health workforce, finance, or service delivery [33]. Programme
both the level of integration and possible interactions of the health initiatives along these
interfaces with the health system. Programmatic responses prior to implementing the
Abbreviations
AIC Akaike Information Criterion
BCG Bacillus Calmette-Guérin Vaccine
DLHS District-Level Household and Facility Survey
DPT Diphtheria, Pertussis, and Tetanus Vaccine
GHI Global Health Initiative
GPEI Global Polio Eradication Initiative
OPV Oral Polio Vaccine
PEI Polio Eradication Initiative
RI Routine Immunisation
References
1. World Health Organization Maximizing Positive Synergies Collaborative Group. 2009. An assessment of interactions between global health initiatives and country health
systems. The Lancet, 373: 2137-69.
2. Biesma RG, Brugha R, Harmer A, et al. 2009. The effects of global health initiatives on country health systems: a review of the evidence from HIV/AIDS control. Health Policy and Planning, 24: 239-52.
3. Atun R, de Jongh T, Secci F, Ohiri K, Adeyi O. 2010. A systematic review of the evidence on integration of targeted health interventions into health systems. Health Policy Plan, 25: 1-14.
4. Aylward RB, Bilous J, Tangermann RH, et al. 1997. Strengthening routine immunization services in the Western Pacific through the eradication of poliomyelitis. The Journal of Infectious Diseases, 175: S268-S71.
5. Bonu S, Rani M, Baker TD. 2003. The impact of the national polio immunization
campaign on levels and equity in immunization coverage: evidence from rural North India. Social Science & Medicine, 57: 1807-19.
6. Bonu S, Rani M, Razum O. 2004. Global public health mandates in a diverse world: the polio eradication initiative and the expanded programme on immunization in sub-Saharan Africa and South Asia. Health Policy, 70: 327-45.
7. Gauri V, Khaleghian P. 2002. Immunization in developing countries: its political and organizational determinants. World Bank.
8. Closser S, Cox K, Parris TM, et al. 2014. The impact of polio eradication on routine immunization and primary health care: a mixed-methods study. Journal of Infectious Diseases, 210: S504-S13.
9. Møgedal S, Stenson B. 2000. Disease eradication: friend or foe to the health system? World Health Organization.
10. Levin A, Ram S, Kaddar M. 2002. The impact of the Global Polio Eradication Initiative on the financing of routine immunization: case studies in Bangladesh, Côte d’Ivoire, and Morocco. Bulletin of the World Health Organization, 80: 822-8.
11. Grassly N, LaForce M, Modlin J, et al. 2009. Independent evaluation of major barriers to interrupting poliovirus transmission in India. World Health Organization.
13. Babu GR, Singh VV, Nandy S, et al. 2011. Supportive supervision and immunization coverage: evidence from India. The Internet Journal of Epidemiology, 9.
14. Datar A, Mukherji A, Sood N. 2007. Health infrastructure & immunization coverage in rural India. Indian Journal of Medical Research, 125: 31-42.
15. De P, Bhattacharya BN. 2002. Determinants of child immunization in four less-developed states of North India. Journal of Child Health Care, 6: 34-50.
16. Jeffery P, Jeffery R. 2011. Underserved and overdosed? Muslims and the Pulse Polio Initiative in rural north India. Contemporary South Asia, 19: 117-35.
17. Nath B, Singh JV, Awasthi S, et al. 2007. A study on determinants of immunization coverage among 12-23 months old children in urban slums of Lucknow district, India.
Indian Journal of Medical Sciences, 61: 598-606.
18. Nichter M. 1995. Vaccinations in the third world: a consideration of community demand.
Social Science & Medicine, 41: 617-32.
19. Pande RP. 2003. Selective gender differences in childhood nutrition and immunization in rural India: the role of siblings. Demography, 40: 395-418.
20. Phukan RK, Barman MP, Mahanta J. 2009. Factors associated with immunization coverage of children in Assam, India: over the first year of life. Journal of Tropical Pediatrics, 55: 249-52.
21. Hilbe JM. 2009. Logistic regression models. Chapman & Hall, London.
22. McFadden D. 1974. Conditional logit analysis of qualitative choice behavior. In: Zarembka P (ed.). Frontiers in econometrics. New York: Academic Press, 105-42. 23. Akaike H. 1974. A new look at the statistical model identification. IEEE Transactions on
Automatic Control, 19: 716-23.
24. Agresti A, Finlay B. 2009. Statistical methods for the social sciences. 4th ed. Pearson, Upper Saddle River, NJ.
25. Greene WH. 2008. Econometric analysis. 6th ed. Pearson/Prentice Hall, Upper Saddle River, N.J.
26. StataCorp. 2013. Stata Statistical Software: Release 13, StataCorp LP. College Station, TX.
27. Galab S, Kumar SV, Reddy PP, Singh R, Vennam U. 2011. The impact of growth on childhood poverty in Andhra Pradesh: initial findings from India. Young Lives. 28. International Institute of Population Sciences. 2007. National family health survey
(NFHS-3), 2005-06: India. International Institute of Population Sciences.
29. International Institute of Population Sciences. 2010. District level household and facility survey (DLHS-3), 2007-08: India. International Institute of Population Sciences. 30. Ministry of Health and Family Welfare. 2002. National Health Policy - 2002. Ministry of
Health and Family Welfare.
31. Ministry of Health and Family Welfare. 2008. Immunization handbook for medical officers. Ministry of Health and Family Welfare.
32. Haldar P. 2011. Routine immunization: recent initiatives and progress in high risk areas. 33. Haenssgen MJ, Nohr S. 2013. The side-effects of targeted health interventions: a
Table 1. Variables Included in Logistic Regression Model
Variable
/ Vector Variable / Vector Description Included Variables
Dependent Variable
P(y = 1) Child’s probability to attain full
vaccination status, ages 10 to 30 month, Uttar Pradesh and Bihar
• Vaccination status ([1] if BCG, DPT 1-3, and measles vaccine have been received)
Independent Variables
pol Polio campaign exposure • Number of polio campaigns to which the child has been exposed throughout its life at time of survey
CHI Child characteristics • Age of child
• Sex of child • [Age2 of child]
• [Birth order of child]
MOT Maternal and paternal characteristics
• Level of education in years (mother, [father]) • Age of mother at birth
• Motivation and awareness:
▪ Received ante- and post-natal care
▪ Possession of vaccination card
▪ Received advice to vaccinate child
HH Household characteristics • Standard of living index (quintiles)
• Religion dummy • Caste dummy • [Household size]
INF Health system characteristics • Rural / urban location dummy
• District dummy • Survey round dummy
INT Interaction terms • Polio campaign exposure x age of child (POLxAGE)
Source: Own elaboration.
Variable Name Variable Description
Pradesh Bihar
pol Child's exposure to polio
campaigns
-0.056*** 0.042*** (0.009) (0.010)
ch_sex Sex of child (1 = girl) -0.139*** -0.249***
(0.028) (0.036)
ch_age Age in months 0.075*** 0.026***
(0.005) (0.006)
m_age_at_birth Age of mother in years at
birth of child
0.011*** -0.001 (0.003) (0.003)
m_school Mother's years of schooling 0.079*** 0.078***
(0.004) (0.005)
m_anc Mother received ante-natal
care
0.805*** 0.436*** (0.038) (0.045)
m_pnc Mother received post-natal
care or assisted delivery
0.183*** 0.269*** (0.031) (0.040)
ch_VACCadv Advice by health staff to
vaccinate child
0.748*** 0.512*** (0.031) (0.040)
ch_healtc_seen Has and presented
vaccination card for child
1.877*** 2.301*** (0.038) (0.051)
ch_healtc_notseen Has vaccination card for
child (not presented)
1.121*** 1.773*** (0.034) (0.049)
hh_SLI_quint Household standard of living
(quintiles)
0.145*** 0.137*** (0.014) (0.019)
hh_rel_notmuslim Religion of household head:
other than Muslim
0.372*** 0.629*** (0.042) (0.058)
hh_caste_schedtribe Caste group: Scheduled tribe -0.062 -0.022
(0.146) (0.152)
hh_caste_OBC Caste Group: Other
backward class
-0.027 0.289*** (0.037) (0.048)
hh_caste_general Caste Group: General caste 0.105* 0.551***
(0.046) (0.065)
hh_rur_urb Rural / urban dummy
(1 = urban)
0.110** 0.005 (0.039) (0.058)
survey_dummy Survey dummy
(1 = DLHS III)
0.189** 0.463*** (0.072) (0.082)
Constant Constant -4.827*** -5.944***
(0.166) (0.200)
n 34 327 20 525
p-Value < 0.001 < 0.001
Pseudo R² 0.248 0.293
Akaike Information Criterion 0.919 0.917 Source: Own estimation.
Notes. Coefficients reported. Standard errors in parentheses. District dummy variables not displayed. Coefficient values of different models cannot be immediately compared due to varying samples.
[image:25.595.74.459.89.633.2]Table 3. Comparison of Age-Specific Model Results Uttar Pradesh and Bihar
Variable Name Variable Description Uttar Pradesh Bihar
pol Child’s exposure to polio
campaigns
0.037* 0.119***
(0.018) (0.02)
ch_age Age in months 0.102*** 0.054***
(0.007) (0.009)
POLxAGE Impact of child age on polio
campaign exposurea
-0.003*** -0.003*** (0.001) (0.001)
N 34 327 20 525
p-Value < 0.001 < 0.001
Pseudo R² 0.249 0.294
Akaike Information Criterion 0.918 0.916 Source: Own estimation.
Notes. Coefficients reported. Standard errors in parentheses. Only main results displayed. Coefficient values of different models cannot be immediately compared due to varying samples.
aSuggested interpretation of interaction term.
Child Age in Months
Uttar Pradesh Bihar
Pol Coef.
n
p-Value
Pseudo
R2 AIC
Pol Coef.
n
p-Value
Pseudo
R2 AIC
(Std. Err.) (Std. Err.)
10 -0.149 1 548 < 0.001 0.243 0.813 0.233 731 < 0.001 0.239 0.963
(0.122) (0.129)
11 -0.274* 1 324 < 0.001 0.263 0.903 0.069 568 < 0.001 0.332 0.992
(0.109) (0.119)
12 -0.037 1 412 < 0.001 0.268 0.955 0.127 1 013 < 0.001 0.273 0.968
(0.096) (0.076)
13 0.039 1 750 < 0.001 0.271 0.937 0.003 1 338 < 0.001 0.296 0.930
(0.072) (0.067)
14 -0.017 1 564 < 0.001 0.300 0.933 0.010 1 301 < 0.001 0.331 0.911
(0.067) (0.059)
15 -0.053 1 757 < 0.001 0.294 0.944 0.132* 1 176 < 0.001 0.355 0.923
(0.057) (0.062)
16 -0.089 1 818 < 0.001 0.295 0.961 0.048 1 244 < 0.001 0.343 0.929
(0.051) (0.057)
17 -0.099* 1 911 < 0.001 0.264 1.015 -0.001 1 160 < 0.001 0.304 1.005
(0.046) (0.054)
18 -0.082 1 849 < 0.001 0.265 0.982 0.142* 1 041 < 0.001 0.309 1.017
(0.048) (0.060)
19 -0.097 1 850 < 0.001 0.332 0.936 0.002 891 < 0.001 0.338 0.992
(0.053) (0.068)
20 -0.008 1 682 < 0.001 0.303 0.968 -0.115 736 < 0.001 0.319 1.042
(0.055) (0.070)
21 -0.116* 1 490 < 0.001 0.314 0.998 0.064 727 < 0.001 0.358 1.000
(0.057) (0.066)
22 -0.005 1 391 < 0.001 0.304 0.996 0.086 685 < 0.001 0.350 0.987
(0.056) (0.072)
23 -0.036 1 408 < 0.001 0.280 1.002 0.078 641 < 0.001 0.388 0.986
(0.052) (0.065)
24 -0.129* 1 459 < 0.001 0.335 0.947 0.051 973 < 0.001 0.409 0.872
(0.058) (0.049)
25 -0.119* 1 639 < 0.001 0.294 0.971 0.022 1 112 < 0.001 0.357 0.922
(0.049) (0.045)
26 -0.156** 1 567 < 0.001 0.315 0.952 0.045 1 063 < 0.001 0.375 0.899
(0.053) (0.048)
27 -0.133** 1 654 < 0.001 0.282 1.024 0.078 1 038 < 0.001 0.341 0.970
(0.051) (0.044)
28 0.002 1 648 < 0.001 0.301 0.974 0.023 1 039 < 0.001 0.362 0.953
(0.060) (0.042)
29 0.010 1 725 < 0.001 0.307 0.980 0.043 1 025 < 0.001 0.382 0.939
(0.062) (0.059)
30 -0.045 1 749 < 0.001 0.285 0.990 0.066 954 < 0.001 0.332 1.005
(0.060) (0.054)
Source: Own estimation.
Notes. Coefficients reported. Standard errors in parentheses. Control variables (restricted model) not displayed. Coefficient values of different models cannot be immediately compared due to varying samples.
[image:27.595.74.531.106.700.2]-0.3 -0.2 -0.1 0.0 0.1 0.2
10 11 12 13 14 15 16 17 18 19 20 21 22 23 24 25 26 27 28 29 30
p o l -C o e ff ic ie n t
Age of Child in Months
Stratified data (by age) Pooled data set (all ages) *
* *
* *
** **
*p< 0.05, **p< 0.01, ***p< 0.001
-0.3 -0.2 -0.1 0.0 0.1 0.2 0.3
10 11 12 13 14 15 16 17 18 19 20 21 22 23 24 25 26 27 28 29 30
p o l -C o e ff ic ie n t
Age of Child in Months
b) Bihar
Stratified data (by age) Pooled data set (all ages)
* *