Single-Cell Transcriptomics: A High-Resolution
Avenue for Plant Functional Genomics
Charlotte Rich-Griffin,
1,6Annika Stechemesser,
2,6Jessica Finch,
1Emma Lucas,
3Sascha Ott,
4,*
and Patrick Scha¨fer
1,5,*
Plant function is the result of the concerted action of single cells in different tissues. Advances in RNA-seq technologies and tissue processing allow us now to capture transcriptional changes at single-cell resolution. The incredible potential of single-cell RNA-seq lies in the novel ability to study and exploit regulatory processes in complex tissues based on the behaviour of single cells. Importantly, the independence from reporter lines allows the analysis of any given tissue in any plant. While there are challenges associated with the handling and analysis of complex datasets, the opportunities are unique to generate knowledge of tissue functions in unprecedented detail and to facilitate the application of such information by mapping cellular functions and interac-tions in a plant cell atlas.
Insights Gained from Single-Cell Profiling
The functionality of complex organs and organisms is the result of an orchestrated interplay of different cell types and their specific functions [1–3]. To completely understand and identify most critical cellular processes in complex tissues therefore requires changes to be captured at the cell-type or even single-cell level (Figure 1A). Progress in cell type-specific transcriptomics represented a vital first step in this direction and helped to reveal essential cellular activities involved in plant development and stress adaptation [2–4]. Recent advances in microfluidics-based ap-proaches tosingle-cell RNA-seq (scRNA-seq)(seeGlossary) equip us now with a unique opportunity to study transcriptional changes at cellular resolution in any given organism [5–12]. In animal-based research, scRNA-seq has revolutionised and stimulated cellular studies. In addition to facilitating the discovery of new cell types, it enables the study of stochastic principles in cellular gene network regulation and the trajectories of transcriptomic changes underlying cell fate choices and organ functionality [13–17].
As a new technique that has thus far been substantially applied only in animal/human tissues, the true potential of scRNA-seq for diverse aspects of plant science has just started to be recognised. Here, we highlight the opportunities and challenges associated with performing scRNA-seq in plants. The scope of this review is to focus on droplet-based methods, primarilyDrop-seqand 10X platforms, as these are the methods that have been applied to plant studies so far. However, analyses of data from other droplet-based methods are highly similar to what is reviewed below. Importantly, we introduce the technical principles of scRNA-seq approaches for plant-based studies, explain how scRNA-seq systems operate, and outline standard analytical workflows including underlying statistical analyses of scRNA-seq data.
Common Approaches in Analysing Cell-Specific Signalling Networks
Prior to the invention of droplet-based scRNA-seq, single-cell analyses relied on dissecting individual cellsin situusinglaser microdissection (LMD)orfluorescence-activated cell sorting (FACS). The disadvantage of LMD is that it is low throughput, capturing 4–40 cells, and is technically challenging [18–21]. FACS-based approaches, in turn, have advanced our understanding of gene networks on a cell-type or tissue level by employing fluorescent marker lines to isolate specific cell populations. Using FACS in combination with microarrays, Birnbaumet al.produced the first gene expression map of the arabidopsis root encompassing five cell types and three developmental zones [2]. Together with subsequent higher-resolution studies, it revealed a specific transcriptional identity for each cell type [3]. Similarly, further studies of cell type-specific responses to salt stress, iron depri-vation, nitrogen depletion, varied pH levels, and immunity all revealed the activation of distinct stress
1School of Life Sciences, The University of
Warwick, Coventry CV4 7AL, UK
2Warwick Mathematics Institute, The
University of Warwick, Coventry CV4 7AL, UK
3Warwick Medical School, The University
of Warwick, Coventry CV4 7AL, UK
4Department of Computer Science, The
University of Warwick, Coventry CV4 7AL, UK
5Warwick Integrative Synthetic Biology
Centre, The University of Warwick, Coventry CV4 7AL, UK
6These authors contributed equally to this
work.
*Correspondence: [email protected], [email protected]
Highlights
Plant tissues comprise a diverse set of cell types that can be distin-guished by their functions. The concerted interplay of these cell types determines the functionality and plasticity of plant tissues.
Deciphering the different functions of cell types in a tissue is essential to understand plant development and adaptation to changing environments.
gene networks in each cell type [4,22–25]. While FACS has provided essential insights into root tissue organisation, its dependence on fluorescent marker lines has limited its use to studies of known cell type lineages in model plants (mostlyArabidopsis).
[image:2.603.77.398.117.495.2]Drop-seq was the first single-cell technology to use microfluidics combined with a barcoding system to enable parallel, high-throughput sequencing of single-cell transcriptomes [26]. This ground-breaking new approach has transformed single-cell analysis in mammalian studies and is beginning to be implemented in plants [8–12].
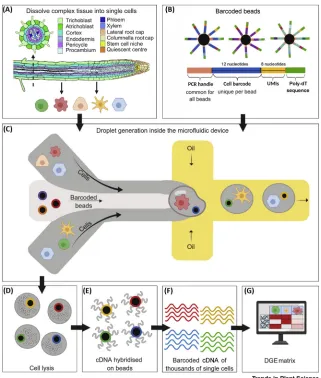
Figure 1. Generation of Singe-Cell Transcriptomic Data Using Microfluidic Technology.
(A) Complex tissue is dissociated into individual cells. Root cross-section was adapted from the Plant Illustrations repository (E. Sparks, 2017;https://doi.org/10.6084/m9.figshare.4688371.v1). (B) Microparticle beads covered with DNA probes are used to capture mRNA molecules and introduce barcodes for cells into the cDNA. Probes comprise a PCR handle, a cell barcode common to all probes on a bead, unique molecular identifiers (UMIs) enabling computational removal of PCR duplicates, and poly-dT sequences. (C) Individual cells are encapsulated in droplets together with a barcoded bead and lysis buffer. (D) Cells are lysed within droplets. (E) Reverse transcription yields cDNA molecules hybridised to probes on beads. (F) Sequencing of cDNA yields a library of transcriptomes of thousands of individual cells. (G) Software is used to count unique reads per gene and per cell yielding a digital gene expression (DGE) matrix. Created withBioRender.com.
Glossary
Barcoded beads: microparticles that carry DNA oligonucleotide probes for capturing and barcod-ing of mRNA transcripts.
Digital gene expression (DGE) matrix: matrix of unique read counts per gene per cell.
Drop-seq: a microfluidics-based method to quantify mRNA tran-script levels in thousands of single cells by encapsulating individual cells in droplets containing bar-coded beads.
Fluorescence-activated cell sort-ing (FACS): technique to isolate single cells based on their cell type-specific marker gene-associ-ated fluorescence.
Index of Cell Identity (ICI): adapted algorithm used to assign known cell-type identities to sin-gle cells without relying on unique marker genes.
Laser microdissection (LMD): laser-based isolation of single cells or cell clusters from tissue for subsequent analyses.
Principal component analysis (PCA): dimensionality reduction method based on linear algebra.
Pseudotime: algorithm used to assign a cell’s position along a trajectory of transcriptomic changes such as differentiation.
Single-cell RNA sequencing (scRNA-seq): set of methods for the sequencing of transcriptomes of single cells.
Single-cell transcriptomes attached to microparticles (STAMPs): cDNA molecules derived from a single cell hybri-dised to probes on the surface of barcoded beads.
t-Distributed Stochastic Neigh-bourhood Embedding (tSNE): machine learning algorithm to compute positions in a low-dimensional (normally 2D) space for a set of high-dimensional data points such that the proximity of close data points is preserved.
Uniform Manifold Approximation and Projection (UMAP): a method for dimensionality reduction de-signed to preserve more of the structure of distance relationships than tSNE.
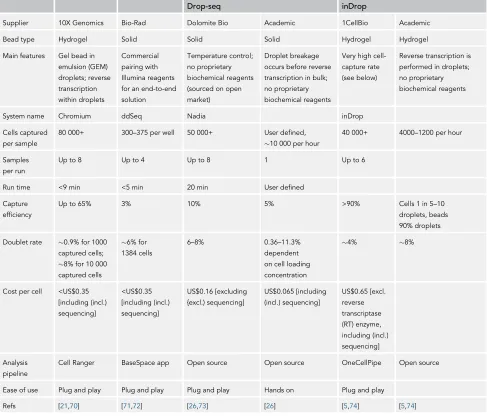
For plant studies, processing tissue with cell walls has been a challenge for the application of single-cell technologies, often resulting in low capture rates (discussed in the following section). Currently, droplet-based single-cell methods produce relatively low resolution of transcriptomes (10 000 reads per cell [21]) and thus the information gained from single-cell analytics can be limited to the most highly expressed genes. However, the latest single-cell technologies (e.g., the 10X platform), in combination with efficient tissue lysis protocols, have improved capture efficiency and gene detec-tion thus increasing the resoludetec-tion of single-cell analyses irrespective of tissue properties. There are a range of droplet-based scRNA-seq based methods, including inDrop, Drop-seq, and 10X. All of these methods utilise the same principles, whereby microfluidics is used to encapsulate single cells and barcodes into subnanolitre droplets, where cell lysis and barcoding occur. The main features of these various platforms are described inTable 1. The different technologies vary in terms of cell capture, efficiency, doublet rate, and cost and the ideal platform is experiment dependent (reviewed in [21]). Broadly speaking, inDrop and 10X have a higher capture rate, which is ideal for experiments with less available tissue. Furthermore, 10X has the highest sensitivity, making it the better choice
Drop-seq inDrop
Supplier 10X Genomics Bio-Rad Dolomite Bio Academic 1CellBio Academic
Bead type Hydrogel Solid Solid Solid Hydrogel Hydrogel
Main features Gel bead in
emulsion (GEM) droplets; reverse
transcription within droplets
Commercial
pairing with Illumina reagents
for an end-to-end solution
Temperature control;
no proprietary biochemical reagents
(sourced on open market)
Droplet breakage
occurs before reverse transcription in bulk;
no proprietary biochemical reagents
Very high
cell-capture rate (see below)
Reverse transcription is
performed in droplets; no proprietary
biochemical reagents
System name Chromium ddSeq Nadia inDrop
Cells captured per sample
80 000+ 300–375 per well 50 000+ User defined,
10 000 per hour
40 000+ 4000–1200 per hour
Samples per run
Up to 8 Up to 4 Up to 8 1 Up to 6
Run time <9 min <5 min 20 min User defined
Capture
efficiency
Up to 65% 3% 10% 5% >90% Cells 1 in 5–10
droplets, beads 90% droplets
Doublet rate 0.9% for 1000 captured cells;
8% for 10 000 captured cells
6% for 1384 cells
6–8% 0.36–11.3%
dependent
on cell loading concentration
4% 8%
Cost per cell <US$0.35 [including (incl.)
sequencing]
<US$0.35 [including (incl.)
sequencing]
US$0.16 [excluding {excl.) sequencing]
US$0.065 [including (incl.) sequencing]
US$0.65 [excl. reverse
transcriptase (RT) enzyme,
including (incl.) sequencing]
Analysis pipeline
Cell Ranger BaseSpace app Open source Open source OneCellPipe Open source
Ease of use Plug and play Plug and play Plug and play Hands on Plug and play
[image:3.603.59.546.120.536.2]Refs [21,70] [71,72] [26,73] [26] [5,74] [5,74]
for the detection of lowly expressed transcripts. Drop-seq is the most cost-efficient protocol but has a lower capture rate and sensitivity. However, all of the methods produce high-quality data for single-cell profiling [21], and key considerations for the usage of scRNA-seq are summarised inBox 1.
In addition to droplet-based approaches, there are also well-based approaches to scRNA-seq such as SMART-seq2 [27]. The SMART-seq2 protocol requires cells to be sorted (often using FACS) into individual wells on a plate, whereby each cell is processed ready for sequencing separately. The ad-vantages of SMART-seq2 are a significantly higher capture rate and the sequencing of full-length transcripts and lower technical noise at the cost of capturing fewer cells (a limit imposed by the num-ber of plates that the experimenter is able to process). SMART-seq2 also has the highest sensitivity of all scRNA-seq methods (exceeding 10X), making it the best choice for the detection of lowly ex-pressed transcripts. Furthermore, rare tissues can be investigated by combining SMART-seq2 with FACS, as reported by Efroniet al.(2016) [28] for their study of root meristem regeneration. As with droplet-based approaches, well-based scRNA-seq has not been used widely in the plant community, but it is particularly suited for experiments on small organs or rare tissues where the tissue yield is low.
Applying scRNA-seq to Plants
For plants, single-cell experiments require removal of the cell wall by enzymatic digestion (proto-plasting) before the collection of a representative (unbiased) pool of cells. Differences in cell wall composition (due to degree of lignification or suberisation) and the position of cell layers within a tissue can result in an incomplete dissociation of cell files, resulting in biased cell harvesting unless suitably accounted for in the digestion process. In addition, resuspension of protoplasts for input to the single-cell systems must consider the properties of the resuspension buffer: (i) viscosity and likelihood of crystallisation; (ii) compatibility (e.g., Ca2+-containing cell suspension buffers cause pre-cipitation of Drop-seq lysis buffer); and (iii) osmolarity to maintain the viability of the cells without
Box 1. Balancing Costs and Capacity: Considerations for scRNA-seq
How Many Cells Are Enough?
Typical numbers of single-cell transcriptomes identified for a single sample range from about 1000 to about 8000 cells. The input tissue required to achieve this will depend on the chosen platform. One should consider the expected frequency of the rarest cell type of interest to the study when choosing the number of cells, but also consider that many genes are not detected in single cells and this depth can be improved by capturing a larger number of cells for each cell type. If it is anticipated that the population of cells to be captured will be much smaller than 1000, one should consider using a well-based approach such as SMART-seq2 [27].
How Does the Number of Cells Recovered Affect Downstream Analyses?
The number of cells impacts the resolution of downstream analyses; that is, insufficient cells would mean that the impact of drop-out would be higher in all populations and a marker gene/differentially expressed (DE) genes may be hard to detect. Rare populations will also be missed. Careful choice of single-cell platform to match the experimental requirements can mitigate this problem.
How Does the Sequencing Depth Affect the Sensitivity of Downstream Analyses?
The sequencing depth required for single-cell analysis depends on the platform and experimental design. 10X recommends sequencing to a minimum 20 000 read pairs per cell. The sequencing saturation can be used to determine whether a dataset has been sequenced enough, which in turn will depend on the experiment. If the aim is to detect lowly expressed transcripts, sequencing saturation of >90% is required. If the aim is to delineate cell types, a lower sequencing saturation is acceptable.
What Is the Trade-Off between Cell Number and Sequencing Depth Per Cell?
inducing transcriptomic changes – for instance, lactose has osmotic properties similar to sucrose, while the latter is sensed by plant cells and regulates the transcription of energy-related signalling processes [29]. Once the cells of interest have been captured in suspension, these are loaded on the droplet-based scRNA-seq device for tagging usingbarcoded beads(Figure 1B).
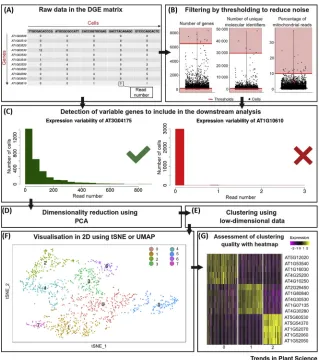
The Drop-seq protocol encapsulates individual cells in droplets and utilises a unique primer-barcode system attached to microparticle beads to identify both the cell of origin and aunique molecular identifier (UMI)for each transcript [26] (Figure 1B). The use of UMIs ensures individual tagging of each mRNA molecule and allows the identification of PCR duplicates. Bead-primer-mRNA complexes are referred to assingle-cell transcriptomes attached to microparticles (STAMPs)[26]. In the microfluidic device, aqueous flows contain cells in suspension. The barcoded beads are contained in a separate flow of a lysis buffer. The two flows come together and pass through an oil channel, which leads to the formation of a droplet (Figure 1C). Once encapsulated in a droplet, cells are immediately lysed, releasing RNA that binds to primers on the bead surface where it is reverse transcribed into cDNA to generate comprehensive libraries comprising the barcoded cDNA of thousands of single cells (Figures 1D–F). Following sequencing, these libraries are quantified as adigital gene expression (DGE) matrixof read counts per gene and per cell bar-code (Figures 1G and2A).
In general, the number of droplets is much higher than the number of cells in the sample, such that the majority of barcodes will come from droplets without a cell (referred to as ‘empty barcodes’) or one cell. However, incomplete tissue protoplasting can produce droplets with two or more cells (‘doublets’). Identifying empty barcodes and doublets are key challenges in the data analysis process. The critical first step is to define the (approximate) cut-off point between empty and nonempty barcodes. To make this estimate, there are two recommended diagnostic plots: the cumulative distribution plot and the barcode rank plot. Both plots aim to identify the cut-off point based on the distribution of read counts. First, the cumulative distribution plot of the cumulative number of reads per cell barcode in descending order should reveal a ‘knee’ in the distribution indicative of a transition from STAMPs to background noise. For barcode rank plots, cell barcodes are also ranked by descending read count and the barcode ranks are plotted against the read counts using a log scale on both axes. This renders an inverse S-curve, where the drop indicates the separation of STAMPs and background. While these plots can support the decision about which cells to include in the down-stream analysis, their quality and interpretability are dependent on the device used, the sequencing depths, and the tissue type. Therefore, an unclear barcode rank or cumulative distribution plot does not necessarily indicate a failed run. In boundary cases it is recommended to look at further charac-teristics of the data (e.g., gene counts, UMI counts) to get a deeper insight into the data quality. Representative examples for a barcode rank plot for 10X data can be found in [30] and for a cumula-tive distribution plot in [31].
The next step is to remove further sources of technical and biological variation. These include empty barcodes (not captured by initial filtering), doublets, and broken cells, henceforth referred to as low-quality cells. The distributions of the numbers of genes and UMIs and the percentage of mitochon-drial and plastid RNA across the cells can be visualised as distribution plots to determine appropriate thresholds for filtering (Figure 2B). The outliers in these plots can represent either broken cells or dou-blets. Barcodes with both low UMI and gene count (compared with the overall distribution of barcode counts in the dataset, which is dependent on platform and sequencing depth) that also have a high percentage (>10%) mitochondrial reads indicate loss of cytoplasmic RNA from perforated cells [32,33]. The cells displaying these characteristics are likely to be broken and should be removed from downstream analyses.
Current best practice is to initially apply permissive quality control thresholds (Figure 2B), which can be revisited if contamination becomes apparent in downstream analyses; for example, if one of these quality control metrics is driving differences in clustering [33].
Cell-Type Identification Using Dimensionality Reduction and Clustering
[image:6.603.78.397.113.473.2]Having extracted robust and high-quality cells, the biological features of the dataset can be analysed. Currently, all available scRNA-seq datasets produced from plants were performed on roots using the Figure 2. Analysis Workflow for Cell-Type Identification in Single-Cell Transcriptomic Data.
10X Genomics or Drop-seq platforms [8–12]. The complex structure comprising many different cell types make roots the ideal plant tissue for single-cell transcriptome studies. All of the current root scRNA-seq studies used similar analytical pipelines, such as Seurat and Monocle for data processing and stepwise analysis [36,37]. Briefly, the top most highly variable genes (HVGs) are used to perform principal component analysis (PCA) and t-distributed Stochastic Neighbourhood Embedding (tSNE) or Uniform Manifold Approximation and Projection (UMAP) to visualise the data structure (Figure 2C,D). Visualisation techniques such as tSNE and UMAP have been developed to dissect and visualise complex high-dimensional data such as scRNA-seq read counts [38,39] (Figure 2E,F).
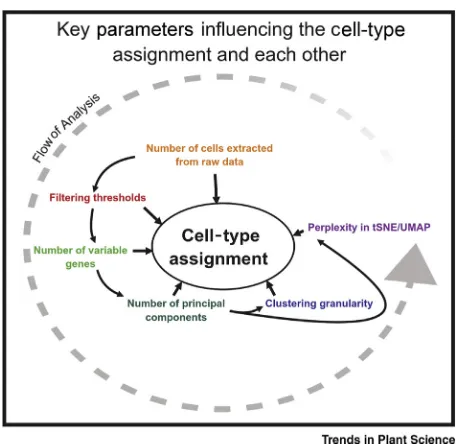
Analysis pipelines for scRNA-seq utilise only the most variable genes based on average gene expression and dispersion to prioritise cell type-specific expression patterns (Figure 2C). HVGs are characterised as being highly expressed in some cells and lowly expressed in others, making them likely drivers of variance between cell subsets. Typically, the optimum number of HVGs is be-tween 1000 and 5000, depending on the complexity of the dataset. Implementations of HGV ranking programs (as in Seurat and Scanpy) include visualisation tools to help in guiding users to-wards a correct threshold. If important genes are known, Luecken and Theis (2019) suggest that the threshold could be varied to ensure that all of these are captured within the HVGs [33]. PCA is used to further reduce the complexity of the dataset into fewer PCA dimensions prior to employing tSNE or UMAP (Figure 2F shows an example of a tSNE visualisation) for visualisation and clustering algo-rithms to identify cell subsets with similar transcriptional profiles. tSNE or UMAP take a high-dimen-sional representation of a dataset and compute a 2D representation that preserves the underlying structure, and in tSNE or UMAP plots, transcriptomically similar cells are usually close neighbours. Clustering algorithms such as k-means or graph-based approaches are applied to the data to iden-tify biologically significant groups, often corresponding to cell types. Clustering algorithms and their application to single-cell data are reviewed in [40,41]. Showing the clusters on the tSNE or UMAP visualisation by colouring cells can be an indicator of the quality of the clustering: if the clus-ters are well defined and the colour identity matches the spatial arrangement, the clustering is likely to reflect the underlying biology. As with the previous steps, tSNE and UMAP can be sensitive to their parameters (particularly the perplexity parameter for tSNE), which need to be optimised for each dataset. These dimensionally reduced and clustered data (e.g., using hierarchical clustering or graph-based clustering) [40] can provide a better understanding of the data structure on which biological expression patterns can be investigated (Figure 2G). Moreover, it can help to identify groups of similar cells that can often be identified as cell types. Along the analytic pathway, a num-ber of parameter settings need to be made. Optimal parameter settings depend on individual da-tasets and changes to one parameter can affect the optimal choice of another (Figure 3). This frequently leads to repeated analyses where the different parameter settings are adjusted until the best choices have been identified.
Applying scRNA-seq toArabidopsisroots has revealed that cell types can be readily identified from the data. Specifically, clusters corresponding to pericycle cells, phloem sieve elements, and different epidermis subpopulations were identified [8–11]. Even very small cell populations such as quiescent centre (QC) cells have been discovered. For instance, Denyeret al.(2019) used the expression pat-terns of 15 proposed QC genes to identify 36 putative QC cells, while Ryuet al.(2019) used 52 pro-posed QC markers to identify two likely QC cells [9,10,19,42].
This indicates that plant/root scRNA-seq analyses can be used as a springboard to study gene network organisation in rare cell types, helping to further develop our understanding of fundamental aspects of plant life such as the processes regulating stem cell niche function in cell fate decisions, root patterning, or root longevity [28,43–49]. However, given that these captured populations are so small, great care must be taken to ensure sufficient statistical rigour.
Pseudotime Reveals Developmental Structures
[image:8.603.123.351.112.336.2]One of the attractions of studying the gene expression patterns of roots is the regular patterning of cell types and the existence of a clear developmental axis from stem cell niche and young undifferentiated cells in the root meristem and newly differentiated cells in the elongation zone to fully differentiated cells in the root maturation zone [1]. The concept of ‘pseudotime’ can be used to investigate the development of undifferentiated meristematic cells into mature tissues. In this differentiation process, the different developmental stages correspond to distinct changes in the gene expression profile of the cells. However, cells may show transitions at different speeds. This asynchrony means that gene expression changes should not be evaluated in dependence of time but instead in dependence of progress through developmental processes. Pseudotime is an abstract measure capturing this progress. Pseudotime methods (e.g., Monocle [37], TSCAN [50]) use machine learning to order cells in ‘time’ along a trajectory, which delivers insights into developmental stages and transition.
Figure 3. Key Decision Points in Common Analysis Workflows.
Denyeret al.(2019) first used pseudotime to show large-scale differentiation from root meristematic tissue to mature tissue. Interestingly, they defined some clusters as ‘meristematic’ tissue, indicating that despite cell fate being defined after a single division, the transcriptional identity of these early cells seems to be more strongly defined by the developmental stage than by cell type. Furthermore, pseudotime can be used to decipher gene regulatory networks involved in cell differentiation, as demonstrated for atrichoblast, trichoblast (root hair cell), and cortex differentiation [9–11], and revealed the involvement of 3000 genes in trichoblast differentiation [9].
Potential of scRNA-seq in Plant Science
Fundamentally, a tissue’s function is defined by the specific functions of its constituent cell types. In animal systems, scRNA-seq not only has enabled the examination of individual cell types in the context of complex tissues but also has resulted in the identification of new cell types and cell-type states [51–53]. This has given an unprecedented view of the gene expression dynamics in com-plex tissues and how these change under differing physiological conditions (e.g., healthy vs diseased/ cancerous tissue) [54]. Alongside the improvements in single-cell technologies, novel bioinformatics methods have arisen to study more complex gene regulatory principles such as transcriptional noise and RNA velocity [55–57]. This enthusiasm for scRNA-seq studies has paved the way for the develop-ment of a human cell atlas that aims to create an ‘ID card for each cell type’ and a ‘3D map of how cell types form tissues’ [15].
As mentioned above, recent studies have demonstrated the feasibility of applying scRNA-seq to plant systems and conducting projects on a similar scale as reported for animals. Defining gene net-works from scRNA-seq data by combining cluster analyses with pseudotime methods allowed the identification of cell type-specific gene expression profiles involved in the differentiation of root cell lineages and, thus, the description of developmental trajectories in a whole tissue [8–11]. In addi-tion to resolving developmental timelines, cell types might further affect the status of each other to define the root body plan. scRNA-seq studies withArabidopsismutants lacking defined cell lineages, such as endodermis, trichoblast, or atrichoblast, showed altered single-cell transcriptomes as indicated by an overall change in the patterning of cell-type clusters [9,10]. The ability to detect such transcriptional variation further highlights scRNA-seq as a new resource to explain phenotypes in mutants, plant germplasms, or natural plant populations.
In addition to broad studies of large tissues, such as whole roots, high-throughput scRNA-seq could be utilised for the examination of specific tissue parts or developmental zones, such as the root mer-istem (with stem cell niche) at root tips. Unlike in mature roots, FACS approaches are less suited to root-tip studies due to the limited availability of appropriate fluorescent markers. It is also difficult to capture cell states within a cell-type file and to process cell types that form only a very small proportion in a tissue, such as the QC in the stem cell niche. The difficulty of identifying rare cell pop-ulations is compounded in droplet-based scRNA-seq by low gene detection and ‘drop-out’; that is, if a marker is lowly expressed, the chance of it being detected in an individual cell is low. However, cur-rent methods do allow the capture and identification of QC cells [9,10], highlighting the sensitivity of scRNA-seq in resolving distinct cell states whose differences might be mild across a cell-type file but that are essential to steer the incremental transition of stem cells (e.g., epidermis initials) to meristem and mature cells (e.g., trichoblasts).
scRNA-seq might further help in our understanding of the functional significance of ploidy. As root cells develop and mature, these undergo a process almost unique to plants: root cells change their ploidy [62,63]. This process is driven by endoreduplication (cell cycle without mitosis) and cell ploidy increases with cell development [63,64]. As sessile organisms, plants are exposed to extreme and fluc-tuating environmental conditions and ploidy is thought to support stress resilience by increasing cell and genome stability [63,65]. In line with this, cells are known to change their ability to respond to stress with cell age. Interestingly, cells lose their ability to regenerate a root stem cell niche once these start to differentiate [28]. Cell type-specific microarray and RNA-seq studies further show that cell identity plays a strong role in response to environmental stress [4,22–25]. To investigate the extent to which stress responses vary between cell types of different age, single-cell studies will be particularly useful. However, Jean-Baptisteet al.showed that when a strong treatment such as heat shock is applied, it is challenging to assign clusters to specific cell identities due to the over-whelming transcriptional impact of the stress and the downregulation of canonical marker genes. This masking of more lowly expressed cell-type markers by more strongly expressed stress gene networks must be considered during the experimental set up and may be corrected computationally [7,11].
Concluding Remarks and Future Perspectives
By enhancing spatiotemporal resolution, scRNA-seq enables us now to virtually dissect and scrutinise whole organisms. To obtain more detailed insights into the organisation of gene regulatory networks in single cells, however, requires further improvements, for instance, in single-cell tagging, labelling, and capturing of mRNA as well as in the development of bioinformatic analyses, to reduce interfering technical noise. Further technological developments are increasing the range and resolution of sin-gle-cell measurements. Application of an assay for transposase-accessible chromatin using sequencing (ATAC-seq) on the single-cell level provides access to the DNA regions harbouring the regulatory codes underlying transcriptomic patterns observed in scRNA-seq data. In addition, the combination of scRNA-seq data with imaging techniques is enabling the spatial and temporal recon-struction of cell types and cell states in a tissue. The prospect of the technology, especially in com-bination with cell epigenetics (e.g., based on scATAC-seq), multiomics approaches, high-resolution imaging, and spatiotemporally resolved cell engineering, is to describe the synergy of ‘microproc-esses’ in the development and behaviour of complex tissues under changing environments (see Outstanding Questions). Bundling of those efforts will be essential in developing unprecedented in-frastructures such as the creation of a plant cell atlas [66] to underpin new insights into how the inter-actions between cells influence function, how cells act in a complex system to create an organ, and how cells react as a network to pathogens or environmental changes [67,68]. In addition to advancing fundamental research, a comprehensive plant cell atlas will form an essential scaffold on which to base studies aimed at sustainable improvement of the productivity and value of agricultural ecosys-tems [69].
References
1.Dolan, L.et al. (1993) Cellular organisation of
theArabidopsis thalianaroot.Development119,
71–84
2.Birnbaum, K.et al. (2003) A gene expression map of theArabidopsisroot.Science302, 1956– 1960
3.Brady, S.et al. (2007) A high-resolution root spatiotemporal map reveals
dominant expression patterns.Science318, 801–806
4.Dinneny, J.et al. (2008) Cell identity mediates the response ofArabidopsisroots to abiotic stress.
Science320, 942–945
5.Klein, A.M.et al. (2015) Droplet barcoding for single-cell transcriptomics applied to embryonic stem single-cells.
Cell161, 1187–1201
6.Klein, A.M. and Macosko, E. (2017) InDrops and Drop-seq technologies for single-cell sequencing.
Lab Chip17, 2540–2541
7.Birnbaum, K.D. (2018) Power in numbers: single-cell RNA-seq strategies to dissect complex tissues.Annu.
Rev. Genet.52, 203–221
8.Shulse, C.N.et al. (2019) High-throughput single-cell transcriptome profiling of plant cell types.Cell Rep.
27, 2241–2247.e4
9.Denyer, T.et al. (2019) Spatiotemporal
developmental trajectories in theArabidopsisroot revealed using high-throughput single-cell RNA sequencing.Dev. Cell48, 840–852.e5
10.Ryu, K.H.et al. (2019) Single-cell RNA sequencing resolves molecular relationships among individual plant cells.Plant Physiol179, 1444–1456
11.Jean-Baptiste, K.et al. (2019) Dynamics of gene expression in single root cells ofA. thaliana.Plant Cell31, 993–1011
12.Zhang, T.-Q.et al. (2019) A single-cell RNA sequencing profiles the developmental landscape of
Arabidopsisroot.Mol. Plant12, 648–660
Outstanding Questions
How close are we to virtually reas-sembling complex plant tissues based on single-cell
transcriptomes?
Which scRNA-seq parameters represent limiting factors in ob-taining deep transcriptome data? Can we apply scRNA-seq technol-ogy to any plant tissue and any crop?
How do stem cell niche and indi-vidual cell types define the plant/ root body plan?
Which gene networks define and maintain the quiescent centre and stem cells and their interaction? How do stem cell initials define the identity of cell types?
What determines the status of in-dividual cell types and how much is it influenced by neighbouring cells? Which signals and gene networks regulate the developmental transi-tion of cell types?
What defines individual cell types and to what extent does their status change during development or environmental stress? How do cell types and cell-type states contribute to plant develop-ment and environdevelop-mental stress adaptation?
13.Gawad, C.et al. (2016) Single-cell genome sequencing: current state of the science.Nat. Rev.
Genet.17, 175–188
14.Prakadan, S.M.et al. (2017) Scaling by shrinking: empowering single-cell ‘‘omics’’ with microfluidic devices.Nat. Rev. Genet.18, 345–361
15.Regev, A.et al. (2017) Science forum: the human cell atlas.eLife6, e27041
16.Han, X.et al. (2018) Mapping the mouse cell atlas by microwell-seq.Cell172, 1091–1107.e17
17.Schaum, N.et al. (2018) Single-cell transcriptomics of 20 mouse organs creates aTabula Muris.Nature562, 367–372
18.Anjam, M.S.et al. (2016) An improved procedure for isolation of high-quality RNA from nematode-infectedArabidopsisroots through laser capture microdissection.Plant
Methods12, 25
19.Efroni, I.et al. (2015) Quantification of cell identity from single-cell gene expression profiles.Genome Biol.16, 9
20.Thakare, D.et al. (2014) RNA-seq analysis of laser-capture microdissected cells of the developing central starchy endosperm of maize.Genomics Data
2, 242–245
21.Zhang, X.et al. (2018) Comparative analysis of droplet-based ultra-high-throughput single-cell RNA-seq systems.Mol. Cell73, 130–142.e5
22.Geng, Y.et al. (2013) A spatio-temporal
understanding of growth regulation during the salt stress response inArabidopsis.Plant Cell25, 2132– 2154
23.Gifford, M.et al. (2008) Cell-specific nitrogen responses mediate developmental plasticity.Proc. Natl. Acad. Sci. U. S. A.105, 803–808
24.Iyer-Pascuzzi, A.S.et al. (2011) Cell identity regulators link development and stress responses in the
Arabidopsisroot.Dev. Cell21, 770–782
25. Rich, C.et al. (2018) Cell type identity determines transcriptomic immune responses inArabidopsis thalianaroots.bioRxiv. Published online April 23, 2018.https://doi.org/10.1101/302448
26.Macosko, E.et al. (2015) Highly parallel genome-wide expression profiling of individual cells using nanoliter droplets.Cell161, 1202–1214
27.Picelli, S.et al. (2014) Full-length RNA-seq from single cells using Smart-seq2.Nat. Protoc.9, 171–181
28.Efroni, I.et al. (2016) Root regeneration triggers an embryo-like sequence guided by hormonal interactions.Cell165, 1721–1733
29.Baena-Gonza´lez, E.et al. (2007) A central integrator of transcription networks in plant stress and energy signalling.Nature448, 938–942
30. 10X Genomics (2019) Technical Note. Resolving Cell Types as a Function of Read Depth and Cell Number. CG000148 Rev A, 10X Genomics.
31. Namesh, J. and McCarroll, S. (2019)Java tools for analyzing Drop-seq data.https://github.com/ broadinstitute/Drop-seq
32. Lun, A.T.L.et al. (2019)simpleSingleCell: a step-by-step workflow for low-level analysis of single-cell RNA-seq data with Bioconductor.https://master. bioconductor.org/packages/release/workflows/ html/simpleSingleCell.html#examining-gene-level-metrics
33.Luecken, M.D. and Theis, F.J. (2019) Current best practices in single-cell RNA-seq analysis: a tutorial.
Mol. Syst. Biol.15, e8746
34.Wolock, S.L.et al. (2019) Scrublet: computational identification of cell doublets in single-cell transcriptomic data.Cell Syst8, 281–291.e9
35.McGinnis, C.S.et al. (2019) DoubletFinder: doublet detection in single-cell RNA sequencing data using artificial nearest neighbors.Cell Syst8, 329–337.e4
36.Butler, A.et al. (2018) Integrating single-cell transcriptomic data across different conditions, technologies, and species.Nat. Biotechnol.36, 411–420
37.Trapnell, C.et al. (2014) The dynamics and regulators of cell fate decisions are revealed by
pseudotemporal ordering of single cells.Nat. Biotechnol.32, 381
38.van der Maaten, L. and Hinton, G. (2008) Visualizing data using t-SNE.J. Mach. Learn. Res.9, 2579–2605
39. McInnes, L.et al. (2018) UMAP: Uniform Manifold Approximation and Projection for dimension reduction.arXiv. Published online December 6, 2018.
http://arxiv.org/abs/1802.03426
40.Jain, A.K.et al. (1999) Data clustering: a review.ACM
Comput. Surv.31, 264–323
41.Rodriguez, M.Z.et al. (2019) Clustering algorithms: a comparative approach.PLoS One14, e0210236
42.Nawy, T.et al. (2005) Transcriptional profile of the
Arabidopsisroot quiescent center.Plant Cell17, 1908–1925
43.Cruz-Ramı´rez, A.et al. (2013) A SCARECROW– RETINOBLASTOMA protein network controls protective quiescence in theArabidopsisroot stem cell organizer.PLoS Biol11, e1001997
44.Li, S.et al. (2016) High-resolution expression map of theArabidopsisroot reveals alternative splicing and lincRNA regulation.Dev. Cell39, 508–522
45.Di Mambro, R.et al. (2017) Auxin minimum triggers the developmental switch from cell division to cell differentiation in theArabidopsisroot.Proc. Natl.
Acad. Sci. U. S. A.114, E7641–E7649
46.Wendrich, J.R.et al. (2017) Framework for gradual progression of cell ontogeny in theArabidopsisroot meristem.Proc. Natl. Acad. Sci. U. S. A.114, E8922– E8929
47.Andersen, T.G.et al. (2018) Diffusible repression of cytokinin signalling produces endodermal symmetry and passage cells.Nature555, 529–533
48.Marhava, P.et al. (2019) Re-activation of stem cell pathways for pattern restoration in plant wound healing.Cell177, 957–969.e13
49.Zhou, W.et al. (2019) A jasmonate signaling network activates root stem cells and promotes regeneration.
Cell177, 942–956.e14
50.Ji, Z. and Ji, H. (2016) TSCAN: pseudo-time reconstruction and evaluation in single-cell RNA-seq analysis.Nucleic Acids Res.44, e117
51.Zeisel, A.et al. (2015) Cell types in the mouse cortex and hippocampus revealed by single-cell RNA-seq.
Science347, 1138–1142
52.Cao, J.et al. (2019) The single-cell transcriptional landscape of mammalian organogenesis.Nature
566, 496–502
53.Tikhonova, A.N.et al. (2019) The bone marrow microenvironment at single-cell resolution.Nature
569, 222–228
54.Chung, W.et al. (2017) Single-cell RNA-seq enables comprehensive tumour and immune cell profiling in primary breast cancer.Nat. Commun.8, 15081
55.Hebenstreit, D. (2013) Are gene loops the cause of transcriptional noise?Trends Genet29, 333–338
56.Cortijo, S.et al. (2019) Widespread inter-individual gene expression variability inArabidopsis thaliana.
Mol. Syst. Biol.15, e8591
57.La Manno, G.et al. (2018) RNA velocity of single cells.
Nature560, 494–498
58.Chen, G.et al. (2019) Single-cell RNA-seq technologies and related computational data analysis.Front. Genet.10, 317
60.Bu¨ttner, M.et al. (2019) A test metric for assessing single-cell RNA-seq batch correction.Nat. Methods
16, 43–49
61.Stuart, T.et al. (2019) Comprehensive integration of single cell data.Cell177, 1888–1902.e21
62.Edgar, B.A.et al. (2014) Endocycles: a recurrent evolutionary innovation for post-mitotic cell growth.
Nat. Rev. Mol. Cell Biol.15, 197–210
63.Bhosale, R.et al. (2018) A spatiotemporal DNA endoploidy map of theArabidopsisroot reveals roles for the endocycle in root development and stress adaptation.Plant Cell30, 2330–2351
64.Kumar, N.et al. (2015) Functional conservation in the SIAMESE-RELATED family of cyclin-dependent kinase inhibitors in land plants.Plant Cell27, 3065– 3080
65.Rymen, B. and Sugimoto, K. (2012) Tuning growth to the environmental demands.Curr. Opin. Plant Biol.
15, 683–690
66.Rhee, S.Y.et al. (2019) Towards building a plant cell atlas.Trends Plant Sci.24, 303–310
67.Petryszak, R.et al. (2015) Expression Atlas update – an integrated database of gene and protein expression in humans, animals and plants.Nucleic
Acids Res.44, D746–D752
68.Waese, J.et al. (2017) ePlant: visualizing and exploring multiple levels of data for hypothesis generation in plant biology.Plant Cell29, 1806– 1821
69.Weckwerth, W. (2011) Green systems biology – from single genomes, proteomes and metabolomes to ecosystems research and biotechnology.
J. Proteomics75, 284–305
70.Zheng, G.X.et al. (2017) Massively parallel digital transcriptional profiling of single cells.Nat. Commun.
8, 14049
71.Romagnoli, D.et al. (2018) ddSeeker: a tool for processing Bio-Rad ddSEQ single cell RNA-seq data.
BMC Genomics19, 960
72. Illumina, Inc. and Bio-Rad Laboratories, IncThe Illumina Bio-Rad Single-Cell Sequencing Solution. Bulletin #6855. Published online September 29, 2016.
http://www.bio-rad.com/webroot/web/pdf/lsr/ literature/Bulletin_6855.pdf
73. Dolomite Bio (2019) Nadia. https://www.dolomite- bio.com/wp-content/uploads/Nadia-2019-Brochure-For-Web-1.1.pdf
74.Zilionis, R.et al. (2017) Single-cell barcoding and sequencing using droplet microfluidics.Nat. Protoc.