A Study on Forecasting System of Patent Registration
Based on Bayesian Network
Gabjo Kim1, Sangsung Park1, Sunghae Jun2, Yosup Kim1, Dongjin Kang1, Dongsik Jang1* 1Division of Industrial Management Engineering, Korea University, Seoul, South Korea
2Department of Statistics, Cheongju University, Cheongju, South Korea
Email: [email protected], [email protected], [email protected], [email protected], [email protected], *[email protected]
Received August 30, 2012; revised October 5, 2012; accepted October 13,2012
ABSTRACT
Recently the importance of intellectual property has been increased. There has been various ways of research on analy- sis of companies, forecast of technology and so on through patents and many investments of money and time. Unlike traditional method of patent analysis such as company analysis, forecasting technologies, this research is to suggest the ways to forecast registration and rejection of patents which help minimize the efforts to register patents. To do so, in- formation such as inventors, applicants, application date, and IPC codes were extracted to be used as input variables for analyzing Bayesian network. Especially, among various forms of Bayesian network, we used Tree Augmented NBN (TAN) to forecast registration and rejection of patent. This is because, TAN was assumed to have dependence between variables. As a result of this Bayesian network, it was shown that there are nearly more than 80% of accuracy to fore- cast registration and rejection of patents. Therefore, we expect the minimization of time and cost of registration by fo-recasting registration and rejection of R&D patent through this research.
Keywords: Bayesian Network; Patent Registration; Tree Augmented NBN; Forecast
1. Introduction
In general, display technology is technology that shows various information on screen. From screen of mobile phone that we encounter everyday life, the field of ap- plication of display technology is applied to TV and PC monitors as well as the automotive industry, military, and medical care and spacecraft for battle. The market of Liquid Crystal Display (LCD) tends to grow with the development of relevant technology according to in- creasing demand of the LCD. In the 1990s, the market was dominated by the PDP and LCD screen for large equipment. In 2000s, however, as the market expanded to small devices, the market of LCD screen had declined and the LED industry tended to be in the limelight. Like the case above, advanced technique often replace the existing technology in the marketplace. Therefore, it is required to continuously research related technology [1]. There have been many researches on new technologies to dominate the market by introducing new products. Such keen competitions within the country and internationally has led to active development in display industry. The most typical and rapidly emerging next-generation dis- play technology is Organic Light Emitting Diode (OLED).
OLED has faster response speed than that of LCD. Also, it has excellent viewing angle and contrast ratio as it is a self-luminous type. OLED materials market is expected to enter a phase of full-scale growth in the second half of 2012. Diffusion of smart phones equipped with OLED is expected to drive demand for OLED. Not only by strong sales of Samsung smart phones, but also because OLED are diffused to other brands, the penetration rate of OLED into smart phone is expected to rise to 30% in 2014 from 20% in present [2].
With this trend, each country or company has put a lot of efforts to obtain intellectual property rights before its rivals to dominate the market. As a part of preoccupancy of intellectual property rights in the field of R&D, a number of research institutions are registered their results as patent. With an increase in the importance of the pat- ent, the number of patents filed in the country is increas- ing year by year [3]. However, according to the Patent Office, despite the large number of patent applications, patent registration rate is 50% or less [4]. It generates a problem that a lot of human resources, capital, time and efforts put into register a patent could be wasted. Thus, most researchers usually survey patent information on patent DB in advance before they apply for a patent. At this time, the investigation of patent information is
mainly done by patent agencies or corporate patent de- partments. Research should be based on expert and sub- jective judgment. This method has a fatal defect if it lacks of objectivity in evaluating the quality of the patent. In this paper, we present a patent registration prediction method that used by patent information to avoid subjec- tive judgments.
2. Advanced Research
2.1. Related Literature
Until recently, studies on the patent have been used pri- marily by mining the text of the specification and biblio- graphic to analyze vacant technology. The data that was used on this paper is application number, filing date, publication number, publication date, IPC code and ex- tracted keywords using the text mining. Tseng et al. conducted a study to create a patent map using text min- ing techniques to analyze the relationship between each technology [5]. Subject to US 14 patents in the field of biotechnology, using a simple regression analysis, Lin, Chen and Wu revealed that the nationality of the patent applicant, geographic location and the number of claims are a statistically significant correlation with the number of citations while there is a positive or negative correla- tion between examination period and the number of cita- tions partially [6]. Jun, Park and Jang used the patent data with method of support vector machine and patent matrix to predict the vacant technology in the field of Management of Technology [7].
Previous studies have mainly done about bibliographic item and analyzing of correlation and progress of tech- nology by using text mining. Recently, researchers sug- gested forecasting of registration and rejection of patent using text mining. Jung, Park and Jang investigated the existence patent registration in the field of Bluetooth, solar and hard disk by using the registration refusal simi- larity [8]. Our research is different from the previous studies. We gathered OLED patent data from KIPRIS and used as the raw data that contains novelty, rights, scope of technology, collaboration of research develop- ment, subdivision of technology, technology innovation activity and technology importance.
2.2. Intellectual Property
Intellectual property right can be divided into three rights. Industrial property right includes patent, utility model, model design and trademark. Copyrights include creation of culture and art such as music, art image and literature. There is advanced intellectual property right that is be- gun to be recognized as intellectual property right lately according to the changes and rapid developments in the social environment. It has economic value as well. It is
not an exaggeration to say that patent right occupies one of the most important part of intellectual property rights. Not all the inventions are registered of patents. To be registered of a patent, it must meet several criteria. The criteria of patent are divided to subjective requirements, objective requirements and procedural requirements [9]. Subjective requirements are required to applicants. It means that inventor must not imitate other inventions and the inventor must have a right to apply for registering of a patent by the law. To satisfy the objective requirements, invention should be highly creative technical idea with the law of nature. Also, it must have industrial applicabil- ity, novelty and progressivity. In order to register of a patent, applicants must apply for patent in accordance with procedure that is required by the patent law as well as the substantive requirements. In Republic of Korea, it takes 10 to 16 months for registering of a patent by these patent examination procedures. Furthermore, applicant needs more finances that are required to pay patent office, agent commission, registration fee and examination fee. Therefore, companies and the government in the keen global competition need patent forecasting systems for minimization of time and cost of patent registration.
2.3. Bayesian Network
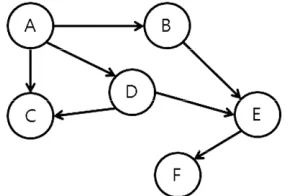
[image:2.595.352.496.619.717.2]Data mining is a process of discovering meaningful in- formation in large data repositories [10]. A Bayesian network is one of the Data mining methods and a graphi- cal model that encodes probabilistic relationships among variables of interests [11]. Therefore, Bayesian network is defined as Conditional Probability Table (CPT) and Directed Acyclic Graph (DAG) that can be used to rep- resent causal relationships among a set of random vari- ables. In this regard each node represents variable and DAG connected to nodes means relationship between variables.
Figure 1 shows the network between random variables. In this diagram, the node labeled A has three children, labeled B, C and D, and the node labeled B, C and D has one parent, labeled A. Generally, Bayesian network is a model that represents the probability distribution of a set of random variables in combination with dependent va-riables as Bayes’ theorem can be used to calculate the
posterior probability [12]. Consequently, Bayesian net- work can be formulated as in Equation (1) by conditional probability and Bayes’ theorem.
P X Y P Y
P X
P Y
P X Y (1)
Bayes’ rule computes a conditional probability, based on the probability that the hypothesis holds given the observed data sample Y to judge the relative truth of the hypothesis X and the prior probability of the hy- pothesis X.
There are several types of Bayesian network such as Naïve BN (NBN), General BN (GBN), Tree Augmented NBN (TAN) etc. Among them, NBN is the most concise and assumes that every attribute is independent from the rest of the attributes, given the state of the class variable. However, NBNs’ dependencies among these cannot be modeled in realty. Freidman et al. proposed the Tree Augmented NBN (TAN) in order to overcome the strong independence assumptions imposed by the NBN. The TAN is an extension of NB which allows additional edges between the attributes of the network in order to capture correlations among them [13].
3. Data and Variables Definition
This thesis is an analysis of Korea patent data of both registered and rejected patents on OLED technology be- tween 2000 and 2011. There had been 348 cases of reg- istered patents and 90 of rejected patents on OLED tech- nology. Total of 438 documents had been experimented. For classification analysis, 1 was given to Registered pa- tents and 0 was given to the rejected ones. In that, it was expected to select input variables for analyzing technol-ogy information and patent rights given by the gathered data as shown in Table 1.
Novelty
Patent is a monopoly obtained by introducing new in- vention. The invention should be something innovative. This characteristic helps to prevent duplicated research or investment for companies, individuals or the government. Application date in patent technology document shows the period of invention and enables to find out patents’ new. On this thesis, application date was converted to number 0 - 1 as application date index by the Method (2) below [8].
Application date Min Applica ADI
Max Application date Min Appl tion date ication date (2) Rights Scope of Technology
Claims on patent document are content of invention that was written thoroughly in order to protect patent rights. The number of request index enables the number
of inventions of companies or the government in fixed quantity. Also, it can be used to measure the patent’s range of invention and extent of rights. This can be con- sidered to an index which measure the result of innova- tion of companies or the government and this possibility is based on logical reasoning that claims provide the right information on activities of innovative technology rather than the number of patents as substantial patented inven- tions has been written on the claims [14].
Collaboration of Research Development
The patent is not only submitted from the applicator but also it is submitted by a group of people. This sug- gests that by the number of collaborated application, it can be an index showing collaboration with other com- panies or independent development. By patent informa- tion, using number of patent with co-applications, with co-inventors is the most basic way to understand the re- lationship of collaboration to research development [14]. On this thesis, the number of applicators or inventors was regarded as information for collaboration of research development and analyzed.
Subdivision of Technology
IPC (International Patent Classification) is used world- wide and is a treaty to search and classify patent docu-ments and further to exchange technology between coun-tries. IPC divides total technology into eight sections which are from section A to H and each section is di-vided into Class, Subclass, Group, and Subgroup.
Table 2 shows that detailed OLED technology was di-vided or replaced as five sections of B, C, F, G, H and used for analysis.
Technology Innovation Activity
Activity Index (AI) is the major index to analyze the present condition of specialization of technology, this provides the information about which technology is con- centrated to the technology innovation activity by com- paring other company with certain company that is inter- ested [14]. This shows the area of technology that is cen- tered by certain companies or the government, it is not analyzing by the size of the number of patents. The Me- thod (3) shows the Activity Index.
The number of applicants' specific techical area Total number of specific technical areas AI Total number of applicants
Total number of patents
(3)
Activity Index is ranged from 0 to infinity and it gains meanings by the number. With 1 as a standard number, Activity Index is relatively less concentrated to the area of technology when the certain company is smaller than 1 and vice versa [9].
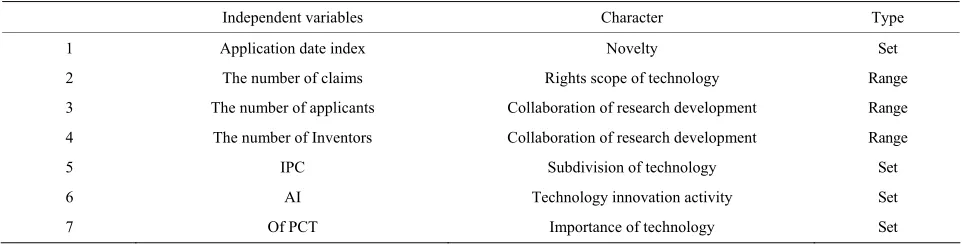
Table 1. Independent variables.
Independent variables Character Type
1 Application date index Novelty Set
2 The number of claims Rights scope of technology Range
3 The number of applicants Collaboration of research development Range
4 The number of Inventors Collaboration of research development Range
5 IPC Subdivision of technology Set
6 AI Technology innovation activity Set
[image:4.595.57.526.253.327.2]7 Of PCT Importance of technology Set
Table 2. OLED technology section and IPC code.
IPC Section Technology Description
B60R B Optical clock device Installation in a car
C03C C Glass composition Glass composition without silica
… … … …
H05B H Electric luminous material Device for production of electric luminous material
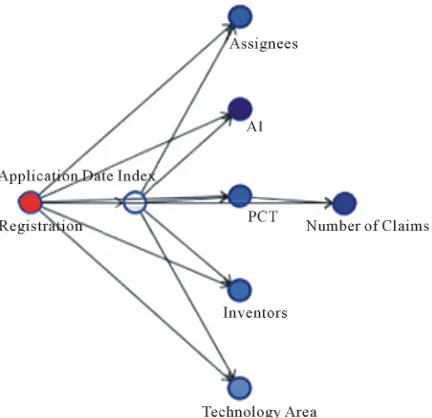
of 1.5 in order to divide them into three groups. which was trained. It shows that the total of 9 nodes and 13 arcs were produced. Also, it leads to the fact that there is a tree relationship among input variables, which are child nodes, while every input variable is depending on whether class node is registered or not. Furthermore, it is shown that every variable can impact on status of Regis- tration and there are causal relationships among input variables by application date index—AI, application date index—PCT, application date index-the number of as- signees, application date index-the number of inventors, PCT—the number of claims. Tables 3-8 show each vari- able and conditional probability number of status of reg- istration.
Importance of Technology
In patent document, international application and re- lated information enable to quantitatively evaluate the technology [15]. Generally budgets such as public com- mission, translation fee, legal fee are required to apply the patent and keep the registration abroad and this leads to less number of international application. Because the time, costs and efforts spent indirectly show level of pa-tent technology, international application can be con- nected to the technological importance and opportunity in market places. This thesis checked status of interna- tional application and gave number 1 when there had been international application and number 0 when there
had been no international application. between each variable and the status of registration. Tables 3-8 show the number of conditional probability Ta- ble 3 explains the conditional probability application date index-in the case of rejection, the probability is 0.068 when the index of applicant index is less than 0.2 and that of 9.017 when application date index is less than 0.2. In Table 4, variables of the number of claims have sub- ordination only to status of registration and that of PCT. Therefore, each column of the table of conditional prob- ability has the numbers which variable of the number of claims can have. It draws the formula below.
4. Experiments and Results
From theses input variables, Bayesian Network was se- lected among many other datamining techniques that are provided by SPSS Clementine. The type of Bayesian Network used in this thesis is TAN. In order to set the model, 90% of raw data is categorized as training set and that of 10% as testing set.
Figure 2 is the result of TAN in Bayesian Network
The number of claims 20.8 Of registration 0, PCT 0 0.917 20.8 The number of claims 41.6 Of registration 0, PCT 0 0.077 41.6 The number of claims 62.4 Of registration 0, PCT 0 0.001 62.4 The number of claim
P
P
P
P
(4)
s 83.2 Of registration 0, PCT 0 0.001 83.2 The number of claims Of registration 0, PCT 0 0.001 P
Figure 2. Bayesian network for patent registration.
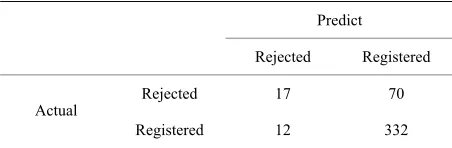
Following Table 9 shows the result of experiments of total 431 OLED patents data.
In reality, 17 rejected patents were actually expected to be rejected. On the other hand, 332 patents were ex- pected to be patented. This shows 80.97% of accuracy.
5. Conclusions
[image:5.595.64.280.87.296.2]Recently, there has been keen competition between com- panies and the government to protect their intellectual properties resulted from R & D activity. This research is to forecast the registration of patents and that of rejection or acceptance in order to provide a model to minimize ex- pense and time of registration. In that, this research used Bayesian network algorithm to forecast the registration and rejection of Korea patents in the area of OLED tech- nology. From national patent data patent data of OLED technology, the date of application, the claim, the infor- mation of applicator and inventor, IPC code, AI, Interna-
Table 3. Conditional probabilities of application date index.
Parents Probability
Of Registration ≤0.2 0.2 - 0.4 0.4 - 0.6 0.6 - 0.8 >0.8
0 0.068 0.410 0.357 0.081 0.081
[image:5.595.58.537.343.401.2]1 0.017 0.322 0.376 0.156 0.126
Table 4. Conditional probabilities of the number of claims.
Parents Probability
Of Registration Of PCT ≤20.8 20.8 - 41.6 41.6 - 62.4 62.4 - 83.2 >83.2
0 0 0.917 0.077 0.001 0.001 0.001
0 1 0.676 0.2 0.104 0.009 0.009
1 0 0.866 0.121 0.011
[image:5.595.57.538.430.515.2]1 1 0.702 0.144 0.004 0.097 0.051
Table 5. Conditional probabilities of the number of inventors.
Parents Probability
Of Registration ADI ≤2.6 2.6 - 4.2 4.2 - 5.8 5.8 - 7.4 >7.4
0 ≤0.2 0.392 0.584 0.007 0.007 0.007
0 0.2 - 0.4 0.546 0.385 0.001 0.065 0.001
0 0.4 - 0.6 0.626 0.295 0.075 0.001 0.001
0 0.6 - 0.8 0.490 0.329 0.167 0.006 0.006
0 >0.8 0.167 0.812 0.006 0.006 0.006
1 ≤0.2 0.392 0.392 0.007 0.2 0.007
1 0.2 - 0.4 0.462 0.410 0.052 0.063 0.010
1 0.4 - 0.6 03638 0.225 0.081 0.054 -
1 0.6 - 0.8 0.347 0.303 0.065 0.238 0.044
[image:5.595.56.536.542.731.2]Table 6. Conditional probabilities of PCT.
Parents Probability
Of Registration ADI 0 1
0 ≤0.2 0.980 0.019
0 0.2 - 0.4 0.932 0.067
0 0.4 - 0.6 0.738 0.261
0 0.6 - 0.8 0.822 0.177
0 >0.8 0.983 0.016
1 ≤0.2 0.788 0.211
1 0.2 - 0.4 0.925 0.074
1 0.4 - 0.6 0.900 0.099
1 0.6 - 0.8 0.954 0.045
[image:6.595.60.538.307.502.2]1 >0.8 0.997 0.002
Table 7. Conditional probabilities of the number of applicants.
Parents Probability
Of Registration ADI ≤1.6 1.6 - 2.4 >2.4
0 ≤0.2 0.782 0.012 0.205
0 0.2 - 0.4 0.963 0.034 0.002
0 0.4 - 0.6 0.958 0.039 0.002
0 0.6 - 0.8 0.817 0.172 0.010
0 >0.8 0.978 0.010 0.010
1 ≤0.2 0.974 0.012 0.012
1 0.2 - 0.4 0.988 0.011 -
1 0.4 - 0.6 0.988 - -
1 0.6 - 0.8 0.997 0.001 0.001
1 >0.8 0.915 0.055 0.028
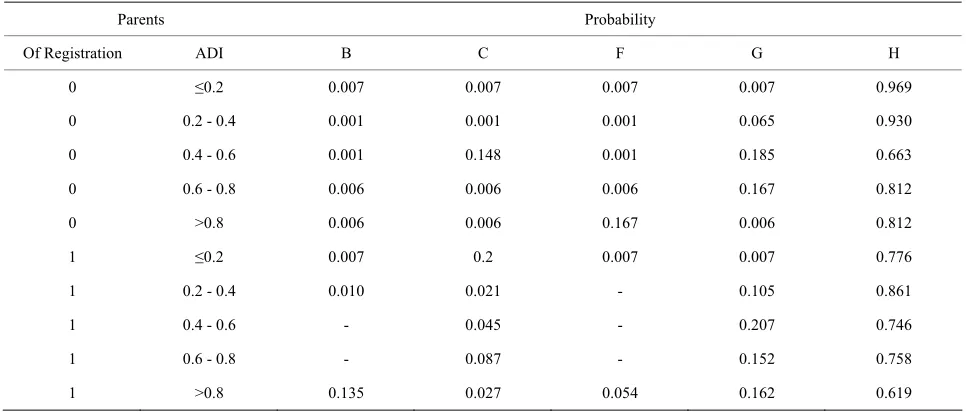
Table 8. Conditional probabilities of the number of IPC.
Parents Probability
Of Registration ADI B C F G H
0 ≤0.2 0.007 0.007 0.007 0.007 0.969
0 0.2 - 0.4 0.001 0.001 0.001 0.065 0.930
0 0.4 - 0.6 0.001 0.148 0.001 0.185 0.663
0 0.6 - 0.8 0.006 0.006 0.006 0.167 0.812
0 >0.8 0.006 0.006 0.167 0.006 0.812
1 ≤0.2 0.007 0.2 0.007 0.007 0.776
1 0.2 - 0.4 0.010 0.021 - 0.105 0.861
1 0.4 - 0.6 - 0.045 - 0.207 0.746
1 0.6 - 0.8 - 0.087 - 0.152 0.758
[image:6.595.56.539.530.736.2]
Table 9. Precision of total patents data.
Predict
Rejected Registered
Rejected 17 70
Actual
Registered 12 332
tional application were used as input variables for this analysis. In order to verify the validity, 90% of raw data was categorized as training set and that of 10% as testing set. Also, this accuracy of the model in total data was shown to be about 80.97%. Furthermore, reliance be- tween each variables and status of registration were visu- ally ensured by the network and it was able to forecast registration and rejection through probability.
I expect this research to become a guide to forecast research on registration and rejection of further patent data. The following research enables to increase the ac- curacy of forecast model about patent registration and rejection on various technologies by using patent data as variables to analyze index of various technology. Also, this research used TAN which is formed to tree form between variables among many different forms of Bayes- ian network such as GBN, NBN etc. Hereafter, perform- ance of various forms of Bayesian network need to com- parative analysis by technology. Furthermore, grafting various assortment data mining techniques like neural network, SVM, decision tree should be needed for fur- ther research.
6. Acknowledgements
This work was supported by the National Research Foun- dation of Korea Gran funded by the Korean Government (MEST) (NRF-R1A4007-2011-0026953).
REFERENCES
[1] C. H. Lee, “States of AMOLED Display Technology,” Optical Science & Technology, Vol. 15, No. 4, 2012, pp. 29-35.
[2] W. H. Cho, “2012 Second-Half Outlook Report,” KDB Daewoo Securities Research Center, 2012, pp. 1-29. [3] Korea Intellectual Property Office, “Patent and
Informa-tion Analysis,” 2007, pp. 46-58.
[4] K. Henning and T. Ulrike, “Chinese Regional Innovation Systems in Times of Crisis: The Case of Guangdong,” Asian Journal of Technology Innovation, Vol. 17, No. 2, 2009, pp. 101-128.
[5] Y. H. Tseng, C. J. Lin and Y. I. Lin, “Text Mining Tech-niques for Patent Analysis,” Information Processing & Management, Vol. 43, No. 5, 2007, pp. 1216-1247. [6] B. W. Lin, C. J. Chen and H. L. Wu, “Predicting Citation
to Biotechnology Patent Based on the Information from the Patent Documents,” International Journal of Tech-nology Management,Vol. 40, No. 1, 2007, pp. 87-100. [7] S. H. Jun, S. S. Park and D. S. Jang, “Technology
Fore-casting Using Matrix Map and Patent Clustering,” Indus-trial Management & Data Systems, Vol. 115, No. 5, 2012, pp. 786-807. doi:10.1108/02635571211232352
[8] W. G. Jung, S. S. Park and D. S. Jang, “Patent Registra-tion PredicRegistra-tion Methodology Using Multivariate Statis-tics,” IEICE Transactions of Information and Systems, Vol. 94, No. 11, 2011, pp. 2219-2226.
doi:10.1016/j.eswa.2010.09.099
[9] C. H. Kim, S. P. Park and Y. H. Ko, “Strategic Manage-ment of Intellectual Property,” Korea Invention Promo-tion AssociaPromo-tion, Seoul, 2011.
[10] A. A. Aljumah, M. G. Ahamad and M. K. Siddiqui, “Pre-dictive Analysis on Hypertension Treatment Using Data Mining Approach in Saudi Arabia,” Intelligent Informa-tion Management, Vol. 3, No. 6, 2011, pp. 252-261.
doi:10.4236//iim.2011.36031
[11] D. Heckerman, “A Tutorial on Learning with Bayesian Networks,” Microsoft Research Advanced Technology Division Microsoft Corporation, Washington, 1995. [12] J. Y. Lee and Y. J. Choi, “Network Identification of
Ma-jor Risk Factor Associated with Delirium by Bayesian Network,” The Korean Journal of Applied Statistics,Vol. 24, No. 2, 2011, pp. 323-333.
[13] A. M. Carvalho, A. L. Oliveira and M. F. Sagot, “Effi-cient Learning of Bayesian Network Classifiers: An Ex-tension to the TAN Classifier,”AI’07 Proceedings of the 20th Australian Joint Conference on Advances in Artifi- cial Intelligence, 2007, pp. 16-25.
[14] Korea Institute of Patent Information, “Patent Analysis Method for Technology Roadmap,” 2005, pp. 93-95. [15] L. Soete and S. Wyatt, “The Use of Foreign Patenting as