ORIGINAL RESEARCH
HEAD & NECK
Diffusion-Weighted Imaging of Orbital Masses:
Multi-Institutional Data Support a 2-ADC Threshold Model to
Categorize Lesions as Benign, Malignant, or Indeterminate
A.R. Sepahdari, L.S. Politi, V.K. Aakalu, H.J. Kim, and A.A.K. Abdel Razek
ABSTRACT
BACKGROUND AND PURPOSE: DWI has been increasingly used to characterize orbital masses and provides quantitative information in the form of the ADC, but studies of DWI of orbital masses have shown a range of reported sensitivities, specificities, and optimal threshold ADC values for distinguishing benign from malignant lesions. Our goal was to determine the optimal use of DWI for imaging orbital masses through aggregation of data from multiple centers.
MATERIALS AND METHODS:Source data from 3 previous studies of orbital mass DWI were aggregated, and additional published data points were gathered. Receiver operating characteristic analysis was performed to determine the sensitivity, specificity, and optimal ADC thresholds for distinguishing benign from malignant masses.
RESULTS:There was no single ADC threshold that characterized orbital masses as benign or malignant with high sensitivity and specificity. An ADC of less than 0.93⫻10⫺3mm2/s was more than 90% specific for malignancy, and an ADC of less than 1.35⫻10⫺3mm2/s was more than 90% sensitive for malignancy. With these 2 thresholds, 33% of this cohort could be characterized as “likely malignant,” 29% as “likely benign,” and 38% as “indeterminate.”
CONCLUSIONS: No single ADC threshold is highly sensitive and specific for characterizing orbital masses as benign or malignant. If we used 2 thresholds to divide these lesions into 3 categories, however, a majority of orbital masses can be characterized with⬎90% confidence.
ABBREVIATIONS:ROC⫽receiver operating characteristic analysis
O
rbital space-occupying lesions represent a heterogeneous group that includes benign tumors, malignant tumors, in-flammatory lesions, vascular lesions, and infections.1Frequent nonclassic clinical presentations, challenging pathologic evalua-tion, and risks associated with biopsy are strong reasons to de-velop better noninvasive diagnostic and imaging tools for orbital disease.Imaging with CT and MR can be helpful in establishing a di-agnosis through demonstration of characteristic patterns of
ana-tomic involvement and through features such as CT attenuation, MR imaging signal intensity, and pattern of contrast enhance-ment.2-9Nevertheless, imaging is frequently nonspecific, and sig-nificant room for improvement remains in imaging diagnosis.
DWI has been increasingly used to characterize solid masses in the head and neck, aiding in the distinction of benign and malig-nant lesions.10Several retrospective studies have characterized orbital masses with DWI, and some have attempted to determine optimal quantitative ADC thresholds and their sensitivity and specificity in distinguishing malignant from benign lesions.11-18 These studies have shown somewhat conflicting results and have been limited by single-institution designs and potential selection bias inherent to their patient populations. Specifically, some stud-ies have suggested that a single ADC threshold can be both highly sensitive and specific for predicting malignancy,16whereas other results have contradicted this statement.11,14
To resolve these outstanding conflicts, we performed an anal-ysis of aggregated data by using all available published data points on the DWI of orbital masses, including aggregated source data from the 3 largest published case series on this topic.14,16,17The Received January 23, 2013; accepted after revision April 9.
From the Department of Radiological Sciences (A.R.S., H.J.K.), David Geffen School of Medicine, University of California, Los Angeles, Los Angeles, California; Depart-ment of Neuroradiology (L.S.P.), San Raffaele Institute of Science, Milan, Italy; De-partment of Ophthalmology and Visual Sciences (V.K.A.), University of Illinois at Chicago, Chicago, Illinois; and Diagnostic Radiology Department (A.A.K.A.R.), Man-soura Faculty of Medicine, ManMan-soura, Egypt.
No conflicting relationship exists for any author.
Please address correspondence to Ali R. Sepahdari, MD, 757 Westwood Plaza, Suite 1621D, Los Angeles, CA 90095; e-mail: [email protected]; [email protected]
Indicates article with supplemental on-line table.
purpose of this study was to better determine what ADC thresh-olds can be used to predict either benign or malignant histology with high confidence.
MATERIALS AND METHODS
Review of Published LiteratureTo conduct an initial meta-analysis, the lead author (A.R.S.) per-formed a MEDLINE search to identify published data on the DWI of orbital masses. The search strings included “orbit” OR “or-bital” AND “DWI” OR “diffusion-weighted,” as well as “head and neck” AND “DWI” OR “diffusion-weighted.” One hundred forty-three results were obtained, as of February 2013. These were reviewed, and studies that did not describe the DWI of orbital space-occupying lesions were excluded, leaving 11 studies. Stud-ies of exclusively intraocular tumors and of demyelinating optic neuritis were excluded in this process. Of these 11, one was ex-cluded because its data were wholly duplicated in a more expan-sive follow-up study from the same authors. The remaining 10 studies, which described 260 orbital masses, were further ana-lyzed.11,12,14,16,17,19-23The lesions described in each of these studies were characterized as either lymphoma, metastasis, nonlymphomatous primary malignancy, benign mass, inflam-matory disease, vascular malformation, or infection. The dis-tribution of lesions across the studies is summarized in the On-line Table.
The review of the literature revealed only 2 studies that reported sufficient quantitative metrics (sensitivity, specific-ity, positive predictive value, negative predictive value) to per-mit meta-analysis, both from this study’s authors.14,16It was not possible to reconstruct these data from the published re-sults of the other studies, either because of a small sample size or the way the data were summarized. In place of a meta-analysis, we attempted to aggregate as many raw data points as could be obtained on the basis of source data from the study authors’ previous works and ADC values of individual tumors that could be obtained from the literature. All tumors with reported ADC values were included. In some cases, multiple lesions with the same diagnosis were reported as an average and SD of the group. These data were excluded from further analysis because it was impossible to incorporate them into the receiver operating characteristic analysis (ROC). To assess for a systematic bias in lesion distribution, we compared the dis-tribution of lesions from the published data and from the final analysis group against historical data from the largest pub-lished series of orbital masses by Shields et al.1These data are summarized in Table 1.
Data Collection and Analysis
The de-identified data used in this study comprised source data from 3 previously published case series of orbital mass DWI by the authors of this study, consisting of ADC and corresponding clin-ical/pathologic diagnosis for 189 cases.14,16,17 These data were collected with the approval of the respective local institutional review boards/ethics committees, with technical methods as pre-viously described.14,16,17Thirteen additional orbital mass ADC values were obtained through review of the literature. In total, 98 benign lesions and 104 malignant masses were studied. The
re-maining 58 cases were excluded either because quantitative ADC analysis was not performed by the original authors or because the data were reported in a summarized fashion that did not allow the extraction of individual data points.
The data included DWI studies performed on MR imaging machines from different vendors, with different field strengths and different technical parameters. To determine the equiva-lence of the DWI techniques across institutions, we compared the most commonly occurring lesions across the authors’ source datasets with each other by using Kruskal-Wallis anal-ysis. Lymphomas from the 3 source datasets (6, 32, and 6 tu-mors) and inflammatory lesions from the 3 source datasets (20, 13, and 6 lesions) were compared.
The data were then grouped into benign and malignant cate-gories. For each of these categories, descriptive statistics, Stu-dentt tests, and ROC were performed. These analyses were performed for all lesions in aggregate and for the authors’ source datasets separately. Sensitivity and specificity of various ADC thresholds for distinguishing benign from malignant masses were determined.
Lymphoma and inflammatory lesions were also compared with each other separately because there is considerable clinical and radiologic overlap in these conditions. As mentioned above, descriptive statistics, Studentttests, and ROC were performed.
In consideration of the disproportionately large number of lymphoma lesions in our dataset, which may skew the results through characteristically low ADC, ROC was also performed, comparing benign lesions and malignant tumors, after excluding lymphomas.
RESULTS
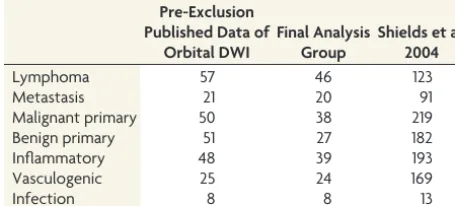
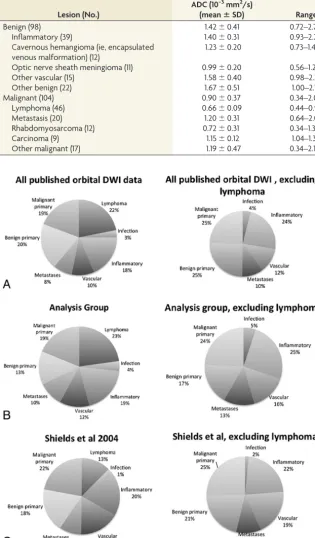
Lesions Analyzed [image:2.594.303.531.74.177.2]The final analysis group consisted of 202 patients with 98 benign lesions and 104 malignant lesions. The most common benign le-sions were inflammatory masses (n⫽39), vascular lesions (n⫽ 24), and optic nerve sheath meningiomas (n⫽11). The most common malignant lesions were lymphoma (n⫽46) and metas-tases (n⫽20). The data are summarized in Table 2. The compo-sition of the final analysis group of 202 subjects was similar to the composition of the 260 subjects imaged with DWI before exclu-sion of unavailable data points (Table 1 and Fig 1), though with a modest reduction in the proportion of benign primary lesions. Table 1: Distribution of lesions by category in published studies of DWI, analysis group of this study, and in the largest reported clinical series by Shields et al, 2004a
Pre-Exclusion Published Data of
Orbital DWI
Final Analysis Group
Shields et al, 2004
Lymphoma 57 46 123
Metastasis 21 20 91
Malignant primary 50 38 219
Benign primary 51 27 182
Inflammatory 48 39 193
Vasculogenic 25 24 169
Infection 8 8 13
a
Any lesions from the Shields et al1
Both groups contained a larger proportion of lymphoma lesions than would be expected on the basis of available epidemiologic data.1When lymphomas were excluded, the composition of the pre-exclusion group, final analysis group, and the epidemiologic data was similar (Fig 1).
Validation of ADC across Techniques
There was no significant difference in the ADC of lymphoma across the authors’ source datasets (P⫽.98). Likewise, there was no significant difference in ADC of inflammatory lesions across these datasets (P⫽.42). These data are summarized in Table 2.
Descriptive Characteristics
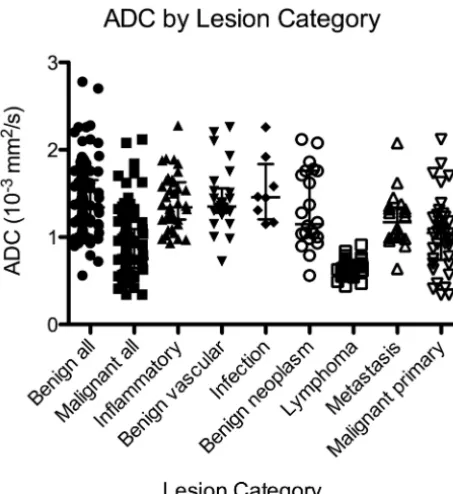
Benign lesions showed an ADC of 1.43⫾0.41⫻10⫺3mm2/s (mean). Ma-lignant lesions showed ADC of 0.90⫾ 0.36⫻10⫺3mm2/s (Table 3). Figure 2 shows a scatterplot of lesion categories with corresponding ADCs. There were significant differences between benign and malignant lesions with respect to ADC (P⬍.0001), and these differences were visually apparent (Fig 3). Signifi-cant differences remained (P⬍.0001), even after exclusion of lymphomas.
ADC Performance in Distinguishing Benign from Malignant Lesions
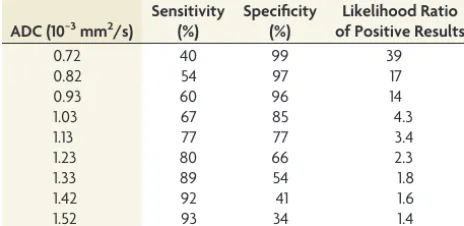
The area under the ROC curve for aggre-gated data was 0.84. An ADC threshold of less than 0.93⫻10⫺3mm2/s resulted in a 60% sensitivity and 96% specificity for malignancy. A more lenient threshold of ADC less than 1.35⫻10⫺3mm2/s re-sulted in 90% sensitivity for malignancy, but only 49% specificity. When lympho-mas were excluded, the area under the ROC curve dropped to 0.73. The 0.93⫻ 10⫺3mm2/s threshold resulted in only a 28% sensitivity for malignancy, with a 96% specificity. Figure 4 shows the ROC curve for distinguishing benign from ma-lignant lesions. Table 4 shows the sensitiv-ities and specificsensitiv-ities of various ADC values for distinguishing benign from ma-lignant lesions.
ADC Performance in Distinguishing Lymphoma from Inflammatory Disease
Lymphomas showed an ADC of 0.67⫾ 0.09⫻10⫺3mm2/s. Inflammatory le-sions showed an ADC of 1.40⫾0.31⫻ 10⫺3mm2/s. There was no overlap be-tween lymphoma and inflammatory le-sions. Only 2 of 46 lymphomas had an ADC of greater than 0.8⫻10⫺3mm2/s, which approached the range of the lowest ADC inflammatory lesions. An ADC threshold of less than 0.92⫻10⫺3mm2/s distinguished lymphoma from inflamma-tion with 100% sensitivity (95% confi-dence interval, 92%–100%) and 100% specificity (95% confidence interval, 91%–100%).
[image:3.594.55.371.129.668.2]FIG 1. Lesion distribution by category. The left column shows the relative proportion of lesions encountered in all published studies of orbital DWI (A), in this analysis (B), and by Shields et al1 during a 30-year period (C). The published literature and our analysis group contain a higher proportion of lymphoma cases than would be predicted by Shields et al. Otherwise, the relative proportion of lesions across these 3 groups is similar, as is seen after exclusion of lymphomas (right column).
Table 2: Summarized ADC values of commonly occurring lesions
Lesion (No.)
ADC (10−3mm2/s)
(meanⴞSD) Range
Benign (98) 1.42⫾0.41 0.72–2.78
Inflammatory (39) 1.40⫾0.31 0.93–2.28
Cavernous hemangioma (ie, encapsulated venous malformation) (12)
1.23⫾0.20 0.73–1.44
Optic nerve sheath meningioma (11) 0.99⫾0.20 0.56–1.28
Other vascular (15) 1.58⫾0.40 0.98–2.26
Other benign (22) 1.67⫾0.51 1.00–2.78
Malignant (104) 0.90⫾0.37 0.34–2.08
Lymphoma (46) 0.66⫾0.09 0.44–0.91
Metastasis (20) 1.20⫾0.31 0.64–2.08
Rhabdomyosarcoma (12) 0.72⫾0.31 0.34–1.31
Carcinoma (9) 1.15⫾0.12 1.04–1.39
DISCUSSION
This analysis showed that DWI produces equivalent quantitative ADC values across a variety of MR imaging scanners and tech-niques, a finding that is in concert with expectations based on previous investigation.24There were significant differences be-tween benign and malignant lesions, though with notable overlap. ADC was highly accurate in distinguishing lymphoma from in-flammatory disease.
Previous studies of orbital mass DWI have demonstrated its technical feasibility and potential clinical uses. These studies have conflicted somewhat in their results, however, and each has been limited by a retrospective, single-institution design. Therefore, the role of DWI in evaluating orbital masses remains unclear. Aggregating data from multiple institutions removes some of the selection bias inherent in the individual studies. Furthermore, this analysis verifies that quantitative ADC values are generalizable across a range of MR imaging scanners and techniques.
Previous studies have conflicted in their reports of the overall sensitivity and specificity of DWI for differentiating benign from malignant lesions and have conflicted slightly in their optimal ADC thresholds. Sepahdari et al14reported an optimal threshold value of 1.0⫻10⫺3mm2/s for differentiating benign from malig-nant lesions, with an associated 63% sensitivity and 86% specific-ity. Razek et al16reported an optimal threshold value of 1.15⫻ 10⫺3mm2/s, with a sensitivity of 95% and specificity of 91%.
Politi et al17did not specifically address the question of differen-tiating benign from malignant lesions, but they reported an ADC threshold of 0.775⫻10⫺3mm2/s for distinguishing lymphoma from nonlymphoma lesions with a 96% sensitivity and 93% spec-ificity. Roshdy et al11did not attempt to calculate a threshold ADC value and associated sensitivity and specificity, but they did note overlap between benign and malignant lesions.
The results of this multi-institutional analysis indicate that there is no single ADC threshold that is both sensitive and specific for distinguishing benign from malignant lesions. On the basis of these results, we propose a 2-threshold model for characterizing orbital masses with DWI: 1) “likely malignant,” for lesions with a ⬎90% probability of malignancy, based on an ADC less than 0.93⫻10⫺3mm2/s (33% of this cohort); 2) “likely benign,” for lesions with a⬎90% probability of benignity, based on an ADC greater than 1.35⫻10⫺3mm2/s (29% of this cohort); and 3) “indeterminate,” for lesions with ADCs between 0.93 and 1.35⫻ 10⫺3mm2/s (38% of this cohort).
In general, the optimal clinical use of DWI for evaluating an orbital mass will depend on the differential diagnosis dictated by other clinical and imaging data. For example, differentiation be-tween lymphoma and atypical lymphocytic infiltrate or other or-bital inflammatory diseases is a common diagnostic dilemma,8 for which DWI proves quite useful. On occasion, it can be difficult to distinguish an infantile hemangioma (capillary hemangioma) or a vascular malformation from a rhabdomyosarcoma in a pedi-atric patient,25 another task for which DWI would seem well-suited.21There are, however, tasks for which DWI may be limited. There was overlap in the ADC of optic nerve sheath meningioma and lymphoma, and DWI may also fail to distinguish these lesions in cases in which the imaging appearance and clinical findings overlap. The clinical and conventional imaging data should al-ways be weighted appropriately when evaluating any single case, to ensure that the DWI information contributes to the analysis rather than detracting from it. In a practical setting, we believe that DWI is best used as a tool to further refine a short differential provided by the clinical presentation and the other imaging data. There were 4 major limitations to this study. The first is that the data were acquired on multiple scanner types, with slight dif-ferences in acquisition technique and methods of measuring ADC. This feature is both a strength and a weakness of the study design. Although less technical standardization weakens the in-ternal validity of the data, equivalent ADC values of similar lesions across multiple datasets suggest that quantitative ADC measure-ments are robust across multiple platforms. The second limita-tion is that some of the results may not be generalizable across all practices. The sensitivity, specificity, and accuracy of DWI in dis-tinguishing benign from malignant lesions depend on the study population because there is heterogeneity in lesions. This study FIG 2. Scatterplot of ADC by lesion category shows consistently low
[image:4.594.54.531.58.122.2]ADC for lymphoma and a wide distribution of ADC for nonlymphoma malignancies.
Table 3: Descriptive statistics of orbital lesion ADC across the largest source datasets (ADC in units of 10ⴚ3mm2/s)
All Lesions (n= 183) Sepahdari et al13(n= 50) Politi et al17(n= 90) Razek et al16(n= 43) Benign lesion ADC (mean, 95% CI) 1.42⫾0.41 (1.34–1.51) 1.36⫾0.41 (1.22–1.51) 1.39⫾0.42 (1.25–1.54) 1.53⫾0.35 (1.37–1.67) Malignant lesion ADC (mean, 95% CI) 0.90⫾0.37 (0.83–0.98) 1.02⫾0.42 (0.80–1.24) 0.88⫾0.36 (0.79–0.98) 0.80⫾0.34 (0.65–0.95) Lymphoma ADC (mean, 95% CI) 0.67⫾0.09 (0.64–0.69) 0.69⫾0.16 (0.58–0.86)a 0.67⫾0.07 (0.60–0.75) 0.67⫾0.07 (0.60–0.73)a Inflammatory lesion ADC (mean, 95% CI) 1.40⫾0.31 (1.30–1.50) 1.42⫾0.37 (1.24–1.60) 1.45⫾0.26 (1.29–1.60) 1.24⫾0.13 (1.18–1.33)a Area under ROC curve (95% CI) 0.84 (0.79–0.90) 0.74 (0.58–0.89) 0.86 (0.79–0.94) 0.95 (0.87–1.0)
a
[image:4.594.56.283.140.387.2]includes a larger number of patients with lymphoma and a larger proportion of lymphomas compared with other malignancies than would be expected in an unselected group of patients based on available epidemiologic data.1This fact likely improves the observed sensitivity and specificity of DWI for distinguishing be-nign from malignant lesions, due to the characteristic very low
ADC of lymphoma. When lymphoma lesions were removed from the analysis, the ability of DWI to differentiate be-nign from malignant lesions dropped. Nevertheless, there were still significant differences between benign and malig-nant lesions.
The results of this ad hoc subgroup analysis should be interpreted cau-tiously because the removal of lym-phoma lesions reduces the sample size and introduces other biases. A third limi-tation is the inability to quantify variability in ADC measurements. A degree of in-traobserver and interobserver variability in the measurement of lesion ADC is ex-pected, and a degree of scan-to-scan vari-ation in ADC is also expected. Without the ability to quantify these factors, it can be difficult to interpret the results of a single ADC measurement in a single patient. Overall, the effect of measurement error between or within observers on a single scan has been shown to be small,26and the variability in ADC between different scan-ners is similarly small.27
Finally, there are multiple areas of potential bias that could not be ad-dressed by the study design. There may be a degree of selection bias within stud-ies, with selective exclusion of some data points or publication bias related to ex-clusion of results that do not support a role for DWI. The exclusion of published studies for which ADC values could not be obtained could also affect the results. Note that 2 lymphomas and 3 rhabdomyosar-comas reported by Roshdy et al11showed higher average ADC than was observed in our group but were excluded because the ADC data were reported as an average. Specifically, Roshdy et al reported 2 lacri-mal gland lymphomas whose average ADC overlapped that in the inflammatory lesions we observed. Our study may there-fore overestimate the true performance of DWI in distinguishing lymphoma from inflammatory disease.
CONCLUSIONS
This analysis of multi-institutional data confirms that benign and malig-nant orbital tumors have significant differences in ADC. There was no single ADC threshold that was both highly sensitive and specific for predicting malignancy. On the basis of these re-sults, we propose a “likely malignant” threshold ADC of ⬍0.93 ⫻ 10⫺3 mm2/s, a “likely benign” threshold ADC of
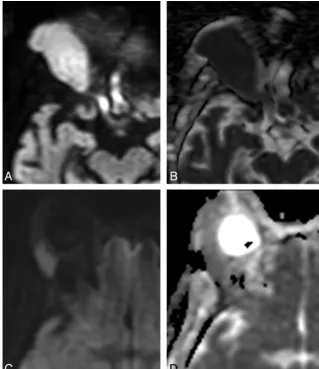
⬎1.35⫻10⫺3mm2/s, and an “indeterminate range” ADC be-FIG 3.Comparison between orbital lymphoma (AandB) and orbital inflammatory disease (Cand
D).A, Axial DWI shows a right orbital mass with marked hyperintensity.B, Corresponding axial ADC map shows dark signal, indicating low ADC and hypercellularity typical of lymphoma. ADC of this lesion was 0.65⫻10⫺3mm2/s.C, Axial DWI in a different patient shows a lacrimal gland mass with less intense signal compared withA.D, Corresponding axial ADC map shows intermediate signal, brighter than adjacent brain parenchyma, reflective of the lower cellularity seen in orbital inflammatory lesions. The ADC of this lesion was 1.09⫻10⫺3mm2/s.
[image:5.594.54.374.48.417.2] [image:5.594.55.341.503.596.2]tween 0.93 and 1.35⫻10⫺3mm2/s when evaluating orbital masses with DWI. Knowledge of the expected ADC values of common lesions may also be helpful in organizing the differ-ential diagnosis determined by other clinical and imaging data. DWI may be particularly helpful in distinguishing inflamma-tory disease from lymphoma.
ACKNOWLEDGEMENTS
We would like to thank Dr. Sahar M. Elkhamary, of King Khaled Eye Specialist Hospital and Mansoura University Faculty of Med-icine, for providing data for this study.
REFERENCES
1. Shields J, Shields C, Scartozzi R.Survey of 1264 patients with orbital tumors and simulating lesions. 1. The 2002 Montgomery Lecture, part 1.Ophthalmology2004;111:997–1008
2. Mafee M, Karimi A, Shah J, et al.Anatomy and pathology of the eye: role of MR imaging and CT. Neuroimaging Clin North Am 2005;15:23– 47
3. Mafee MF, Edward DP, Koeller KK, et al.Lacrimal gland tumors and simulating lesions: clinicopathologic and MR imaging features. Ra-diol Clin North Am1999;37:219 –39, xii
4. Mafee MF, Goodwin J, Dorodi S.Optic nerve sheath meningiomas: role of MR imaging.Radiol Clin North Am1999;37:37–58, ix 5. Mafee MF, Dorodi S, Pai E.Sarcoidosis of the eye, orbit, and central
nervous system: role of MR imaging.Radiol Clin North Am1999;37: 73– 87, x.
6. Valvassori GE, Sabnis SS, Mafee RF, et al.Imaging of orbital lym-phoproliferative disorders.Radiol Clin North Am1999;37:135–50, x–xi
7. Carroll GS, Haik BG, Fleming JC, et al.Peripheral nerve tumors of the orbit.Radiol Clin North Am1999;37:195–202, xi–xii
8. Akansel G, Hendrix L, Erickson BA, et al.MRI patterns in orbital malignant lymphoma and atypical lymphocytic infiltrates.Eur J Radiol2005;53:175– 81
9. Smoker WR, Gentry LR, Yee NK, et al.Vascular lesions of the orbit: more than meets the eye.Radiographics2008;28:185–204, quiz 325 10. Razek AA.Diffusion-weighted magnetic resonance imaging of head
and neck.J Comput Assist Tomogr2010;34:808 –15
11. Roshdy N, Shahin M, Kishk H, et al.MRI in diagnosis of orbital masses.Curr Eye Res2010;35:986 –91
12. Kapur R, Sepahdari AR, Mafee MF, et al.MR imaging of orbital inflammatory syndrome, orbital cellulitis, and orbital lymphoid lesions: the role of diffusion-weighted imaging.AJNR Am J Neuro-radiol2009;30:64 –70
13. Sepahdari AR, Kapur R, Aakalu VK, et al.Diffusion-weighted imag-ing of malignant ocular masses: initial results and directions for further study.AJNR Am J Neuroradiol2012;33:314 –19
14. Sepahdari AR, Aakalu VK, Setabutr P, et al.Indeterminate orbital masses: restricted diffusion at MR imaging with echo-planar diffusion-weighted imaging predicts malignancy. Radiology 2010;256:554 – 64
15. Sepahdari AR, Aakalu VK, Kapur R, et al.MRI of orbital cellulitis and orbital abscess: the role of diffusion-weighted imaging.AJR Am J Roentgenol2009;193:W244 –50
16. Razek AA, Elkhamary S, Mousa A.Differentiation between benign and malignant orbital tumors at 3-T diffusion MR-imaging. Neuro-radiology2011;53:517–22
17. Politi LS, Forghani R, Godi C, et al.Ocular adnexal lymphoma: dif-fusion-weighted MR imaging for differential diagnosis and thera-peutic monitoring.Radiology2010;256:565–74
18. de Graaf P, Pouwels PJ, Rodjan F, et al.Single-shot turbo spin-echo diffusion-weighted imaging for retinoblastoma: initial experience. AJNR Am J Neuroradiol2012;33:110 –18
19. Srinivasan A, Dvorak R, Perni K, et al.Differentiation of benign and malignant pathology in the head and neck using 3T apparent diffu-sion coefficient values: early experience.AJNR Am J Neuroradiol 2008;29:40 – 44
20. Maeda M, Kato H, Sakuma H, et al.Usefulness of the apparent dif-fusion coefficient in line scan difdif-fusion-weighted imaging for dis-tinguishing between squamous cell carcinomas and malignant lymphomas of the head and neck. AJNR Am J Neuroradiol 2005;26:1186 –92
21. Lope LA, Hutcheson KA, Khademian ZP.Magnetic resonance imag-ing in the analysis of pediatric orbital tumors: utility of diffusion-weighted imaging.J AAPOS2010;14:257– 62
22. Yang BT, Wang YZ, Dong JY, et al.MRI study of solitary fibrous tumor in the orbit.AJR Am J Roentgenol2012;199:W506 –11 23. Kamano H, Noguchi T, Yoshiura T, et al.Intraorbital lobular
capillary hemangioma (pyogenic granuloma). Radiat Med 2008;26:609 –12
24. Chenevert TL, Galba´n CJ, Ivancevic MK, et al.Diffusion coefficient measurement using a temperature-controlled fluid for quality con-trol in multicenter studies.J Magn Reson Imaging2011;34:983– 87 25. Chung EM, Specht CS, Schroeder JW.From the archives of the
AFIP: pediatric orbit tumors and tumorlike lesions: neuroepi-thelial lesions of the ocular globe and optic nerve.Radiographics 2007;27:1159 – 86
26. Bilgili Y, Unal B.Effect of region of interest on interobserver vari-ance in apparent diffusion coefficient measures.AJNR Am J Neuro-radiol2004;25:108 –11
[image:6.594.53.285.66.179.2]27. Sasaki M, Yamada K, Watanabe Y, et al.Variability in absolute ap-parent diffusion coefficient values across different platforms may be substantial: a multivendor, multi-institutional comparison study.Radiology2008;249:624 –30
Table 4: Sensitivity and specificity of various ADC threshold values for distinguishing benign from malignant lesions
ADC (10−3mm2/s)
Sensitivity (%)
Specificity (%)
Likelihood Ratio of Positive Results
0.72 40 99 39
0.82 54 97 17
0.93 60 96 14
1.03 67 85 4.3
1.13 77 77 3.4
1.23 80 66 2.3
1.33 89 54 1.8
1.42 92 41 1.6