http://www.scirp.org/journal/health ISSN Online: 1949-5005 ISSN Print: 1949-4998
DOI: 10.4236/health.2017.913132 Dec. 20, 2017 1817 Health
Interpreting Dose-Response Relation for
Exposure to Multiple Sound Impulses
in the Framework of Immunity
Hongyun Wang
1, Wesley A. Burgei
2, Hong Zhou
3*1Department of Applied Mathematics and Statistics, University of California, Santa Cruz, CA, USA 2US Department of Defense, Joint Non-Lethal Weapons Directorate, Quantico, VA, USA
3Department of Applied Mathematics, Naval Postgraduate School, Monterey, CA, USA
Abstract
Hearing loss is a common military health problem and it is closely related to exposures to impulse noises from blast explosions and weapon firings. In a study based on test data of chinchillas and scaled to humans (Military Medi-cine, 181: 59-69), an empirical injury model was constructed for exposure to multiple sound impulses of equal intensity. Building upon the empirical in-jury model, we conduct a mathematical study of the hearing loss inin-jury caused by multiple impulses of non-uniform intensities. We adopt the theoretical framework of viewing individual sound exposures as separate injury causing events, and in that framework, we examine synergy for causing injury (fati-gue) or negative synergy (immunity) or independence among a sequence of doses. Starting with the empirical logistic dose-response relation and the em-pirical dose combination rule, we show that for causing injury, a sequence of sound exposure events are not independent of each other. The phenomeno-logical effect of a preceding event on the subsequent event is always immuni-ty. We extend the empirical dose combination rule, which is applicable only in the case of homogeneous impulses of equal intensity, to accommodate the general case of multiple heterogeneous sound exposures with non-uniform intensities. In addition to studying and extending the empirical dose combi-nation rule, we also explore the dose combicombi-nation rule for the hypothetical case of independent events, and compare it with the empirical one. We meas-ure the effect of immunity quantitatively using the immunity factor defined as the percentage of decrease in injury probability attributed to the sound expo-sure in the preceding event. Our main findings on the immunity factor are: 1) the immunity factor is primarily a function of the difference in SELA (A- weighted sound exposure level) between the two sound exposure events; it is How to cite this paper: Wang, H., Burgei,
W.A. and Zhou, H. (2017) Interpreting Dose-Response Relation for Exposure to Multiple Sound Impulses in the Framework of Immunity. Health, 9, 1817-1842.
https://doi.org/10.4236/health.2017.913132 Received: October 8, 2017
Accepted: December 17, 2017 Published: December 20, 2017
Copyright © 2017 by authors and Scientific Research Publishing Inc. This work is licensed under the Creative Commons Attribution International License (CC BY 4.0).
http://creativecommons.org/licenses/by/4.0/
DOI: 10.4236/health.2017.913132 1818 Health
virtually independent of the magnitude of the two SELA values as long as the difference is fixed; 2) the immunity factor increases monotonically from 0 to 100% as the first dose is varied from being significantly below the second dose, to being moderately above the second dose. The extended dose-response formulation developed in this study provides a theoretical framework for as-sessing the injury risk in realistic situations.
Keywords
Risk of Significant Injury, Logistic Dose-Response Relation, SELA (A-Weighted Sound Exposure Level), Effective SELA for Multiple Heterogeneous Sound Impulses, Fatigue and Immunity
1. Introduction
Hearing loss is the third most common health problem in the US and more than 28 million Americans have lost some hearing. There are three basic types of hearing loss: conductive hearing loss, sensorineural hearing loss and mixed hearing loss [1]. This classification is based on which part of the auditory system is damaged. Conductive hearing loss occurs when there is damage to the eardrum and the tiny bones of the middle ear. It may be caused by ear infection or impacted earwax and it results in a reduction in the ability to hear faint sounds. Luckily, conductive hearing loss can often be medically or surgically reversed. Sensorineural hearing loss stems from damage to the inner ear or auditory nerve. For people with sensorineural hearing loss, sound appears unclear or muffled. Unfortunately, sensorineural hearing loss is permanent. It cannot be corrected but patients with sensorineural hearing loss can be helped through the use of hearing aids. When a conductive hearing loss occurs together with a sensorineural hearing loss, the hearing loss is called a mixed hearing loss. Symptoms of mixed hearing loss include sounds turning softer in volume and becoming more difficult to understand. One possible cause of sensorineural hearing loss is exposure to loud noise or blast, which is very common in a battlefield. In fact, hearing loss is one of the most prevalent military medical problems. According to the US Department of Veterans Affairs [2] [3], in 2014 more than 933,000 Veterans have hearing loss disability, and nearly 1.3 million experiencing tinnitus which refers to the perception of a ringing, buzzing, or other kind of noise in the ears [4]. With an increasing trend in hearing loss among veterans, it is important to be able to assess the risk of significant hearing loss injury when exposed to blast explosions [5].
DOI: 10.4236/health.2017.913132 1819 Health
similar to those of humans. They used the A-weighted sound exposure level (SELA) as an effective single metric (the dose) for predicting the injury risk [8]. Based on the test data they constructed a logistic dose-response relation for unprotected human ears. They adopted an empirical dose combination rule to combine multiple identical sound impulses, uniformly distributed in time, into one effective combined dose [6] [9]. The injury risk over the combined event (i.e., over the sequence of multiple noise shots) is governed by the dose-response relation with the effective combined SELA as the dose.
They also validated the dose-response curve against historical human data from rifle noise tests [10] and proposed a temporary threshold shift (TTS) recovery model in the form of a log-linear function.
In this paper, we carry out a mathematical analysis based on the dose-response relation and the dose combination rule developed in [6]. The motivations of our analysis are: 1) to understand the risk of hearing loss injury caused by multiple noise impulses from the point of view of individual sound exposure events; 2) to extend the dose combination rule developed in [6] to accommodate the general case where we need to combine multiple heterogeneous impulses of non-uniform SELA values into one effective combined SELA value. In the framework of the dose-response relation and the dose combination rule, we examine the synergy for causing injury (fatigue) or negative synergy (immunity) or independence among sound exposure events. The sign and magnitude of synergy will shed light on the role of acoustic reflex (which tends to decrease the injury risk for subsequent sound exposures) and on the role of fatigue/partial damage (which tends to increase the injury risk for subsequent sound exposures). Our primary goal is to establish a unified dose-response formulation for assessing the injury risk of unprotected ears caused by a heterogeneous sequence of sound exposures with non-uniform SELA values. This extended dose-response formulation will provide the foundation for assessing the injury risk in realistic situations.
DOI: 10.4236/health.2017.913132 1820 Health
2. Review of Relevant Results in [6]
In [6], experimental data of permanent threshold shift (PTS) after exposure to multiple impulse noise shots was studied. A dose-response relation was con- structed for PTS of various cut-off levels. The empirical dose-response relation is expressed in the form of a logistic model:
(
comb)
(
(
)
)
comb 50
1 SELA
1 exp SELA ID
P
α
=
+ − − (1)
In the dose-response relation (1):
SELAcomb is the combined A-weighted sound exposure level, a combined
single metric quantifying the overall effect of multiple impulse shots;
P is the probability of PTS of a given cut-off level (for example, PTS > 40 dB);
ID50 denotes median injury dose at which the injury risk P is 50%; and
α
is the coefficient describing the steepness of the curve around the medianinjury dose.
In [6], parameters ID50 and
α
were determined from experimental datafor individual PTS cut-off levels ranging from 1 dB to 70 dB. It was observed that the steepness coefficient
α
remains approximately constant around(
)
0.1 dBA
α= for the whole range of PTS cut-off levels. The median injury
dose ID50, however, increases monotonically with respect to the PTS cut-off
level. It goes from ID50=136 dBA at 1 dB PTS cut-off to ID50=212 dBA at
[image:4.595.272.477.459.627.2]70 dB PTS cut-off. For 40 dB PTS cut-off, ID50=170 dBA.
Figure 1 shows the dose-response relations for PTS cut-off levels ranging from 5 dB to 60 dB, based on parameter values from [6]. The thick gray curve
Figure 1. Permanent threshold shift (PTS) dose-response relations. The dose is the A-weighted sound exposure level (SELA); the response is the magnitude of PTS (a random variable), represented as the probability of PTS above a given cut-off level. The dose-response relations are plotted, respectively, for PTS cut-off levels 5 dB, 10 dB, 25 dB, 40 dB, 50 dB, and 60 dB, using parameter values from [6]. The thick gray curve is for
(
)
0.2 dBAα= and ID50=170 dBA, demonstrating the effect of doubling steepness
DOI: 10.4236/health.2017.913132 1821 Health
depicts a hypothetical dose-response relation with α =0.2 dBA
(
)
, twice thevalue from experimental data [6]. It illustrates the effect of steepness coefficient
α
.In this study, we define injury as PTS above 40 dB, which has a median injury dose of 170 dBA. In the subsequent analysis, we shall use ID50=170 dBA
unless specified otherwise.
In the dose-response relation (1), the dose is quantified by SELAcomb. For a
single shot (one impulse), the sound exposure (SE) is defined as the time integral of squared A-weighted sound pressure:
( )
(
)
2A-weighted d
E=
∫
p t t (2)Conventionally, the sound exposure in the air is measured relative to the
reference sound exposure
(
)
20 400 Pa s
E ≡ µ ⋅ . The sound exposure level (SELA)
expresses the sound exposure in the unit of dBA as
( )
(
)
(
)
10 0
2
10 2
SELA 10 log dBA
A-weighted d
10 log dBA
400 Pa s
E
E
p t t
=
=
µ ⋅
∫
(3)For multiple shots of equal intensity, the effective combined SELA for N shots is calculated using the dose combination rule described in [6]:
comb 10
SELA =SELA+λlog N (4)
where N is the number of impulses, and SELA is sound exposure level of each individual impulse. Here “effective combined SELA” or “dose combination” means “combining multiple sound exposure events into one composite event with an effective combined SELA value as a single metric quantifying the overall effect of multiple sound exposure events”. We call this “dose combination” instead of “dose accumulation” to distinguish it from the situation where the dose from a preceding sound exposure event has some positive or negative influence on the injury risk in a subsequent event. In summary, “combined dose” means the effective dose for the overall composite event, counting the injury in all element events. In contrast, “cumulative dose” refers to the effective dose for one event, counting the injury in only one event, including both the effect of the current event’s dose and the left-over effects from preceding events’ doses.
DOI: 10.4236/health.2017.913132 1822 Health
Before we end this section, we examine the connection between the sound exposure energy and the dose combination rule (4). Recall from the definition of SELA (3) that the sound exposure energy of each impulse is
( )
SELA 10 0 0
SELA
10 exp ln 10
10
E=E =E
(5)
The sound exposure energy corresponding to the effective combined SELA value (4) can be written out in the same fashion as above
( )
( )
comb comb 0
10 0
10
SELA exp ln 10
10
SELA log
exp ln 10
10
E E
N E
E N
λ
λ
=
+
=
= ⋅
(6)
where E is the sound exposure energy of each impulse given in (5). For λ=10, comb
E is simply the sum of individual energies.
comb
E = ⋅N E (7)
For λ<10, Ecomb is less than the sum of individual energies:
comb
E < ⋅N E (8) In [6], λ=3.44 is used for N≤25 and λ=10 is used for N>25.
3. Independence or Synergy or Negative Synergy among a
Sequence of Doses for Causing Injury
We study analytically the effects of multiple impulse shots based on the mathematical framework of the logistic dose-response relation and the dose combination rule proposed in [6]. The process of analysis will guide us in finding a self-consistent and reasonable way of extending the dose combination rule from the special case of multiple shots of equal intensity (“homogeneous doses”) [6] to the general case of multiple shots of non-uniform intensities (“heterogeneous doses”).
We introduce some short notations to facilitate the discussion.
S: the effective combined SELA of an event where the event may be a single
impulse or a composite event consisting of a sequence of heterogeneous events.
Sj: the effective combined SELA of event j.
G S S
{
1, 2,,SN}
: the effective combined SELA for a sequence of N events,respectively with individual SELA values
{
S S1, 2,,SN}
. Here each event inthe sequence may itself be a composite event consisting of sub-events. Mathematically, function G S S
{
1, 2,,SN}
describes the general dosecombination rule, which is yet to be specified.
DOI: 10.4236/health.2017.913132 1823 Health
{
}
10( )
impulses
, , , log
N
G S S S = +S λ N
(9)
One of the goals in our study is to extend the dose combination rule (9) to the general case where the SELA values
{
S S1, 2,,SN}
are not all equal. In thedose-response relation developed in [6], the dose is fully characterized by the effective combined SELA calculated based on the dose combination rule (9), without distinguishing whether or not the event is a single impulse or a sequence of impulses. This assumption is at least self-consistent.
The self-consistency can be seen by considering a sequence of 2N impulses, each with SELA value S. Let us call it view #1. The sequence can also be viewed as two big events, each big event consisting of N impulses and each big event having the effective combined SELA value S+λlog10
( )
N . Let us call this view#2. The effective combined SELA value calculated using (9) is the same for both view #1 and view #2:
{
}
10( )
2 impulses
View #1: , , , log 2
N
G S S S = +S λ N
{
} {
}
{
}
( )
( )
(
)
( )
( )
impulses impulses
10 impulses
10 10 10
View #2 : , , , , , , ,
, , , log 2
log log 2 = log 2
N N
N
G G S S S G S S S
G S S S
S N S N
λ
λ λ λ
= +
= + + +
For the purpose of extending the formulation to the general case of hete- rogeneous events, we need to bring events with different doses into a problem that can be solved in the special case of homogeneous events. We consider a sequence of
(
m+n)
impulses of equal intensity, each with SELA value S. Wegroup the first m impulses into a composite event E1; and group the rest n
impulses into a composite event E2. Thus, the sequence of
(
m+n)
homo-geneous impulses can be viewed as two composite events E1 and E2 with
different effective combined SELA values.
1 2
Event Event
impulses impulses
, , , , , , ,
E E
m n
S S S S S S
The effective combined SELA value of event E1 is given by (9)
( )
1 log10 E
S = +S
λ
m (10)The effective combined SELA value of event E2 is
( )
2 log10 E
S = +S
λ
n (11)The effective combined SELA value of events E1 and E2 is
(
)
1 2 log10 E E
S + = +S
λ
m n+ (12)DOI: 10.4236/health.2017.913132 1824 Health
(
)
(
)
1
1 50 1
1 exp ID
E
E
P
S
α
=
+ − − (13)
(
)
(
)
2
2 50 1
1 exp ID
E
E
P
S
α
=
+ − − (14)
(
)
(
)
1 2
1 2 50 1
1 exp ID
E E
E E
P
S
α
+
+ =
+ − − (15)
Notice that each injury probability above is directly from the dose-response relation using the SELA value of the event, not including effects from any other events. This is for the case where the event under consideration is treated as a stand-alone event, i.e., not preceded by any other event(s).
While event E1 and event
(
E1+E2)
are indeed stand-alone, event E2 isnot. Event E2 occurs after event E1 in the sequence of events E1 and E2. If
events E1 and E2 are independent of each other, then the three injury pro-
babilities should satisfy the relation
(
1−PE1+E2) (
− −1 PE1)(
1−PE2)
=0 (16)The independence implies that the probability of no injury in the composite event is the product of no-injury probabilities in individual element events.
If the probability of no injury in the composite event is more than the product of no-injury probabilities in individual element events,
(
1−PE1+E2) (
− −1 PE1)(
1−PE2)
>0, then it rules out the independence and indica-tes some kind of negative synergy in the injury mechanism among individual element events (i.e., immunity passed onto subsequent events). Here immunity means that having experienced the sound exposure but not injured in event E1
increases one’s conditional probability of escaping injury in the sound exposure of event E2, and thus, increases the overall no-injury probability of the composite
state E1+E2.
Conversely, if the probability of no injury in the composite event is less than the product of no-injury probabilities in individual element events,
(
1−PE1+E2) (
− −1 PE1)(
1−PE2)
<0, then it also rules out the independence. In thiscase, it indicates some kind of positive synergy in the injury mechanism among individual element events (i.e., fatigue damage passed onto subsequent events). Here fatigue damage means that even if the sound exposure (dose) in event E1
does not directly cause injury, it nevertheless weakens the subject or otherwise makes the subject more vulnerable so as to increase the subject's conditional injury probability in the sound exposure of event E2, and thus decreases the
overall no-injury probability of the composite state E1+E2.
We examine the sign of
(
1−PE1+E2) (
− −1 PE1)(
1−PE2)
to assess the indepen-dence, immunity, or fatigue. First we express PE1 as
(
)
(
)
1
50 1
1
1 50 ID ln10
1 1 1
1
1 exp ID
1 10
E
E
S E
E
P
W
S αλ η
λ
α − −
−
= = ≡
+
+ − −
+
DOI: 10.4236/health.2017.913132 1825 Health
Parameter η and intermediate variable WE1 are defined as
, ln10
αλ
η≡ (18)
( )
1 50 501 1
ID ID
10 10
E
S S
E E
W W S λ m λ
− −
= ≡ = ⋅ (19)
where we have used the expression of SE1 given in (10). In a similar fashion, we
can write PE2 and PE1+E2 as
50
2 2
2
ID
1
, 10
1
S
E E
E
P W n
W
λ η
−
−
= = ⋅
+ (20)
(
)
501 2 1 2
1 2
ID
1
, 10
1
S
E E E E
E E
P W m n
W
λ η
−
+ − +
+
= = + ⋅
+ (21)
Notice directly from (19), (20) and (21) that quantities WE1, WE2 and
1 2
E E
W + are related by a simple additive relation
1 2 1 2
E E E E
W + =W +W (22)
We replace WE1+E2 by WE1+WE2 and write
(
1−PE1+E2) (
− −1 PE1)(
1−PE2)
as(
) (
)(
)
(
) (
)
(
)
(
)
(
)(
)
1 2 1 2
1 2 1 2
1 2 1 2 1 2
1 2 1 2
1 1 1
1 1 1
1 1 1
1 ( ) 1 1
1 1 1
E E E E
E E E E
E E E E E E
E E E E
P P P
W W W W
W W W W W W
W W W W
η η η
η η
η η
η η η
+
− − −
− − − −
= − − − −
+ + + +
+ − + +
=
+ + + +
(23)
Since the denominator is always positive, it follows that the numerator determines the sign of
(
1−PE1+E2) (
− −1 PE1)(
1−PE2)
. We introduce a theorem.Theorem 1: When
η
<1, we always have(
) (
)
1 2 1 2 1 2 0
E E E E E E
Wη +Wη − W +W η+ W W η > (24)
for all WE1>0 and
2 0
E
W > .
The proof of the theorem is presented in Appendix. From Theorem 1, we see that when the parameter
ln10
αλ
η≡ is less than 1, the quantity
(
1−PE1+E2) (
− −1 PE1)(
1−PE2)
is always positive, which clearly rules out theindependence and indicates negative synergy (immunity) in the injury mechanism between preceding and subsequent events. In [6], the logistic dose-response relation based on experimental data has α=0.1 and λ=3.44
or 10. For these parameter values, the quantity
ln10
αλ
η≡ is 0.15 or 0.34, well
within the range of
η
<1. Therefore, in the framework of the logistic dose-DOI: 10.4236/health.2017.913132 1826 Health
event(s), and
2) the effect of a preceding event on the subsequent events is manifested in the form of immunity instead of fatigue; that is, a sequence of sound exposure events demonstrates negative synergy in causing injury.
To further distinguish the dose combination rule (4) from the case of independent events, we consider a sequence of N impulse shots, each with SELA value S. We look at the difference between these two cases in the probability of no injury as a function of N. For each individual shot, when viewed as a stand-alone event, the probability of no injury is given by the dose-response relation (1):
( )
( )50
ID
1 1
e S 1
P S α −
− =
+
In the case of independent events, the probability of no injury for the whole sequence is
( )
(
)
( ID50) 1 1e 1
N N
S
P S α −
− =
+
(25)
When we use the dose combination rule (4) to combine the N impulse shots into one effective SELA value Scomb= +S λlog10
( )
N , the probability of noinjury has the expression
(
)
( ) ( )comb 50 50
comb ID ID
1 1
1
e S 1 e S 1
P S
N
α − η α −
− = =
+ ⋅ + (26)
where η is given in (18). Figure 2 displays the plots of no-injury probability vs
[image:10.595.252.497.464.663.2]N for these two cases, which clearly demonstrates the difference. In the case of independent events, the no-injury probability decays exponentially with respect
DOI: 10.4236/health.2017.913132 1827 Health
to the number of shots N. In the logarithmic scale, the exponential decay yields a downward constant slope. In sharp contrast, the no-injury probability corres- ponding to the dose combination rule in [6] has a much slower decrease with respect to N.
4. Dose Combination Rules
Building on the insight gained in the analysis above, we extend the dose combination rule for a homogeneous sequence of impulse shots [6], to the general case of N sound exposure events of non-uniform SELA values where each event in the sequence may be a composite event consisting of sub-events. Then we construct the dose combination rule for the case of independent events and compare the two rules.
4.1. Extension of the Dose Combination Rule to the General Case
of Multiple Heterogeneous Doses
In Equations (17), (20), and (21) above, we wrote the dose-response relation in terms of an intermediate variable W S
( )
. When we divide a long sequence ofimpulses of the same intensity into two segments and treat each segment as a composite event, the two segments and the whole sequence are each described by its effective combined SELA value
(
SE1,SE2,SE1+E2)
. In particular, the injuryprobability of each segment is described by the dose-response relation with the effective combined SELA value (when it is treated as a stand-alone composite event, excluding the effects of sound exposure in preceding events) . While it is not directly obvious how we can combine SE1 and SE2 to obtain SE1+E2, in
the analysis above a key observation is that the intermediate variable W S
( )
isadditive:
(
E1 E2) ( ) ( )
E1 E2W S + =W S +W S (27)
Thus, we propose to extend the dose combination rule by summing the intermediate variable W S
( )
over all events in the sequence. More specifically,consider a sequence of N sound exposure events where each event in the
sequence may be a composite event consisting of sub-events. Each sound exposure event in the sequence is described by its effective combined SELA value. The whole sequence is specified by SELA values of the N events:
{
Sj,j=1, 2,,N}
.When we view the sequence as an overall composite event, the effective combined SELA value for the whole sequence is denoted by G S S
{
1, 2,,SN}
.Mathematically, function G S S
{
1, 2,,SN}
is specified via the correspondingintermediate variable
(
{
}
)
{1 2 } 50, , , ID 1, 2, , 10
N
G S S S N
W G S S S λ
−
≡
, which is given as
the sum of W S
( )
j over individual events in the sequence.{
}
(
1 2)
( )
1
, , ,
N
N j
j
W G S S S W S
=
=
∑
(28)
DOI: 10.4236/health.2017.913132 1828 Health
combination rule:
{
1 2}
10 ID50 501
, , , log 10 ID
j
S N N
j
G S S S
λ
λ−
=
= +
∑
(29)
Note that when all Sj’s are equal to S, (29) is reduced to
{
, , ,}
log10 ,G S S S = +S λ N (30)
Therefore, the generalized dose combination rule (29) is consistent with the special case dose combination rule described in [6].
The generalized dose combination rule, as given in (29), appears to be affected by the median injury dose ID50. Actually it is not affected by ID50. We can get
rid of ID50 from (29). Let Smax ≡maxkSk. We re-write the generalized dose
combination rule as
{
1 2}
max 10 max1
, , , log 10 ,
j
S S N N
j
G S S S S
λ
λ−
=
= +
∑
(31)
where max max k
k
S ≡ S .
Let us look at a few examples of combining two sound exposure events.
{ }
, log10( )
2 0.3( )
dBG S S = +S λ = +S λ
(
)
{
}
(
)
(
)
(
)
3
10
, 3 3 log 1 10
3 0.19, 3.44
3 1.76, 10
G S S S
S S
λ
λ
λ λ
−
+ = + + +
+ + =
= + + =
The effective combined SELA of two events with S and (S + 3) dB is 0.19 dB and 1.76 dB above the larger one, respectively for λ=3.44 and λ=10. In
terms of SELA values, 3 dB difference means a factor of 2 in sound exposure energy.
(
)
{
}
(
)
(
)
(
)
10
10
, 10 10 log 1 10
10 0.002, 3.44
10 0.41, 10
G S S S
S S
λ
λ
λ λ
−
+ = + + +
+ + =
= + + =
The effective combined SELA of two events with S and (S + 10) dB is 0.002 dB and 0.41 dB above the larger one, respectively for λ=3.44 and λ=10. In
terms of SELA values, 10 dB difference means a factor of 10 in sound exposure energy. In general, for ∆ ≥S λ, the effective combined SELA of two events with
S and S+ ∆S is approximately
(
)
{
}
(
)
(
)
( )
10
, log 1 10
10 ln 10
S
S
G S S S S S
S S
λ
λ
λ λ
−∆
−∆
+ ∆ = + ∆ + +
DOI: 10.4236/health.2017.913132 1829 Health
For moderately large ∆S λ, the combined SELA is just the larger one of the two event.
The generalized dose combination rule (31) is an extension of the rule from [6], which is based on empirical data. For that reason, and for distinguishing different rules of combining doses, we shall refer to (31) as the extended empirical dose combination rule (or just simply, empirical rule), and specifically denote it as GEmpr
{
S S1, 2,,SN}
when necessary. This will set up the propernotation framework allowing us to discuss the dose combination rule for independent events and compare it with the empirical rule, which is the subject of the next subsection.
4.2. Dose Combination Rule for the Case of Independent
Events and Comparison with the Empirical Rule
We study the hypothetical situation where all sound exposure events are independent of each other. We want to write out and examine the dose combination rule corresponding to this situation. Consider a sequence of N
sound exposure events SEQ=
{
Ej,j=1, 2,,N}
with individual SELA values{
Sj,j=1, 2,,N}
. The probability of no injury in each individual event iscalculated from the dose-response relation (1):
(
)
(
50)
(
(
50)
)
1 1
1 1
1 exp ID exp ID 1
j
E
P
S S
α α
− = − =
+ − − − +
When all events are independent of each other, the probability of no injury for the whole sequence is the product of no-injury probabilities of individual events
(
)
(
)
(
)
(
)
1
50 1
1
1 1
exp ID 1
j
N
SEQ E N
j
j j
P P
S
α
=
=
− = − =
− +
∏
∏
(32)On the other hand, the probability of no injury for the whole sequence is governed by the dose-response relation with the effective combined dose denoted by GIndp
{
S S1, 2,,SN}
, which is what we want to find. Here we use thesubscript “Indp” to empasize that the function refers to the case of independent events.
{
}
(
)
(
Indp 1 2 50)
1 1
exp , , , ID 1
SEQ
N
P
G S S S
α
− =
− +
(33)
Mathematically, function GIndp
{
S S1, 2,,SN}
is defined by equating (32)and (33).
{
}
(
)
(
Indp 1 2 50)
(
(
(
50)
)
)
1
exp , , , ID exp ID 1 1
N
N j
j
G S S S S
α α
=
− =
∏
− + −(34)
Solving for GIndp
{
S S1, 2,,SN}
, we arrive at:{
}
(
(
(
)
)
)
Indp 1 2 50 50
1
1
, , , ln exp ID 1 1 ID
N
N j
j
G S S S α S
α =
= − + − +
∏
DOI: 10.4236/health.2017.913132 1830 Health
(35) is the dose-combination rule for the case of independent events. We compare (35) to the empirical rule (31). We first look at the dependence on N
for a homogeneous sequence of N events, each with SELA value S. The empirical rule is a linear function of log10
( )
N .{
}
( )
Empr , , , log10
G S S S = +S λ N
For large N, the combined dose of independent events asymptotically behaves like
{
}
(
( ID50))
Indp 50
1
, , , ln e S 1 ID
G S S S N α
α
−
≈ ⋅ + +
[image:14.595.243.518.309.642.2]
Figure 3 compares the dependence on N of these two dose combination rules. Unlike the empirical rule (31), the combined dose of independent events (35) does depend on the median injury dose ID50. To see the dependence on ID50,
we examine the combined dose of two independent events (N=2), each with
SELA value S.
{ }
(
( ))
( )
(
)
( )
(
)
(
)
50
ID Indp
50
50
50 50 50
1
, ln e 2
1
ln 2 , ID moderately large, negative
1
ln 3 , ID
2 ID ID , ID moderately large, positive
S
G S S S
S S
S S
S S
α
α α α
α
α
−
= + +
+ −
≈ + =
− + −
(36)
Figure 3. Comparison of the two dose combination rules, GIndp and GEmpr for a
sequence of N impulse shots, each with SELA = 160 dBA. Plots of the effective combined dose vs N, respectively, for the two cases, along with the asymptotic approximation for independent events. For large N, the combined dose of independent events asymptotically approaches a linear function of N while the empirical rule is a linear function of
DOI: 10.4236/health.2017.913132 1831 Health
For S moderately below the median injury dose ID50, the combined dose of
independent events behaves the same way as the empirical rule with the increment for empirical rule λlog10
( )
2 replaced by( )
1 ln 2
α . Recall that
parameters
α
and λ are related by parameter η defined in (18):( )
ln 10αλ
η= . As a result, the two increments are related by
( )
10( )
1 1
ln 2 λlog 2
α = ×η
Thus, for η significantly below 1, the increment for independent events is
significantly higher than that in the empirical rule. For example, for
η
=0.15,the two increments differ by a factor of 6.67.
For S moderately above the median injury dose ID50, however, the combined
dose for independent events behaves very differently from the empirical rule. Instead of adding a fixed increment of λlog10
( )
2 , the combined dose forindependent events doubles the amount of S above the median injury dose
50
ID .
To illustrate the behaviors of GIndp
{ }
S S, described in (36), we plot{ }
(
GIndp S S, −S)
, the resulting increment in combining two independent eventsof equal SELA values (S). Figure 4 shows
(
GIndp{ }
S S, −S)
vs S and itsasymptotic approximations respectively for low S and high S, along with
{ }
(
GEmpr S S, −S)
vs S, the corresponding plot for the empirical rule. Themedian injury dose ID50 is indicated by the dotted gray vertical line in Figure 4.
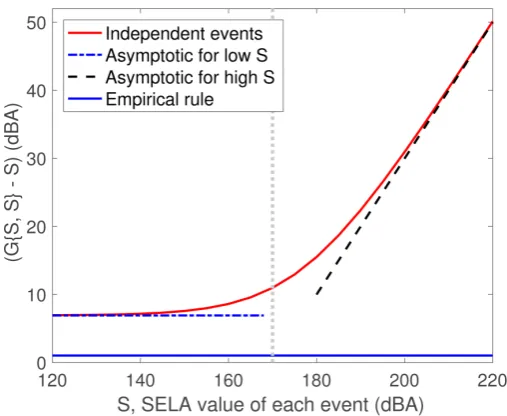
[image:15.595.246.500.442.650.2]Notice that for S above ID50, the combined dose GIndp
{ }
S S, is significantlyFigure 4. Comparison of the two dose combination rules: GIndp
{ }
S S, and GEmpr{ }
S S, .Plot of
(
GIndp{ }
S S, −S)
vs S, its asymptotic approximations respectively for low S andhigh S, and plot of
(
GEmpr{ }
S S, −S)
vs S. The parameters used are λ=3.44, α=0.1, 50DOI: 10.4236/health.2017.913132 1832 Health
higher than S and the increment
(
GIndp{ }
S S, −S)
is approximately(
S−ID50)
.For S below ID50, the increment
(
GIndp{ }
S S, −S)
is approximately constantwith respect to S but is much higher than that for the empirical rule.
To demonstrate the dependence on the median injury dose ID50, in Figure 5,
we plot the combined dose of two events with equal SELA value S=160 dBA
(
)
,as a function of ID50, respectively for the two combination rules. The combined
dose of independent events is a decreasing function of ID50; the empirical rule
has no dependence on ID50.
5. Behaviors of Immunity in the Extended Empirical
Dose-Response Formulation
We start this section by summarizing the extended empirical dose-response formulation for multiple sound exposure events with heterogeneous SELA values
{
S S1, 2,,SN}
. The formulation contains two components: 1) the rulefor combining the heterogeneous doses
{
S S1, 2,,SN}
into one effective dosecomb
S and 2) the dose-response relation mapping the effective dose Scomb to
the occurrence probability of injury.
The extended empirical dose combination rule:
max
comb max 10 max
1
log 10 , max
j
S S N
k k j
S S
λ
λ S S−
=
= + ≡
∑
(37) The dose-response relation:
(
)
(
)
(
)
comb
comb 50
1
1 exp ID
P S
S
α
=
[image:16.595.218.540.341.672.2]+ − − (38)
Figure 5. Comparison of the two dose combination rules: GIndp
{ }
S S, and GEmpr{ }
S S, .Plot of G S S
{ }
, at S=160 as a function of the median injury dose ID50. TheDOI: 10.4236/health.2017.913132 1833 Health
In this section, we study the immunity in the dose-response formulation (37) and (38). We consider the case of two composite sound exposure events E1 and
2
E , respectively with effective combined SELA values
1
E
S and
2
E
S . In the
previous section, we wrote the dose-response relation (38) in terms of interme-
diate variable
( )
50ID
10
S
W S λ
−
≡ and parameter
( )
ln 10αλ η≡ .
( )
( )
( )
( )
50
ID
1
, 10 ,
ln 10 1
S
P S W S
W S λ η αλ η − − = ≡ ≡
+ (39)
We examine several probabilities via intermediate variable W S
( )
.(
)
( )
( )
( )
1 1 1 1 1 1 1 1Pr no injury in 1 ,
1 1
E E
E
E P S W W S
W
W S η η
= − = = ≡
+ +
(
)
(
1 2)
(
)
( )
21 2
2 1 2
Pr no injury in and no injury in
1
1 ,
1
E E E
E E
P S W W S
W W η
+ = − = ≡ + +
(
)
(
)
(
)
(
)
( )
(
)
1 2 1 2 1 1 2 1 1 1 2Pr no injury in | no injury in Pr no injury in and no injury in
Pr no injury in
1 1 1 1 E E E E E E E E
P S W
P S W W
η η + = − + = = − + + (40)
When we treat E2 as a stand-alone event (i.e. excluding any effect left over
from the sound exposure in the preceding event E1), the probability of no
injury in event E2 is
(
)
( )
22 1
2
Pr no injury in , excluding the effect of 1 1 1 E E E P S Wη = − = + (41)
From Theorem 1 in Section 3, we have
(
) (
)
1 2 1 2 1 2
Wη +Wη + W W η > W +W η (42)
Adding 1 to each side of the inequality and then factoring the left-hand side, we obtain
(
1 W1)(
1 W2)
1(
W1 W2)
η
η η
+ + > + + (43)
which yields
(
1 1 2)
21 1 1 1 W W W W η η η + > +
+ + (44)
Comparing (40) and (41) gives us
(
)
(
)
2 1
2 1
Pr no injury in | no injury in
Pr no injury in , excluding the effect of
E E
E E
DOI: 10.4236/health.2017.913132 1834 Health
Therefore, we conclude that the effect of sound exposure in E1 provides an
immunity in the subsequent event E2. We assess the effect of immunity
quantitatively as a percentage of decrease in probability of injury in event E2
due to the preceding event E1, and call it the immunity factor of event E1 on
event E2. Mathematically, the immunity factor is defined as
(
1 2)
(
(
)
)
2 1
2 1
Pr injury in | no injury in
, 1
Pr injury in , excluding the effect of
E E
E E
S S
E E
φ ≡ − (46)
In terms of immunity factor φ, the conditional probability of injury given the prior sound exposure and the unconditional probability of injury are related by
(
)
(
)
(
)
2 1
2 1
Pr injury in E | no injury in
1 Pr injury in , excluding the effect of E
E E
φ
= − × (47)
Below we study the behavior of immunity factor in four regimes of doses. We write probabilities in terms of intermediate variable W S
( )
, and expressthe immunity factor as a function of W1 and W2:
(
)
(
)
(
) (
)
(
)
1 2
1
2 1 2
2
1 2 1 2 1 2 2 1 2
1 1
1 1
1 1
,
1 1
1
1
E E
W
W W W
S S
W
W W W W W W
W W W
η
η η
η
η η
η η
η η
φ
− − − +
+
+ +
=
− +
+ − + +
=
+ +
(48)
We consider regimes described in terms of intermediate variable
( )
ID5010
S
W S λ
−
≡ .
• W =O
( )
1 :The corresponding SELA value has the range S=ID50+λlog10
(
O( )
1)
whichis a small neighborhood around S=ID50
• W =O
( )
:The corresponding SELA value has the range S=ID50−λlog10
(
O( )
1)
which is moderately below the median injury dose ID50.
• W=O
( )
1 :The corresponding SELA value has the range S=ID50−λlog10
(
O( )
1)
which is moderately above the median injury dose ID50
In the analysis below, we assume
( )
1ln 10
αλ
η≡ < . In particular, we will look at
the case of
η
=0.15, corresponding to α=0.1 and λ=3.44, the parametervalues from [6].
Regime 1: The second dose (SE2) is moderately above the first dose (SE1).
( )
(
)
2 1 log10 1
E E
S −S =λ O
which in turn yields
( )
1 2
1 2
10 small
E E
S S
W
O W
λ
−
DOI: 10.4236/health.2017.913132 1835 Health
We use the small parameter 1
( )
2
W O
W = to derive an asymptotic expression
for the immunity factor φ. In the expression of φ given in (48), dividing both the numerator and the denominator by W2
η, we write φ as a function of 1 2
W W and W2 as follows:
(
1 2)
(
)
1 1 2 2 2 1 2 2
1 1 1
, 1 1 E E W W W W W S S W W W η η η η η φ + + − + = + + (49)
Using the Taylor expansion 1 1
2 2
1 W 1 W
W W η η + = + +
, and noticing that for
1
η
< , we have 1( )
( )
12 2
W W
O O
W W
η η
= =
, we obtain
(
)
(
)
(
)
( )
1 2 1 2 1 1 2 2 2 1 2 2 1 2 2 1 2 21 1 1
, 1 1 1 1 10 small E E E E S S W W W W W S S W W W W W W W W W O η η η η η η η η η λ η φ η − + + − + + = + + + + + = + + = + = + = =
Conclusion for Regime 1: The immunity caused by the preceding dose on the subsequent dose of moderately higher SELA value, is small.
Regime 2: The second dose (SE2) is moderately below the first dose (SE1).
( )
(
)
2 1 log10 1
E E
S −S = −λ O
which leads to
( )
2 1 2 1 10 small E E S S W O W λ − = = =We use the small parameter 2
( )
1
W O
W = to derive an asymptotic expression
for the immunity factor
φ
. Dividing both the numerator and the denominator by W1η in the formula of
φ
in Equation (48), we expressφ
in terms of 2 1W W and W1:
(
1 2)
(
)
2 2 1 1 1 2 2 1 1 1
1 1 1
DOI: 10.4236/health.2017.913132 1836 Health
Substituting in the Taylor expansions 2 2
( )
21 1
1 W 1 W O
W W η η + = + +
, and
dividing the numerator and the denominator by 2
(
)
1 1 1 W W W η η +
, we get
(
)
(
)
( )
(
)
( )
( )
( )
1 2 2 2 2 1 1 1 2 2 2 1 1 1 1 1 2 2 1 1 1 2 1 2 1 1 1 , 1 1 1 1 1 1 E E W W W O W W S S W WW W O
W W O W W W W W W O W W η η η η η η η η η η η η φ η η η − − + − + = + + + − + + + = + + + (51)
Applying the expansion 1
(
1)
1 z z
= − +
+
to the denominator, we arrive
at
(
1 2)
1
2 1 2
1 1 1 1 1 2 2 1 1 , 1 1 1 1 1 1 E E
W W W
S S W W W W W W W W η η η η η η η η φ η η − − = − + − + + + = − + + (52)
When SE1 and SE2 move together from low to high with the difference
(
SE2−SE1)
unchanged, the pair(
W W1, 2)
increases in magnitude from smallto large with the ratio 2 2 1
1 10 E E S S W W λ −
= fixed. As a result, the factor 2
1 1 1 W W η η + +
varies from 1 at low
(
SE1,SE2)
to( )
2 1 W O W η η =
at high
(
SE1,SE2)
.(
)
(
)
1 2 1 2 50 2 2 1 50 11, , moderately below ID
1
1 , , moderately above ID
E E
E E
S S
W
W
W S S
W η η η + ≈ + (53)
With the result of (53), we write the immunity factor as
(
)
( )(
)
(
)
2 1 1 2 1 2 2 1 1 2 1 50 501 10 , , moderately below ID
,
1 10 , , moderately above ID
E E
E E
S S
E E
E E S S
E E S S S S S S η λ λ η φ η − − − − ≈ −
Conclusion for Regime 2: The immunity caused by the preceding dose on the subsequent dose of moderately lower SELA value, is large and approaches 100%.
We numerically demonstrate the asymptotic behaviors of regime 1 and regime 2. In Figure 6, we plot the immunity factor
φ
(
SE1,SE2)
vs(
SE2−SE1)
and theDOI: 10.4236/health.2017.913132 1837 Health
Figure 6. Immunity factor caused by preceding dose SE1 on subsequent dose SE2. Plot of φ
(
SE1,SE2)
vs(
SE2−SE1)
at SE1=160 dBA , and asymptotic approximations respectively for low(
SE2−SE1)
and for high(
SE2−SE1)
. The parameters used are3.44
λ= , α=0.1, ID50=170 dBA from [6].
From Figure 6, it is clear that the two asymptotic approximations are already very accurate even at SE2−SE1= ±4 dBA. Although only the plot at
1 160 dBA
E
S = is shown, we observe that the plot of
φ
(
SE1,SE2)
vs(
SE2−SE1)
is almost invariant with respect to SE1; plots with different valuesof SE1 virtually coincide with each other (not shown in Figure 6). To see the
invariance with respect to SE1, in Figure 7 we plot
φ
(
SE1,SE2)
vs SE1 res-pectively at several fixed values of
(
SE2−SE1)
. Figure 7 confirms that(
SE1,SE2)
φ
is virtually independent of1
E
S provided that
2
E
S is varied along
with SE1 to make the difference
(
SE2−SE1)
fixed. This observationcorresponds to the result we obtain in Regime 3 below. Regime 3: The two doses are close to each other.
( )
(
)
2 1 log 1
E E
S −S = O
which is equivalent to 1
( )
2
1
W O
W = .
We start with the expression of the immunity factor φ given in (49) as a function of 1
2
W
W and W2. In Regimes 1 and 2, we see that when the ratio
1
2
W W is varied from small (Regime 1) to large (Regime 2), the immunity factor changes dramatically from
φ
≈0 toφ
≈100%. When 12
W
W is fixed (Regime 3), however, the immunity factor φ varies much slower with respect to W2. Now
we prove that when the ratio 1
2
W
DOI: 10.4236/health.2017.913132 1838 Health
Figure 7. Immunity factor caused by preceding dose SE1 on subsequent dose SE2. Plot of φ
(
SE1,SE2)
vs SE1 at several fixed values of(
SE2−SE1)
. While φ(
SE1,SE2)
varies widely from 0 to 1 with(
SE2−SE1)
, it is virtually independent of SE1. The parameters used are λ=3.44, α=0.1, ID50=170 dBA from [6].To facilitate the mathematical analysis, let us introduce variables
1
2 2
,
W
r u W
W
η
≡ ≡
The immunity factor as a function of
( )
r u, has the expression(
)
(
)
(
)
1 1 1
1 1
r u r
u r
η η
η
φ= + + − +
+ + (54)
Taking the derivative of
φ
with respect to u, yields(
)
(
)
(
)
21 1 1
d
0
d 1 1
r r r
u u r
η η η
η
φ + − + −
= >
+ +
This tells us immediately that the immunity factor φ is an increasing function of W2. The range of φ with respect to W2 is readily obtained from
expression (54).
(
)
20 1 1
W r r
η η
φ
= = + − +(
)
2 1
W
r
r
η η
φ =∞ = +
In the case of
η
=0.15 and 12
1
W r
W
≡ = , the range
(
)
20, 2
W W
φ
=φ
=∞ is fairlytight:
2 0 2 2 0.8904
W
η
DOI: 10.4236/health.2017.913132 1839 Health
2 2 0.9013
W
η
φ −
=∞ = = (56)
Conclusion for Regime 3: The immunity caused by the preceding dose on the subsequent dose of similar magnitude (small difference measured in dBA), is significant and fairly large. The immunity factor remains almost unchanged as the two SELA values (SE1 and SE2) are varied from being significantly below
the median injury dose ID50 to being significantly above ID50 as long as the
two doses are varied together with the difference SE1−SE2 fixed.
With the expression of
φ
in terms of 12
W r
W
≡ and u≡W2η given in (54),
we continue to explore the immunity factor φ as a function of r while u is fixed.
Regime 4: Instead of focusing on a small parameter region that gives a particular asymptotic value of the immunity factor, here we consider the trend behavior of the immunity factor when the first dose (SE1) is varied from low to
high while the second dose (SE2) is fixed.
Differentiating (54) with respect to r, we get
(
)
(
)
(
)
(
)
1 1
1 1
2
1 1
d 1
d 1 1
r r ur r
u
r u r
η η
η η
η
φ η − − + − + − + −
= +
+ +
(57)
Since parameter η is less than 1, we have
η
− <1 0, and it follows that(
)
11
1 0
rη− − +rη− > holds for all positive r. Applying this result to the numerator
of (57) gives us
d
0, for 0 and 0
dr r u
φ
> > > (58)
The range of φ with respect to 1 2
W r
W
= is calculated from (54).
0 0 r
φ
= =1
r φ =∞=
Therefore, we conclude that when W2 is fixed, the immunity factor φ
increases monotonically with respect to W1. Below, we recast this statement in
terms of the SELA values of the two events.
Conclusion for Regime 4: The immunity caused by the preceding dose on the subsequent dose increases monotonically with respect to the first dose while the second dose is fixed. It goes from near 0 when the first dose is significntly below the second dose, to near 100% when the first dose is raised to above the second dose.
We numerically visualize the trend behavior predicted in Regime 4. In Figure 8, we plot the immunity factor
φ
(
SE1,SE2)
as a function of the first dose SE1while the second dose SE2 is fixed. Figure 8 shows that
φ
(
SE1,SE2)
is alwaysan increasing function of SE1; for SE1 significantly below SE2,
φ
(
SE1,SE2)
isnear zero; as SE1 approaches and goes above SE2,
φ
(
SE1,SE2)
climbs to itsDOI: 10.4236/health.2017.913132 1840 Health
Figure 8. Immunity factor caused by preceding dose SE1 on subsequent dose SE2. Plot of φ
(
SE1,SE2)
vs SE1 at several fixed values of SE2. The parameters used are3.44
λ= , α=0.1, ID50=170 dBA from [6].
6. Concluding Remarks
DOI: 10.4236/health.2017.913132 1841 Health
value for the case of independent events is asymptotically a linear function of N
for large N. In comparison, the empirical dose combination rule is a linear function of log10
( )
N , much smaller than that for independent events.We also studied the effect of immunity quantitatively via the immunity factor defined as the percentage of decrease in the injury probability attributed to the sound exposure in the preceding event. Our main results on immunity are: 1) the immunity factor is primarily a function of the difference in SELA value between the two sound exposure events; it is virtually independent of the magnitude of the two SELA values as long as the difference between the two is fixed; 2) the immunity factor increases monotonically with respect to the difference in SELA values; 3) when the first dose (SELA) is significantly below the second dose, the immunity factor is close to 0; 4) when the two doses are comparable, the immunity factor is fairly large, approaching 100%; 5) when the first dose is moderately above the second dose, the immunity factor is close to 100%.
Our extended empirical dose-response formulation provides the theoretical foundation for assessing the injury risk in realistic situations where the sound exposure consists of multiple heterogeneous noise impulses with non-uniform SELA values. Future sound exposure experiments are needed for testing, validating and refining the extended empirical dose-response formulation.
Disclaimer
The authors would like to thank Joint Non-Lethal Weapons Directorate of US Department of Defense for supporting this work. The views expressed in this document are those of the authors and do not reflect the official policy or position of the Department of Defense or the US Government.
References
[1] Hearing Loss Association of America. Types, Causes and Treatment.
http://www.hearingloss.org/content/types-causes-and-treatment
[2] United States Government Accountability (2011) GAO-11-114: Hearing Loss Pre-vention: Improvements to DOD Hearing Conservation Programs Could Lead to Better Outcomes. Report to Congressional Committees, Washington DC.
[3] US Department of Veterans Affairs, Office of Research & Development. VA Re-search on Hearing Loss. http://www.research.va.gov/topics/hearing.cfm
[4] Yankaskas, K. (2013) Prelude: Noise-Induced Tinnitus and Hearing Loss in the Mil-itary. Hearing Research, 295, 3-8.https://doi.org/10.1016/j.heares.2012.04.016
[5] Cho, S.I., Gao, S.S., Xia, A., Wang, R., Salles, F.T., et al. (2013) Mechanisms of Hearing Loss after Blast Injury to the Ear. PLoS ONE, 8, e67618.
https://doi.org/10.1371/journal.pone.0067618
[6] Chan, P., Ho, K. and Ryan, A.F. (2016) Impulse Noise Injury Model. Military Medi-cine, 181, 59-69.https://doi.org/10.7205/MILMED-D-15-00139
DOI: 10.4236/health.2017.913132 1842 Health Noise. Auditory Research Laboratory, State University of New York at Plattsburgh, Fort Detrick. http://www.dtic.mil/cgi-bin/GetTRDoc?AD=ADA393522
[8] Weightman, F.L., Flamme, G., Campenella, A.J. and Luz, G.A. (2010) American In-stitute of Biological Sciences Peer Review of Injury Prevention and Reduction Re-search Task Area-Impulse Noise Injury Models.
http://www.arl.army.mil/www/pages/343/AHAAH_AIBS_revew_Public_Release_11 Aug14.pdf
[9] Chan, P.C., Ho, K.H., Kan, K.K., Stuhmiller, J.H. and Mayorga, M.A. (2001) Evalua-tion of Impulse Noise Criteria using Human Volunteer Data. The Journal of the Acoustical Society of America, 10, 1967-1975.https://doi.org/10.1121/1.1391243
[10] Johnson, D.L. (1998) Blast Overpressure Studies. Technical Report USAARL-CR- 98-03. U.S. Army Aeromedical Research Laboratory, Fort Rucker.
http://www.dtic.mil/cgi-bin/GetTRDoc?AD=ADA347634
Appendix
Here we give a proof of Theorem 1 appeared in Section 3.
For
( )
1ln 10
αλ
η≡ < , we have
(
η− <1)
0. Consider function( )
E1(
E1)
g w =Wη +wη− W +wη It satisfies
( )
0 0g =
( )
(
1)
11
0 for all 0
E
g w′ =ηwη− − W +wη−> w>
It follows that g w
( )
>0 for all w>0. Or, equivalently,(
)
(
)
1 2 1 2 0 for all 2 0 and 1 0
E E E E E E
Wη +Wη − W +W η > W > W >
From this, we see that
(
)
1 2 1 2 1 2 0 for all 1 0 and 2 0
E E E E E E E E
Wη +Wη − W +W η+W Wη η > W > W >
![Figure 1 shows the dose-response relations for PTS cut-off levels ranging from 5 dB to 60 dB, based on parameter values from [6]](https://thumb-us.123doks.com/thumbv2/123dok_us/36945.503561/4.595.272.477.459.627/figure-shows-response-relations-levels-ranging-parameter-values.webp)
![Figure 2. Comparison of the dose combination rule in [6] and the case of independent events](https://thumb-us.123doks.com/thumbv2/123dok_us/36945.503561/10.595.252.497.464.663/figure-comparison-dose-combination-rule-case-independent-events.webp)