1 Bachelorscriptie
Confronting and Constructing Concept Maps
Manon Langendoen s1254758
Januari 2014
Universiteit Twente
Faculteit der Gedragswetenschappen Opleiding Psychologie
2 Index
Abstract (English) ... 4
Abstract (Dutch) ... 5
Introduction ... 6
Methods ... 9
Participants ... 9
Materials ... 9
Procedure ... 12
Data analysis ... 14
Results ... 16
Differences in and between conditions: multiple choice tests ... 16
Differences in and between conditions: open question test ... 16
Collaboratively constructed concept maps ... 17
Talk ... 18
Influences of concept maps and talk on learning gain ... 18
Conclusion and discussion ... 19
Acknowledgements ... 21
Resources ... 22
Appendices ... 24
Appendix I – Informative text on photosynthesis (in Dutch) ... 24
Appendix II – Step-by-step concept map with explanation (in Dutch) on photosynthesis . 25 Appendix III – Informative text on the greenhouse-effect (in Dutch) ... 27
Appendix IV – Multiple choice questions of the pre-test (in Dutch) ... 29
Appendix V – Coding scheme of the multiple choice questions of the pre-test (in Dutch) 33 Appendix VI – Multiple choice questions of the mid-test (in Dutch) ... 34
Appendix VII – Coding scheme of the multiple choice questions of the mid-test (in Dutch) ... 38
Appendix VIII – Multiple choice questions of the post-test (in Dutch) ... 39
3
Appendix X – Open question test (in Dutch) ... 44
Appendix XI – Coding scheme of the open question test (in Dutch) ... 46
Appendix XII – Coding scheme of the concepts map (in Dutch) ... 52
Appendix XIII – Coding scheme of the dialogues (in Dutch) ... 54
4 Abstract (English)
This study investigated whether the individual learning gain of fifth year pre-university track students was positively influenced by the opportunity to inspect their collaborative partners’ individually constructed concept map. It was also investigated whether the quality of the collaboratively constructed concept maps and the quality of the dialogue were positively influenced by the opportunity to inspect their collaborative partners’ individually constructed concept map. This quasi-experimental field study included a total of sixty-eight pre-university track students from three different classes who worked collaboratively on constructing a concept map, after first having constructed an individual concept map. The instructional goal was to construct a collaborative concept map, that completely explained the greenhouse effect. Individual learning gains were measured with the help of a pre-test, mid-test and post-test. Students were divided over two conditions. Students in one condition did get the opportunity to inspect their collaborative partners’ individually constructed concept map,
while students in the other condition did not get this opportunity. The opportunity to inspect their collaborative partner’s individually constructed concept map was expected to be an
5 Abstract (Dutch)
Deze studie heeft onderzocht of de individuele leerwinst van leerlingen uit het vijfde jaar VWO positief werd beïnvloed door de mogelijkheid om de individueel geconstrueerde concept map van de samenwerkende partner te inspecteren. Er is ook onderzocht of de kwaliteit van de gezamenlijk geconstrueerde concept map en de kwaliteit van de dialoog positief beïnvloed werden door de mogelijkheid om de individueel geconstrueerde concept map van de samenwerkende partner te inspecteren. Aan dit quasi-experiment namen in totaal achtenzestig VWO leerlingen uit drie verschillende klassen deel die samenwerkend een concept map hebben geconstrueerd, nadat ze eerst een individuele concept map hebben geconstrueerd. De voorgelegde opdracht was het construeren van een gezamenlijke concept map, die volledig het broeikaseffect uitlegde. De individuele leerwinst is gemeten met behulp van een pre-test, mid-test en post-test. De leerlingen zijn verdeeld over twee condities. Leerlingen in een conditie kregen de mogelijkheid om de individueel geconstrueerde concept map van hun samenwerkende partner te inspecteren, terwijl leerlingen in de andere conditie deze mogelijkheid niet kregen. Er werd gedacht dat de mogelijkheid om de individueel geconstrueerde concept map van hun samenwerkende partner te inspecteren een extra kennisbron zou zijn. In tegenstelling tot onze verwachtingen, lieten resultaten zien dat de mogelijkheid om de individueel geconstrueerde concept map van de samenwerkende partner te inspecteren geen positief effect had op de individuele leerwinst van de leerlingen.
6 Introduction
Summarising an information source is a popular way for students to obtain knowledge on the learning domain. Research has shown that it is also an effective way to achieve cognitive learning outcomes (Anderson & Thiede, 2008; Gajria, Jitendra, Sood & Sacks, 2007). An alternative for writing a conventional summery, is making a concept map. A concept map is a diagram in which a network of concept nodes connected by relational links is shown (Novak & Cañas, 2006; Haugwitz, Nesbit & Sandmann, 2010). The concepts are usually enclosed by circles or boxes and words on the relational links specify the relationship between two concepts (Novak & Cañas, 2006).
While making a concept map, the reproduction of facts and lists is not enough (Roth & Roychoudhury, 1992). Students have to construct a two-dimensional visual representation of the concepts and their relationships. By doing so, students are not simply externalizing their prior knowledge or newly obtained knowledge, they are also trying to organize their knowledge in a logical manner (Roth & Roychoudhury, 1992). This makes it easier for them to understand the learning concept and relationships with other concepts.
Collaborative concept mapping
Positive effects of collaborative learning on achievements have been found in many different studies (Slavin, 1988; Lou, Abrami & d’Apollonia, 2001) . According to Mullins, Rummel & Spada (2011) there are various explanations for these positive effects. For one thing, students have to make their thinking explicit and verbalize their knowledge in order to explain their thoughts to their partner. In order to do this, they often have to reformulate and clarify their own understanding. By doing so, students restructure their own knowledge base. In addition, learning can be promoted by joined elaboration that is facilitated by the collaborative setting and finally, by asking for help and receiving explanation from their partner, students obtain knowledge of the learning concept.
The majority of the concept mapping studies focus on individual learning, but concept mapping as a collaborative activity also has positive potential on individual learning gains (Van Boxtel, Van der Linden, Roelofs & Erkens, 2002). Concept mapping, as well as collaborative learning, are active approaches towards learning.
In a collaborative task, students are confronted with the knowledge of their
collaborative partner on the domain at hand (Van Dijk, Gijlers & Weinberger, in press; Van Dijk & Lazonder, 2013). When working on a concept map, this knowledge is made explicit, especially when students get the chance to prepare individually. When confronted with their partners’ individually prepared concept map, students can think about their partners’
7 However, there is not always a positive effect of collaborative learning when
compared to individual learning (Mullins et al., 2011). Researchers list various reasons why collaborative learning activities may have no or a negative effect on learning outcomes. To start, unequal participation is a problem that often arises when students are involved in collaborative learning activities (Strijbos & Weinberger, 2010). For example, one learner is the ‘typist’ while the other is the ‘thinker’. This problem can be reduced or avoided when
students get a chance to prepare individually. This way, their knowledgebase is about equal when they start the collaborative activity because they have been given a chance to prepare the main task.
Another problem that may arise when students participate in collaborative learning activities, is that collaboration involves lots of activities that have little to do with the content of the learning task but more with the management of the collaborative learning activity like monitoring group progress, monitoring of individual understanding and maintaining a healthy working atmosphere. Gijlers, Saab, Van Joolingen, De Jong & Van Hout-Wolters (2008) argue that collaborative inquiry learning requires maintaining a mutual understanding of the task, along with reaching consensus on strategies, plans and domain knowledge. In addition, the need for coordinative activities is increased in collaborative settings (Erkens, Jaspers, Prangsma & Kanselaar, 2005). The time needed for coordination cannot be spent on the task content and this may lead to students not reaching their full potential while participating in collaborative learning.
The third problem that may arise when students participate in collaborative learning activities is a lack of depth in the dialogue. A lot of time is spent on low-level verbalization when students merely talk about what they have done instead of discussing the learning domain at hand in depth (Van der Meij, Alberts & Leemkuil, 2011) and this way, students do not reach full potential of the collaborative activity.
In order to avoid or resolve the problems listed above, the structure of the task is important. Based on the given instruction they receive, students should be able to give
structure to the task and talk in depth about the domain at hand, because the mere exchange of facts is not enough (Roth & Roychoudhury, 1992). Shared representation seems to create more depth in dialogues between students. Also, collaborative concept mapping invites a student to discuss structure of their domain knowledge with their peers (Roth &
Roychoudhury, 1992).
Research questions
8 press). Also, individual preparation increases students’ questioning behaviour when starting their collaborative activity. When preparing individually, students get a chance to form their own ideas about the learning concept and then bring that into the dialogue with their partner. This way, they are likely to stand stronger in the dialogue. Thus, individual preparation can have positive effects on talk (the quality of the dialogue) and the quality of the concept maps.
The present study compares two groups of students that collaboratively construct a concept map based on a scientific topic, the greenhouse effect. In both conditions, students prepare an individual concept map on the topic before starting the collaborative activities. Students in the experimental group (EXP-condition) receive a copy of their partners’ concept map. This way, they can inspect to what extent their own domain related ideas, which are reflected in their own concept map, overlap with their partners’ ideas. After having done so,
they will collaboratively construct a new concept map. Students in the control group (CON-condition) do not get access to the concept map that is constructed by their partner, but will also collaboratively construct a new concept map.
In this study, the following research question is answered: ‘To what extent will students’ learning gains be positively influenced by the opportunity to inspect their collaborative partners’ concept map?’
The individual learning gains are based on the different scores on a pre-, mid- and post-test. To understand why the learning gains may be higher for one of the two conditions, two sub-questions have to be answered. The first sub-question is: ‘To what extent will the quality of the collaborative concept maps be positively influenced by the opportunity to inspect their collaborative partners’ concept map?’ The quality of the concept maps can be
decided by giving points for certain named concepts and links between different concepts. The second sub-questions is: ‘To what extent will the quality of the dialogue in be positively influenced by the opportunity to inspect their collaborative partners’ concept map?’ The quality of the dialogue can be decided by what students discuss while making a concept map. According to van Boxtel et al., (2002) the quality of the student interaction is related to the individual learning gains. The individual learning gains will be higher when the talk is more about the concept that is to be studied and more elaborative.
9 Methods
Participants
Sixty-eight students participated in this study; 38 males (Mage = 199.16 months, SDage = 5.72) and 30 females (Mage = 199.37 months, SDage = 4.90). All students came from the same high school and were fifth year pre-university track students from three different classes. The students had different learning profiles: NG/NT (N = 32) or EM/CM (N = 36). NG/NT profiles contain more scientific courses, like chemistry and physics, while EM/CM profiles contain more social courses like economics and history. Both profiles, however, contain mathematics and ANW (general natural sciences) courses. Students from both profiles therefore were able to read scientific texts. Based on the content of the curriculum it was concluded that students had some, but no extended, prior knowledge on the topic of the greenhouse effect and why this topic is an addition to their curriculum. In order to equally divide the students with different profiles over the two conditions, they were categorized in advance to one of the two conditions.
During the collaborative part of the lesson, students were divided into dyads. Each student with a NG/NT profile collaborated with another student with a NG/NT profile and each student with an EM/CM profile collaborated with another student with an EM/CM profile. In both conditions were 16 students with a NG/NT profile (8 couples) and in both conditions were 18 students with an EM/CM profile (9 couples).
Before the research was conducted at the school, a passive consent was asked from the parents of the participating students. Before starting the collaborative part of the lesson, the students had to be divided into dyads. In order to avoid a lot of arousal, the researcher made dyads upfront. The dyads were discussed with the class’ teacher in order to avoid that dyads consisting of students who do not get along were constructed by the researcher.
Materials
Domain and task
The domain that was used in this study, is the greenhouse effect. Students had to process the domain in a concept map. Students were instructed by the researcher about the domain and about how they had to construct a concept map and the lesson was pen and paper based.
Informative text on photosynthesis and step-by-step concept map
10 adjusted to the level of the pre-university track students, as it was only used to explain how they had to construct a concept map. The text is included (in Dutch) in appendix I. The step-by-step concept map, with explanation (in Dutch), that was used as an example with this text, is included in appendix II. It was used to explain what had to be included in a concept map and what was the best way to construct a concept map.
Informative text on the greenhouse effect
The informative text that was handed out to the students during the lesson was about the greenhouse effect. This text was based on several scientific resources, such as websites (“Klimaatverandering,” 2013; “Wat is het broeikaseffect?,” 2013; “Aërosolen,” 2013). The text described the difference between the normal and the enlarged greenhouse effect and also why the enlarged greenhouse effect is such a big problem. Important concepts included in the text were carbon dioxide, which stimulates the enlarged greenhouse effect, and aërosolen, which compromise the enlarged greenhouse effect. In order to make sure the text was clear and not too difficult for the students, a pilot test was completed. Based on this pilot test, several things were changed to clarify the greenhouse effect. For example, the part aërosolen seemed to be unclear and confusing so it was explained in a different way. The informative text on the greenhouse effect (in Dutch) is included in appendix III.
Tests
During the lesson, the students had to make two different tests: a multiple choice test and an open question test. The tests were used to identify their knowledge on the greenhouse effect prior to the lesson and to see what they had learned during the individual and collaborative part of the lesson.
In order to make sure the tests weren’t too difficult for the students and were
answerable after they had read the text, a pilot test was completed. Based on this pilot test, several multiple-choice questions and several open questions were changed to make them more clear for the students.
A simple reliability analysis says little about the reliability of the multiple choice test and open question test because the knowledge on different sub-domains is measured in these tests. In addition, the open question test contains different types of questions.
Multiple choice test
11 Figure 1. Example of a multiple choice question. The right answer is bold.
This test was conducted three times during the lesson and the questions were
rearranged each time. Because the multiple choice questions were rearranged each time, there were three versions of the multiple choice test. Using this test, the knowledge of the students on the greenhouse effect was tested before they participated in the lesson (pre-knowledge, during the pre-test). It was also used to test what the students had learned from their
individual concept map (during the mid-test) and what they had eventually learned at the end of the lesson (during the post-test).
During the pre-test, only this test was used because it was assumed that it would be easier for students to recognize a right answer rather than having to produce an answer without even having read the text. Being asked to produce five answers to questions on a topic they know little about (the open question test), is assumed to be discouraging. Using only the multiple choice test was a way to reduce discouragement. The multiple choice questions of the pre-test are included in appendix IV. The multiple choice questions of the mid-test are included in appendix VI. The multiple choice questions of the post-test are included in appendix VIII.
Open question test
The open question test consisted of two types of questions. With the first four questions, the students were expected to answer in text. An example is provided in figure 2. The last question asked them to make a drawing that illustrated the enlarged greenhouse effect. This question is provided in figure 3.
12 Figure 3. Question 5 of the open question test.
The questions were used to test the knowledge students gained after the individual part (during the mid-test) and again after the collaborative part (during the post-test). It shows what students still know and are able to reproduce after reading the text and making the concept maps. The open question test (in Dutch) is included in appendix X.
Procedure
Introduction and practicing with making a concept map on photosynthesis (15 minutes) The lesson started with a brief introduction in which the researcher introduced herself, explained why she was in the students’ class and told the students what was going to happen
during the lesson.
After the introduction, the students were handed out an informative text on the topic of photosynthesis. They got a chance to read the text quickly and after that, there was a step-by-step explanation on how to construct a concept map based on an informative text on a scientific topic.
Pre-test on the greenhouse-effect and reading the text on the greenhouse-effect (16 minutes) Subsequently, the students completed the pre-test on the greenhouse effect in ten minutes. The researcher explained that students had little knowledge about the topic and that the test therefore could be experienced as difficult.
After students finished the pre-test, they were given five minutes to read the informative text on the greenhouse effect.
Making an individual concept map and the mid-test on the greenhouse-effect (31 minutes) After the students had finished reading the informative text, they were given ten minutes to construct an individual concept map the same way they had learned at the beginning of the lesson. During the last 2 minutes, the informative text was handed out again and students were given the chance to add some final concepts or change some links.
13 the researcher would give a sign which mend it was wise to start the open question part, because otherwise they may not be able to finish that in time.
Making a collaborative concept map (15 minutes)
After finishing the mid-test, the dyads set down at the tables they were assigned to and the recording devices were handed out. Because there weren’t enough recording devices, students
were asked to use their personal mobile devices as recording device and sent the recordings to the researcher after the lesson.
At this point, there became a difference in the two conditions: students in the EXP-condition were handed out their own individual concept maps and they were told that they could use this during the collaborative part of the lesson. Students in the CON-condition were not handed out their own individual concept maps. Students in both conditions were given ten minutes to construct the collaborative concept map.
Post-test on the greenhouse-effect and thank (23 minutes)
Finally, the students completed the post-test on the greenhouse effect in twenty minutes. They were told to start with the multiple choice questions and after seven minutes, the researcher would give a sign which mend it was wise to start the open question part, because otherwise they may not be able to finish that in time.
14 Data analysis
Coding scheme multiple choice test
In order to score the questions, a coding scheme for the multiple choice test was developed. The scoring procedure is quite simple for this test: one point for every right answered question and zero points for a wrong answered question. Because the multiple choice questions were rearranged each time, there were three versions of the coding scheme of the multiple choice test. The coding scheme of the multiple choice questions of the pre-test is included in appendix V. The coding scheme of the multiple choice questions of the mid-test is included in appendix VII. The coding scheme of the multiple choice questions of the post-test is included in appendix IX.
Coding scheme open question test
In order to score the questions, a coding scheme for the open question test was developed as well. The amount of points that could be earned for each question depended on the amount of concepts or processes that had to be included in the answer. The more difficult the question, the more concepts or processes had to be included in the answer and the more points could get earned. The coding scheme for the open question test (in Dutch) is included in appendix XI.
In order to calculate the interrater reliability, a pilot of ten tests was completed. This gave a Cohen’s Kappa of 0.89. This value is seen as very reliable.
Coding scheme concept map
In order to score the concept maps, a coding scheme was developed. Students could get points for the amount of concepts represented in the concept map as well as correctly linked
concepts, which indicated the quality of the concept map. Each named concept was given ½ or 1 point, depending on the accuracy of the concept. Also, each correct link was given ½ or 1 point, depending on the accuracy of the link. The coding scheme for the concept maps (in Dutch) is included in appendix XII.
In order to calculate the interrater reliability, a pilot of six concept maps was completed. For the amount of concepts represented in the concept map, a Cohen’s Kappa of 0.76 was found. This value is seen as reliable. For the quality of the concept map, a Cohen’s Kappa of 0.80 was found. This value is seen as very reliable.
Coding scheme dialogues
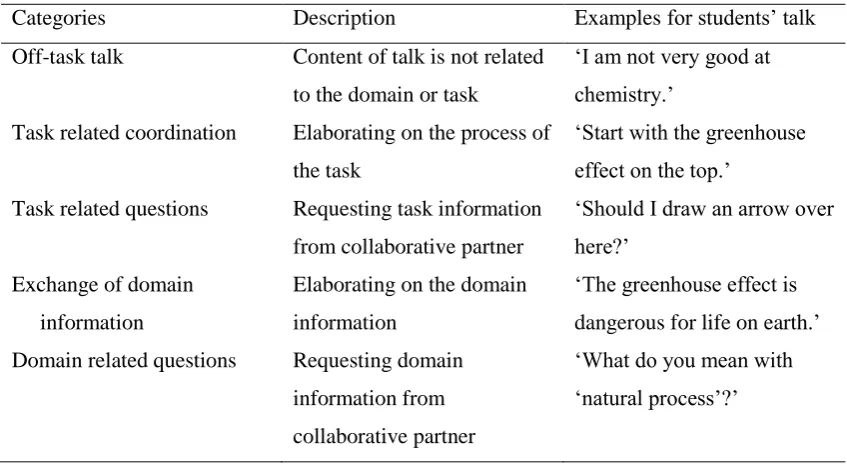
15 description and examples, is provided in table 1. The coding scheme for the dialogues (in Dutch) is included in appendix XIII.
[image:15.595.84.508.184.417.2]In order to calculate the interrater reliability, a pilot of one dialogue was completed. This gave a Cohen’s Kappa of 0.91. This value is seen as very reliable.
Table 1. Overview of the types of talk, including a description and examples.
Categories Description Examples for students’ talk
Off-task talk Content of talk is not related to the domain or task
‘I am not very good at chemistry.’
Task related coordination Elaborating on the process of the task
‘Start with the greenhouse effect on the top.’
Task related questions Requesting task information from collaborative partner
‘Should I draw an arrow over here?’
Exchange of domain information
Elaborating on the domain information
‘The greenhouse effect is
dangerous for life on earth.’ Domain related questions Requesting domain
information from collaborative partner
16 Results
Differences in and between conditions: multiple choice tests
Prior to answering the research questions, it was tested whether initial differences concerning prior knowledge existed between the conditions. Results of an ANOVA indicated that there were significant differences in the pre-test scores between conditions (F (1,66) = 9.46, p = 0.00). The mean scores and standard deviations (SD) of the pre-test are included in table 2.
EXP-condition. Results indicated that there is a significant learning gain from the pre-test to
the post-test (total learning gain) for the EXP-condition (t (33) = 9.02, p = 0.00). This learning gain can be explained by the learning gain from the pre-test to the mid-test (learning gain 1), as results show this is also significant (t (33) = 9.61, p = 0.00), while there is no significant learning gain from the mid-test to the post-test (learning gain 2, t (33) = 0.14, p = 0.89). The mean scores and standard deviations of the multiple choice tests are included in table 2. The mean scores and standard deviations of the learning gains are included in table 3.
CON-condition. Results also indicated that there is a significant total learning gain for the
CON-condition (t (33) = 9.48, p = 0.00). This learning gain can also be explained by learning gain 1, as results show that this is significant (t (33) = 8.43, p = 0.00), while learning gain 2 is not significant (t (33) = 0.93, p = 0.36. The mean scores and standard deviations of the multiple choice tests are included in table 2. The mean scores and standard deviations of the learning gains are included in table 3.
Between conditions. Results of an one-way ANOVA indicated that there is no significant
difference between the total learning gain in both conditions (F (1,66) = 1.02, p = 0.32). Furthermore, no significant differences between conditions were found for learning gain 1 (F (1, 66) = 1.75, p = 0.19) and learning gain 2 (F (1,66) = 0.21, p = 0.65).
Differences in and between conditions: open question test
17 Table 2. Means and standard deviations (SD) of the results of the pre-test, multiple choice part (MC) of the mid-test and post-test and open part (Open) of the mid-test and post-test.
EXP-condition CON-condition
Mean SD Mean SD
Pre-test 4.76 1.44 5.79 1.32
Mid-test (MC) 7.59 1.31 8.09 1.24
Post-test (MC) 7.62 1.23 8.24 1.26
Mid-test (Open) 15.97 4.46 17.66 4.62
Post-test (Open) 16.79 4.72 19.63 4.91
[image:17.595.87.508.301.418.2]Note. NEXP = 34, NCON = 34.
Table 3. Means and standard deviations (SD) of the learning gains.
EXP-condition CON-condition
Mean SD Mean SD
Learning gain 1 2.82 1.71 2.29 1.59
Learning gain 2 0.03 1.19 0.15 0.93
Total learning gain 2.85 1.84 2.44 1.50
Learning gain open 0.82 3.73 1.97 4.19
Note. NEXP = 34, NCON = 34.
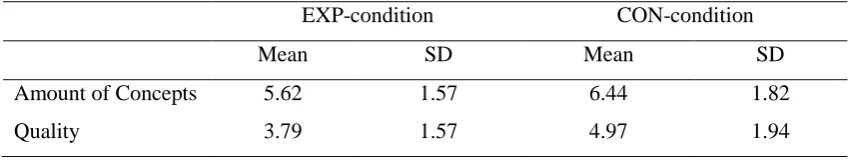
Collaboratively constructed concept maps
With respect to the concept maps constructed by the students we made a distinction between the amount of concepts represented in the concept map and the overall quality of each map (detailed description is provided in appendix XII) . Results of an ANOVA revealed a
significant difference between the two conditions for the amount of concepts (F (1,66) = 4.00, p = 0.05) as well as the quality of the concept maps (F (1,66) = 7.56, p = 0.01) .The means
and standard deviations are included in table 4.
Table 4. Means and standard deviations (SD) of the quality of and the amount of concepts in the collaboratively constructed concept maps.
EXP-condition CON-condition
Mean SD Mean SD
Amount of Concepts 5.62 1.57 6.44 1.82
Quality 3.79 1.57 4.97 1.94
[image:17.595.83.508.662.742.2]18 Talk
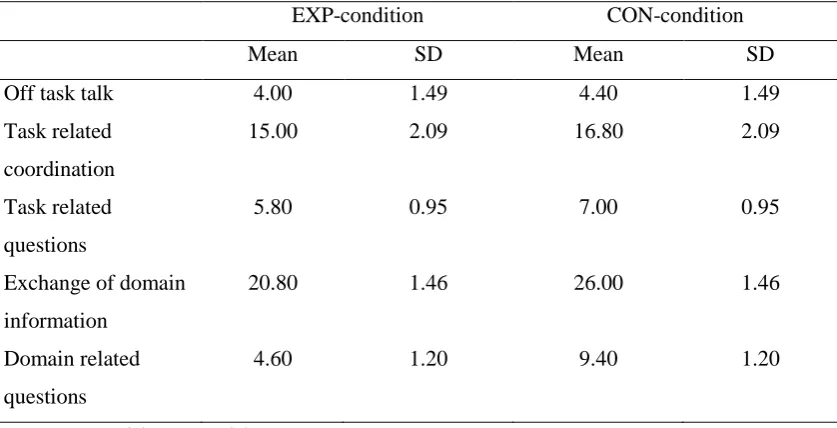
Results of a multivariate analyses with the different talk categories as dependent variables revealed no significant differences between the conditions for the dialogues. Using Wilks’ statistics, the analysis showed no significant effects ( = 0.51, F (5,14) = 2.67, p = 0.07).
However, these results indicate a trend, so a follow up analysis was performed. The results of this analysis showed no significant difference between the conditions for ‘off-task talk’ (F (1,18) = 0.04, p = 0.85), ‘task related coordination’ (F (1,18) = 0.37, p = 0.55) and ‘task related questions’ (F (1,18) = 0.80, p = 0.38). A significant difference between conditions was found for ‘exchange of domain information’ (F (1,18) = 6.31, p = 0.02) and for ‘domain related questions’ (F (1,18) = 7.95, p = 0.01). The means and standard deviations are
[image:18.595.88.507.352.566.2]included in table 5.
Table 5. Means and standard deviations (SD) of the ‘exchange of domain information’ and ‘domain related questions’.
EXP-condition CON-condition
Mean SD Mean SD
Off task talk 4.00 1.49 4.40 1.49
Task related coordination
15.00 2.09 16.80 2.09
Task related questions
5.80 0.95 7.00 0.95
Exchange of domain information
20.80 1.46 26.00 1.46
Domain related questions
4.60 1.20 9.40 1.20
Note. NEXP = 34, NCON = 34.
Influences of concept maps and talk on learning gain
19 Conclusion and discussion
The main goal of the present study was to investigate whether students who had access to their own and their partners’ individually constructed concept map, while collaboratively
constructing a new concept map, had a higher individual learning gain than students who did not have access to the individually constructed concept maps. In order to do this, students were divided in two conditions: a condition in which students did have access to the
individually constructed concept maps, and a condition in which students did not have access to the individually constructed concept maps. The individual learning gains were tested with the help of a pre-test, that consisted of multiple choice questions, a mid-test, that consisted of multiple choice and open questions and a post-test that consisted of multiple choice and open questions.
The main research question of the present study was ‘To what extent will students’ learning gains be positively influenced by the opportunity to inspect their collaborative partners’ concept map?’ In order to answer the main research question, the results of the
multiple choice questions and the open questions were separately evaluated. Students showed a significant total learning gain for the multiple choice questions. This was however only obtainable during the first part of the learning session and no significant difference between the conditions was found. Students in de EXP-condition showed no significant learning gain for the open questions, while students in the CON-condition did show a significant learning gain. However, when compared to each other, no significant difference in learning gain open between the conditions was found. To answer the research question: students’ learning gains on the multiple choice as well as the open question test, are not positively influenced by the opportunity to inspect their collaborative partners’ concept map when multiple choice questions were answered.
In order to answer the first sub-question ‘To what extent will the quality of the collaborative concept maps be positively influenced by the opportunity to inspect their collaborative partners’ concept map?’ the amount of concepts that were used in the
collaboratively constructed concept map was evaluated, as well as the quality of the concept map. Students in the two conditions showed significant difference for the amount of concepts used, as well as the quality of the concept map. Contrary to our expectations, it seems that the CON-condition has higher amount of concepts used, as well as higher quality concept maps. Based on these findings, it can be concluded that the quality of the collaborative concept maps are not positively influenced by the opportunity to inspect their partners’ concept map.
In order to answer the second sub-question ‘To what extent will the quality of the dialogue be positively influenced by the opportunity to inspect their collaborative partners’ concept map?’ the quality of the dialogue of the students was evaluated. Students in the two
20 was suggested by the results and further inspections showed an advantage for the CON-condition. Based on these findings it can be concluded that the quality of the dialogue is not positively influenced by the opportunity to inspect their partners’ concept map.
Students in the CON-condition scored significantly higher on the collaborative concept map for the amount of concepts, as well as the quality of the concept map. Based on the research of van Boxtel et al., (2002) this was not expected, but it may be explained by the fact that students in the EXP-condition were confused by the high amount of information at one time. This can also be called cognitive overload (Peters, Klein, Kaufman, Meilleur & Dixon, 2013). In addition, the quality of the dialogue was not very high for either of the conditions, which may explain the low quality of the concept maps. However, this link is an informal observation and should be further investigated in future research.
Students in the CON-condition seemed to spend more time on discussing the domain at hand, while students in the EXP-condition seemed to spend a lot of time in finding
differences in their two concept maps, without actually discussing the domain at hand. Inspection of a number of interaction protocols suggested that with respect to the domain and task related talk students merely exchanged low-level verbalization. These low-level
verbalizations do not contribute to a high quality dialogue or improved learning outcomes (Van der Meij et al., 2011). As time is limited, the amount of time students invested in low level verbalization was not available for other learning processes like concept mapping and domain related talk. The fact that comparing the concept maps seemed to trigger low level verbalizations may explain the low individual learning gains. It must be taken into account that the coding scheme on the quality of the dialogue used in this study is not sensitive enough to clarify the differences between types of verbalizations. Future research or a more detailed analyses of the interaction protocols of the present study could explore the role of low level interaction.
The interactions between students showed that they did not use the individually constructed concept maps in the way we had hoped they would, based on the research of Van Dijk et al., (in press), where students discussed the drawings of their collaborative partner. However, in the research of Van Dijk et al., (in press) the task was divided into two sub-tasks: first, the students were instructed to inspect and compare their collaborative partners’
drawing and after that, they were instructed to discuss the domain at hand. In this study, students did not get these specific instructions and it seemed that students in the
21 that their performance on the task did not affect their school grades, this might have
negatively affected their motivation. Future research could focus on the type of instruction given to children or students in different stages of development.
Acknowledgements
22 Resources
Aërosolen (2013). Retrieved September 16, 2013, from http://www.knmi.nl/cms/ content/37805/aerosolen.
Anderson, M.C.M., & Thiede, K.W. (2008). Why do delayed summaries improve metacomprehension accuracy? Acta Psychologica, 128, 110–118. doi: 10.1016/j.actpsy.2007.10.006.
Erkens, G., Jaspers, J., Prangsma, M., & Kanselaar, G. (2005). Coordination processes in computer supported collaborative writing. Computers in Human Behavior, 21, 463–486. doi: 10.1016/j.chb.2004.10.038.
Gajria, M., Jitendra, A.K., Sood, S., & Sacks, G. (2007). Improving comprehension of expository text in students with LD: A research synthesis. Journal of Learning Disabilities, 40, 210–225.
Gijlers, H., Saab, N., Van Joolingen, W.R., De Jong, T., & Van Hout-Wolters, B.H.A.M. (2009). Interaction between tool and talk: how instruction and tools support consensus building in collaborative inquiry-learning environments. Journal of Computer Assisted Learning, 25, 252–267. doi: 10.1111/j.1365-2729.2008.00302.x.
Haugwitz, M., Nesbit, J.C., & Sandmann, A. (2010). Cognitive ability and the instructional efficacy of collaborative concept mapping. Learning and Individual Differences, 20, 536–543. doi: 10.1016/j.lindif.2010.04.004.
Janssen, J., Erkens, G., & Kanselaar, G. (2007). Visualization of agreement and discussion process during computer-supported collaborative learning. Computers in Human Behavior, 23, 1105–1125. doi:10.1016/j.chb.2006.10.005.
Klimaatverandering (2013). Retrieved September 16, 2013, from http://www.milieuloket.nl/ 9353000/1/j9vvhurbs7rzkq9/vhurdyxq5fv8.
Lou, Y., Abrami, P.C., & d’Apollonia, S. (2001). Small group and individual learning with
technology: A meta-analysis. Review of Educational Research, 71, 449–521. doi: 10.3102/00346543071003449.
Mullins, D., Rummel, N., & Spada, H. (2011). Are two heads always better than one? Differential effects of collaboration on students’ computer-supported learning in
mathematics. Computer-Supported Collaborative Learning, 6, 421–443. doi: 10.1007/s11412-011-9122-z.
Novak, J.D., & Cañas, A.J. (2006). The theory underlining concept maps and how to construct them. Technical Report IHMC CmapTools 2006-01, Florida Institute for Human an Machine Cognition, 2006, available at:
23 Peters, E., Klein, W., Kaufman, A., Meilleur, L. & Dixon, A. (2013). More is not always better: intuitions about effective public policy can lead to unintended consequences. Social Issues and Policy Review, 7, 114 – 148. doi: 10.1111/j.1751-2409.2012.01045.x.
Roth, W.M., & Roychoudhury, A. (1992). The social construction of scientific concepts or the concept map as conscription device and tool for social thinking in high school science. Science Education, 76, 531–557.
Slavin, R.E. (1988). Cooperative Learning and Student Achievement. Educational Leadership, October 1988, 31–33.
Strijbos, J.W., & Weinberger, A. (2010). Emerging and scripted roles in computer-supported collaborative learning. Computers in Human Behavior, 26, 491–494. doi: 10.1016/j.chb.2009.08.006.
Van Boxtel, C., Van der Linden, J., & Kanselaar, G. (2000). Collaborative learning tasks and the elaboration of conceptual knowledge. Learning and instruction, 10, 311–330.
Van Boxtel, C., Van der Linden, J., Roelofs, E., & Erkens, G. (2002). Collaborative concept mapping: provoking and supporting meaningful discourse. Theory Into Practice, 41, 40– 46. doi: 10.1207/s15430421tip4101_7.
Van der Meij, H., Alberts, E., & Leemkuil, H. (2011). Learning from games: does collaboration help? British Journal of Educational Psychology, 42, 655–664. doi: 10.1111/j.1467-8535.2010.01067.x
Van Dijk, A.M., Gijlers, H., & Weinberger, A. (in press). Scripted collaborative drawing in elementary science education. Instructional Science. doi: 10.1007/s11251-013-9286-1. Van Dijk, A.M., & Lazonder, A.W. (2013). Scaffolding students’ use of learner-generated
content in a technology-enhanced inquiry learning environment. Interactive learning environments. doi: 10.1080/10494820.2013.834828.
24 Appendices
Appendix I – Informative text on photosynthesis (in Dutch)
Tekst fotosynthese
Groene planten, onmisbaar voor het leven van mens en dier! Om te overleven hebben mensen en dieren zuurstof nodig. Groene planten zorgen hiervoor in een proces dat fotosynthese wordt genoemd.
Zuurstof zit in de lucht, maar het komt daar niet vanzelf. Zuurstof wordt gemaakt door planten. Een plant is eigenlijk een zuurstoffabriek. Dit doet hij door gebruik te maken van zonlicht, water en koolstofdioxide (ook een stof in de lucht). Hierbij wordt niet alleen zuurstof aangemaakt, maar ook suiker.
25 Appendix II – Step-by-step concept map with explanation (in Dutch) on photosynthesis
Stap Concept map Uitleg
1 We zoeken het centrale
begrip van de tekst en zetten dat bovenaan het papier. In deze tekst is het centrale begrip ‘fotosynthese’. Om
dit begrip heen zet je een cirkel of een hokje om duidelijk te maken dat dit een belangrijk begrip is.
2 We gaan nu een
verbindingslijn maken. Hiermee verbinden we het begrip ‘fotosynthese’ met
een belangrijk begrip dat daarbij hoort. Op deze lijn zetten we de relatie tussen fotosynthese en het begrip. Zoals jullie in de eerste alinea van de tekst kunnen lezen, vindt fotosynthese plaats in groene planten. Daarom zetten we op deze verbindingslijn ‘vindt plaats in’. Dit is verder geen
belangrijk begrip, het geeft alleen een relatie aan. Daarom zetten we
hieromheen geen cirkel of hokje.
3 Zoals ik net al zei, staat in de
26 verbindingslijn die we net hebben gemaakt, is dan ook ‘groene planten’.
Hieromheen zetten we wel weer een cirkel of hokje omdat het een belangrijk begrip is.
4 Om duidelijk aan te geven
hoe je de concept map precies moet lezen, maken we gebruik van pijltjes.
5 We gaan nu kijken naar de
tweede alinea. Zoals jullie kunnen zien, zijn we al een aardig stuk opgeschoten. In de tweede alinea staat uitgelegd welke stoffen de groene planten gebruiken en welke worden geproduceerd. Ook hier is weer gebruik gemaakt van pijltjes om aan te geven welke richting je op moet lezen.
6 In de laatst alinea kunnen we
lezen dat de suikers
voedingstoffen zijn voor de groene planten en zuurstof eigenlijk meer een
27 Appendix III – Informative text on the greenhouse-effect (in Dutch)
Het broeikaseffect
Het broeikaseffect is het opsluiten van warmte in de atmosfeer. Het is een effect dat wereldwijd is ontstaan als gevolg van de aanwezigheid van broeikasgassen, zoals CO2 (koolstofdioxide) en waterdamp, in de atmosfeer. Het natuurlijke broeikaseffect zorgt ervoor dat de gemiddelde temperatuur op aarde (op jaarbasis) ongeveer + 15 °C is. Zonder dit natuurlijke broeikaseffect zou de gemiddelde temperatuur rond de –18 °C liggen en zou leven op aarde niet mogelijk zijn.
Wat is er dan zo slecht aan het broeikaseffect? Op zich niets, het hoort bij de natuur. Maar de mens is zich steeds meer met die natuur gaan bemoeien: bomen kappen, auto rijden, vliegtuigen, enz. Hierdoor brengt de mens grote hoeveelheden broeikasgassen in de atmosfeer, wat het broeikas-effect behoorlijk versterkt en dat leidt tot een warmer klimaat. Dit wordt ook wel het versterkte broeikaseffect genoemd. Hoe dit precies in z’n werk gaat, wordt in deze tekst uitgelegd.
De temperatuur van het aardoppervlak wordt in hoge mate bepaald door:
o De hoeveelheid zonnestraling die door de aarde wordt geabsorbeerd. Dit verhoogt de
temperatuur van het aardoppervlak.
o De hoeveelheid zonnestraling die, bijvoorbeeld door de wolken, wordt gereflecteerd,
nog voor het de aarde bereikt. Dit verlaagt de temperatuur van het aardoppervlak.
Een deel van de zonnestraling die richting de aarde gaat, wordt dus, nog voor het de aarde bereikt, weerkaatst (door bv. wolken) en een ander deel wordt door de aarde geabsorbeerd. Een deel van die geabsorbeerde warmte wordt later terug afgestaan aan de ruimte als infraroodstraling. Dit gebeurt met name ’s nachts. Bij het natuurlijke broeikaseffect zijn de
processen van opname van warmte overdag en weerkaatsing van warmte ‘s nachts met elkaar in evenwicht, maar bij het versterkt broeikaseffect is dit evenwicht verdwenen. De aanwezige broeikasgassen houden namelijk een deel van de warmte die normaal gesproken als infraroodstraling wordt gereflecteerd tegen. Hierdoor zit de warmte dus ‘opgesloten’ in de
atmosfeer van de aarde waardoor de temperatuur stijgt.
Één van de belangrijkste broeikasgassen is CO2 (koolstofdioxide). De concentratie CO2 in de atmosfeer is de afgelopen tijd flink toegenomen. Dat heeft verschillende oorzaken:
o CO2 komt vrij bij de verbranding van fossiele brandstoffen, zoals steenkool en
28 o Ontbossing: steeds meer bos verdwijnt om land te winnen voor landbouw of
nederzettingen. Hierdoor vindt minder fotosynthese plaats, waardoor planten minder CO2 opslaan en er meer blijft hangen in de atmosfeer.
o Industrie.
De aanwezigheid van een overmaat CO2 in de atmosfeer heeft ook verschillende gevolgen: o Versterking van het broeikaseffect. CO2 houdt de infrarode straling vast die door de
aarde wordt teruggekaatst, het absorbeert namelijk de infrarode straling. Hierdoor blijft de infrarood straling hangen in de atmosfeer en dit zorgt voor een temperatuurstijging.
o Versnelling van fotosynthese. CO2 wordt gebruikt door planten in de fotosynthese.
Bij een toename van het koolstofdioxide gehalte in de atmosfeer kan de vegetatie door de versnelde fotosynthese sneller groeien. Dit proces kan echter niet op tegen de ontbossing, wat er juist voor zorgt dat er minder fotosynthese plaatsvindt.
o Verzuring van de zee. Verhoging van het CO2-gehalte in de atmosfeer zorgt voor een
hogere oplossing van CO2 in het zeewater. Door de vorming van koolzuur wordt de pH (de zuurgraad) van het zeewater lager (zuurder). Als gevolg daarvan zal er een verstoring van het ecosysteem in zee optreden.
Maar er zijn nog meer broeikasgassen die een bijdrage leveren aan het broeikaseffect: o Methaan (CH4). Dit ontstaat vooral in de landbouw en veeteelt.
o Diastikstofoxide (N2O, lachgas). Dit komt vrij bij de verbranding van fossiele
brandstoffen en het gebruik van mest.
o Fluorverbindingen: dit zijn stoffen als HKF’s, PFK’s en SF6.
o Stikstofoxiden (NOx), koolmonoxide en vluchtige organische stoffen hebben een
indirecte invloed op het klimaat.
29 Appendix IV – Multiple choice questions of the pre-test (in Dutch)
Meerkeuze vragen
Omcirkel het juiste antwoord. Er is altijd maar één antwoord juist.
1. Waardoor wordt de temperatuur van het aardoppervlak verlaagd?
a. Door de hoeveelheid zonnewarmte die door de aarde wordt geabsorbeerd. b. Door de hoeveelheid zonnewarmte die door de aarde wordt gereflecteerd. c. Door de aanwezigheid van broeikasgassen in de atmosfeer.
d. Door de toegenomen concentratie van CO2 (koolstofdioxide) in de atmosfeer.
2. Wat is de invloed van het natuurlijke broeikaseffect? a. Het zorgt ervoor dat de aarde langzaam opwarmt.
b. Het zorgt ervoor dat de concentratie CO2 in de atmosfeer toeneemt. c. Het zorgt ervoor dat de concentratie CO2 in de atmosfeer afneemt. d. Het zorgt ervoor dat leven op aarde mogelijk is.
3. Welk van de deze oorzaken is geen directe oorzaak voor de toegenomen concentratie CO2?
a. Industrie.
b. Toegenomen landbouw. c. Ontbossing.
d. Verbranding van fossiele brandstoffen.
4. Hoe beïnvloedt CO2 de verzuring van de zee?
a. Door de vorming van koolzuur wordt de pH (de zuurgraad) van het zeewater lager (zuurder).
b. Door een grotere concentratie CO2 in de atmosfeer wordt de pH van het zeewater hoger (minder zuur). CO2 zorgt dus niet voor verzuring, maar juist voor een minder hoge zuurgraad in het zeewater.
c. Er is nog te weinig bekend over de invloed van CO2 op de verzuring van de
zee om daar iets over te kunnen zeggen.
d. CO2 heeft helemaal geen invloed op de verzuring van de zee.
5. Naast CO2 zijn er nog meer broeikasgassen die invloed hebben op het broeikaseffect. Welke zijn hier voorbeelden van?
30 c. Antwoorden A en B zijn beide juist.
d. Antwoorden A en B zijn beide onjuist.
6. Hieronder staan 4 tekstfragmenten. Één van deze fragmenten klopt niet. Welke? a. Fragment (A)
b. Fragment (B) c. Fragment (C) d. Fragment (D)
(A): Het broeikaseffect is het opsluiten van warmte in de atmosfeer. Het is een effect dat wereldwijd is ontstaan als gevolg van de aanwezigheid van broeikasgassen, zoals CO2 (koolstofdioxide) en waterdamp, in de atmosfeer.
(B): Ook door het toenemende vliegverkeer neemt de hoeveelheid CO2 in de atmosfeer toe. Vliegen kost per reizigerskilometer twee maal zo veel energie als reizen per auto en vier maal zo veel als reizen per trein. Bij het bereiken van 44 miljoen passagiers zal het aandeel van het vliegverkeer 10% van de Nederlandse CO2-uitstoot vormen.
(C): De temperatuur op aarde wordt door verschillende factoren bepaald. De hoeveelheid zonnewarmte die door de aarde wordt geabsorbeerd, verhoogt de temperatuur op aarde. De hoeveelheid infraroodstraling die door de aarde wordt teruggekaatst, verlaagt de temperatuur op aarde. Bij het natuurlijk broeikaseffect is dit evenwicht verstoord: er vindt minder terugkaatsing dan opname plaats, waardoor de temperatuur daalt.
(D): Het klimaat verandert altijd, onder invloed van natuurlijke factoren. Sinds het midden van de 20e eeuw verandert het klimaat harder dan normaal, mede onder invloed van de mens via het versterkt broeikaseffect. Door de grote hoeveelheid broeikasgassen die de mens uitstoot (met o.a. autorijden en de verbranding van fossiele brandstoffen) stijgt de gemiddelde temperatuur op aarde.
7. Op welke manier is ontbossing van invloed op de temperatuur op aarde?
a. Door ontbossing verdwijnen steeds meer bomen en planten, waardoor de overgebleven bomen en planten harder moeten werken om de fotosynthese over te nemen. Hierdoor blijft wat meer CO2 over in de atmosfeer, maar het effect hiervan is minimaal. De temperatuur op aarde wordt dus niet beïnvloed door ontbossing.
31 weg kan. Hierdoor blijft de warmte in de atmosfeer hangen waardoor de temperatuur op aarde stijgt.
c. Door ontbossing verdwijnen steeds meer bomen en planten, waardoor de overgebleven bomen en planten harder moeten werken om de fotosynthese over te nemen. Hierdoor nemen ze meer CO2 op uit de atmosfeer, en dit effect is omgekeerd aan het broeikaseffect. De temperatuur op aarde daalt dus door ontbossing.
d. Door ontbossing verdwijnen steeds meer bomen en planten, waardoor steeds minder fotosynthese plaatsvindt. De CO2 die dan niet wordt opgenomen, wordt door de zee omgezet in koolzuur en kan niet weg. Hierdoor blijft de warmte in de atmosfeer hangen waardoor de temperatuur op aarde stijgt.
8. Wat is/zijn het/de gevolg(en) van de verbranding van fossiele brandstoffen? a. Het vrijkomen van CO2.
b. De vorming van aërosolen.
c. Het vrijkomen van diastikstofoxide. d. Alle bovenstaande antwoorden zijn juist.
9. Bij het natuurlijk broeikaseffect is er sprake van een evenwicht dat bij het versterkt broeikaseffect is verdwenen. Welk evenwicht is dat?
a. De hoeveelheid zonnestraling die door de aarde wordt geabsorbeerd en de hoeveelheid zonnestraling die direct door de wolken wordt teruggekaatst, nog voor de zonnestraling de aarde bereikt.
b. De vrijgekomen hoeveelheid CO2 door industrie en de hoeveelheid CO2 die door fotosynthese wordt opgenomen.
c. De hoeveelheid bomen en planten die verdwijnen (ontbossing) en de hoeveelheid bomen en planten die nieuw groeien.
d. De processen van opname van warmte overdag en de weerkaatsing van warmte ’s nachts.
10. Aërosolen hebben ook invloed op het broeikaseffect. Op welke manier?
a. Ze werken het broeikaseffect tegen. Aërosolen zijn een soort zwevende
druppeltjes en stofjes die de zonnestraling nog voor het de aarde bereikt terugkaatsen waardoor minder warmte de atmosfeer inkomt.
32 aarde tegenhouden. Hierdoor blijft de infraroodstraling in de atmosfeer hangen.
c. Ze werken het broeikaseffect tegen. Aërosolen zijn stofjes die vrijkomen bij de verbranding van fossiele brandstoffen en die zorgen ervoor dat er minder CO2 vrij kan komen.
33 Appendix V – Coding scheme of the multiple choice questions of the pre-test (in Dutch)
Antwoordmodel meerkeuze vragen pre-test
Ieder goed antwoord levert 1 punt op. Er is steeds maar 1 antwoord juist. Wanneer er meer
dan 1 antwoord is gegeven, wordt de vraag geheel fout gerekend en levert die vraag dus geen
punten op.
34 Appendix VI – Multiple choice questions of the mid-test (in Dutch)
Meerkeuze vragen
Omcirkel het juiste antwoord. Er is altijd maar één antwoord juist.
1. Welk van de deze oorzaken is geen directe oorzaak voor de toegenomen concentratie CO2?
a. Industrie.
b. Toegenomen landbouw. c. Ontbossing.
d. Verbranding van fossiele brandstoffen.
2. Aërosolen hebben ook invloed op het broeikaseffect. Op welke manier?
a. Ze werken het broeikaseffect tegen. Aërosolen zijn een soort zwevende druppeltjes en stofjes die de zonnestraling nog voor het de aarde bereikt terugkaatsen waardoor minder warmte de atmosfeer inkomt.
b. Ze versterken het broeikaseffect. Aërosolen zijn een soort zwevende druppeltjes en stofjes die de terugkaatsing van infraroodstraling vanaf de aarde tegenhouden. Hierdoor blijft de infraroodstraling in de atmosfeer hangen.
c. Ze werken het broeikaseffect tegen. Aërosolen zijn stofjes die vrijkomen bij de verbranding van fossiele brandstoffen en die zorgen ervoor dat er minder CO2 vrij kan komen.
d. Ze versterken het broeikaseffect. Aërosolen zijn stofjes die vrijkomen bij de verbranding van fossiele brandstoffen en vormen, net als CO2, een laag in de broeikasgassen. Hierdoor houden ze de infraroodstraling die door de aarde wordt teruggekaatst tegen.
3. Wat is/zijn het/de gevolg(en) van de verbranding van fossiele brandstoffen? a. Het vrijkomen van CO2.
b. De vorming van aërosolen.
c. Het vrijkomen van diastikstofoxide. d. Alle bovenstaande antwoorden zijn juist.
4. Waardoor wordt de temperatuur van het aardoppervlak verlaagd?
35 c. Door de aanwezigheid van broeikasgassen in de atmosfeer.
d. Door de toegenomen concentratie van CO2 (koolstofdioxide) in de atmosfeer.
5. Hieronder staan 4 tekstfragmenten. Één van deze fragmenten klopt niet. Welke? a. Fragment (A)
b. Fragment (B) c. Fragment (C) d. Fragment (D)
(A): Het broeikaseffect is het opsluiten van warmte in de atmosfeer. Het is een effect dat wereldwijd is ontstaan als gevolg van de aanwezigheid van broeikasgassen, zoals CO2 (koolstofdioxide) en waterdamp, in de atmosfeer.
(B): Ook door het toenemende vliegverkeer neemt de hoeveelheid CO2 in de atmosfeer toe. Vliegen kost per reizigerskilometer twee maal zo veel energie als reizen per auto en vier maal zo veel als reizen per trein. Bij het bereiken van 44 miljoen passagiers zal het aandeel van het vliegverkeer 10% van de Nederlandse CO2-uitstoot vormen.
(C): De temperatuur op aarde wordt door verschillende factoren bepaald. De hoeveelheid zonnewarmte die door de aarde wordt geabsorbeerd, verhoogt de temperatuur op aarde. De hoeveelheid infraroodstraling die door de aarde wordt teruggekaatst, verlaagt de temperatuur op aarde. Bij het natuurlijk broeikaseffect is dit evenwicht verstoord: er vindt minder terugkaatsing dan opname plaats, waardoor de temperatuur daalt.
(D): Het klimaat verandert altijd, onder invloed van natuurlijke factoren. Sinds het midden van de 20e eeuw verandert het klimaat harder dan normaal, mede onder invloed van de mens via het versterkt broeikaseffect. Door de grote hoeveelheid broeikasgassen die de mens uitstoot (met o.a. autorijden en de verbranding van fossiele brandstoffen) stijgt de gemiddelde temperatuur op aarde.
6. Wat is de invloed van het natuurlijke broeikaseffect? a. Het zorgt ervoor dat de aarde langzaam opwarmt.
b. Het zorgt ervoor dat de concentratie CO2 in de atmosfeer toeneemt. c. Het zorgt ervoor dat de concentratie CO2 in de atmosfeer afneemt. d. Het zorgt ervoor dat leven op aarde mogelijk is.
36 a. De hoeveelheid zonnestraling die door de aarde wordt geabsorbeerd en de hoeveelheid zonnestraling die direct door de wolken wordt teruggekaatst, nog voor de zonnestraling de aarde bereikt.
b. De vrijgekomen hoeveelheid CO2 door industrie en de hoeveelheid CO2 die door fotosynthese wordt opgenomen.
c. De hoeveelheid bomen en planten die verdwijnen (ontbossing) en de hoeveelheid bomen en planten die nieuw groeien.
d. De processen van opname van warmte overdag en de weerkaatsing van warmte ’s nachts.
8. Naast CO2 zijn er nog meer broeikasgassen die invloed hebben op het broeikaseffect. Welke zijn hier voorbeelden van?
a. Diastikstofoxide (N2O) en fluorverbindingen (zoals HKF’s). b. Methaan (CH4) en stikstofoxiden (NOx).
c. Antwoorden A en B zijn beide juist. d. Antwoorden A en B zijn beide onjuist.
9. Op welke manier is ontbossing van invloed op de temperatuur op aarde?
a. Door ontbossing verdwijnen steeds meer bomen en planten, waardoor de overgebleven bomen en planten harder moeten werken om de fotosynthese over te nemen. Hierdoor blijft wat meer CO2 over in de atmosfeer, maar het effect hiervan is minimaal. De temperatuur op aarde wordt dus niet beïnvloed door ontbossing.
b. Door ontbossing verdwijnen steeds meer bomen en planten, waardoor steeds minder fotosynthese plaatsvindt. De CO2 die dan niet wordt opgenomen, blijft hangen in de atmosfeer en dit zorgt ervoor dat de infraroodstraling niet weg kan. Hierdoor blijft de warmte in de atmosfeer hangen waardoor de temperatuur op aarde stijgt.
c. Door ontbossing verdwijnen steeds meer bomen en planten, waardoor de overgebleven bomen en planten harder moeten werken om de fotosynthese over te nemen. Hierdoor nemen ze meer CO2 op uit de atmosfeer, en dit effect is omgekeerd aan het broeikaseffect. De temperatuur op aarde daalt dus door ontbossing.
37 10. Hoe beïnvloedt CO2 de verzuring van de zee?
a. Door de vorming van koolzuur wordt de pH (de zuurgraad) van het zeewater lager (zuurder).
b. Door een grotere concentratie CO2 in de atmosfeer wordt de pH van het zeewater hoger (minder zuur). CO2 zorgt dus niet voor verzuring, maar juist voor een minder hoge zuurgraad in het zeewater.
c. Er is nog te weinig bekend over de invloed van CO2 op de verzuring van de zee om daar iets over te kunnen zeggen.
38 Appendix VII – Coding scheme of the multiple choice questions of the mid-test (in Dutch)
Antwoordmodel meerkeuze vragen mid-test
Ieder goed antwoord levert 1 punt op. Er is steeds maar 1 antwoord juist. Wanneer er meer
dan 1 antwoord is gegeven, wordt de vraag geheel fout gerekend en levert die vraag dus geen
punten op.
39 Appendix VIII – Multiple choice questions of the post-test (in Dutch)
Meerkeuze vragen
Omcirkel het juiste antwoord. Er is altijd maar één antwoord juist.
1. Wat is/zijn het/de gevolg(en) van de verbranding van fossiele brandstoffen? a. Het vrijkomen van CO2.
b. De vorming van aërosolen.
c. Het vrijkomen van diastikstofoxide. d. Alle bovenstaande antwoorden zijn juist.
2. Hieronder staan 4 tekstfragmenten. Één van deze fragmenten klopt niet. Welke? a. Fragment (A)
b. Fragment (B) c. Fragment (C) d. Fragment (D)
(A): Het broeikaseffect is het opsluiten van warmte in de atmosfeer. Het is een effect dat wereldwijd is ontstaan als gevolg van de aanwezigheid van broeikasgassen, zoals CO2 (koolstofdioxide) en waterdamp, in de atmosfeer.
(B): Ook door het toenemende vliegverkeer neemt de hoeveelheid CO2 in de atmosfeer toe. Vliegen kost per reizigerskilometer twee maal zo veel energie als reizen per auto en vier maal zo veel als reizen per trein. Bij het bereiken van 44 miljoen passagiers zal het aandeel van het vliegverkeer 10% van de Nederlandse CO2-uitstoot vormen.
(C): De temperatuur op aarde wordt door verschillende factoren bepaald. De hoeveelheid zonnewarmte die door de aarde wordt geabsorbeerd, verhoogt de temperatuur op aarde. De hoeveelheid infraroodstraling die door de aarde wordt teruggekaatst, verlaagt de temperatuur op aarde. Bij het natuurlijk broeikaseffect is dit evenwicht verstoord: er vindt minder terugkaatsing dan opname plaats, waardoor de temperatuur daalt.
(D): Het klimaat verandert altijd, onder invloed van natuurlijke factoren. Sinds het midden van de 20e eeuw verandert het klimaat harder dan normaal, mede onder invloed van de mens via het versterkt broeikaseffect. Door de grote hoeveelheid broeikasgassen die de mens uitstoot (met o.a. autorijden en de verbranding van fossiele brandstoffen) stijgt de gemiddelde temperatuur op aarde.
3. Waardoor wordt de temperatuur van het aardoppervlak verlaagd?
40 c. Door de aanwezigheid van broeikasgassen in de atmosfeer.
d. Door de toegenomen concentratie van CO2 (koolstofdioxide) in de atmosfeer.
4. Aërosolen hebben ook invloed op het broeikaseffect. Op welke manier?
a. Ze werken het broeikaseffect tegen. Aërosolen zijn een soort zwevende druppeltjes en stofjes die de zonnestraling nog voor het de aarde bereikt terugkaatsen waardoor minder warmte de atmosfeer inkomt.
b. Ze versterken het broeikaseffect. Aërosolen zijn een soort zwevende druppeltjes en stofjes die de terugkaatsing van infraroodstraling vanaf de aarde tegenhouden. Hierdoor blijft de infraroodstraling in de atmosfeer hangen.
c. Ze werken het broeikaseffect tegen. Aërosolen zijn stofjes die vrijkomen bij de verbranding van fossiele brandstoffen en die zorgen ervoor dat er minder CO2 vrij kan komen.
d. Ze versterken het broeikaseffect. Aërosolen zijn stofjes die vrijkomen bij de verbranding van fossiele brandstoffen en vormen, net als CO2, een laag in de broeikasgassen. Hierdoor houden ze de infraroodstraling die door de aarde wordt teruggekaatst tegen.
5. Welk van de deze oorzaken is geen directe oorzaak voor de toegenomen concentratie CO2?
a. Industrie.
b. Toegenomen landbouw. c. Ontbossing.
d. Verbranding van fossiele brandstoffen.
6. Naast CO2 zijn er nog meer broeikasgassen die invloed hebben op het broeikaseffect. Welke zijn hier voorbeelden van?
a. Diastikstofoxide (N2O) en fluorverbindingen (zoals HKF’s). b. Methaan (CH4) en stikstofoxiden (NOx).
c. Antwoorden A en B zijn beide juist. d. Antwoorden A en B zijn beide onjuist.
41 a. De hoeveelheid zonnestraling die door de aarde wordt geabsorbeerd en de hoeveelheid zonnestraling die direct door de wolken wordt teruggekaatst, nog voor de zonnestraling de aarde bereikt.
b. De vrijgekomen hoeveelheid CO2 door industrie en de hoeveelheid CO2 die door fotosynthese wordt opgenomen.
c. De hoeveelheid bomen en planten die verdwijnen (ontbossing) en de hoeveelheid bomen en planten die nieuw groeien.
d. De processen van opname van warmte overdag en de weerkaatsing van warmte ’s nachts.
8. Wat is de invloed van het natuurlijke broeikaseffect? a. Het zorgt ervoor dat de aarde langzaam opwarmt.
b. Het zorgt ervoor dat de concentratie CO2 in de atmosfeer toeneemt. c. Het zorgt ervoor dat de concentratie CO2 in de atmosfeer afneemt. d. Het zorgt ervoor dat leven op aarde mogelijk is.
9. Hoe beïnvloedt CO2 de verzuring van de zee?
a. Door de vorming van koolzuur wordt de pH (de zuurgraad) van het zeewater lager (zuurder).
b. Door een grotere concentratie CO2 in de atmosfeer wordt de pH van het zeewater hoger (minder zuur). CO2 zorgt dus niet voor verzuring, maar juist voor een minder hoge zuurgraad in het zeewater.
c. Er is nog te weinig bekend over de invloed van CO2 op de verzuring van de zee om daar iets over te kunnen zeggen.
d. CO2 heeft helemaal geen invloed op de verzuring van de zee.
10. Op welke manier is ontbossing van invloed op de temperatuur op aarde?
a. Door ontbossing verdwijnen steeds meer bomen en planten, waardoor de overgebleven bomen en planten harder moeten werken om de fotosynthese over te nemen. Hierdoor blijft wat meer CO2 over in de atmosfeer, maar het effect hiervan is minimaal. De temperatuur op aarde wordt dus niet beïnvloed door ontbossing.
42 c. Door ontbossing verdwijnen steeds meer bomen en planten, waardoor de overgebleven bomen en planten harder moeten werken om de fotosynthese over te nemen. Hierdoor nemen ze meer CO2 op uit de atmosfeer, en dit effect is omgekeerd aan het broeikaseffect. De temperatuur op aarde daalt dus door ontbossing.
43 Appendix IX – Coding scheme of the multiple choice questions of the post-test (in Dutch)
Antwoordmodel meerkeuze vragen post-test
Ieder goed antwoord levert 1 punt op. Er is steeds maar 1 antwoord juist. Wanneer er meer
dan 1 antwoord is gegeven, wordt de vraag geheel fout gerekend en levert die vraag dus geen
punten op.
44 Appendix X – Open question test (in Dutch)
Open vragen
Vul het antwoord zo compleet mogelijk in.
1. A: Leg uit wat beide soorten broeikaseffect inhouden. Beschrijf hierbij hoe het broeikaseffect tot stand komt en maak, waar nodig, gebruik van voorbeelden.
... ... ... ... ... ... ... ...
B: Noem het verschil tussen beide broeikaseffecten. Maak zo nodig weer gebruik van voorbeelden.
... ... ... ... ... ...
2. A: Noem twee gevolgen van de verhoogde concentratie CO2 in de atmosfeer.
... ... B: Leg uit wat deze gevolgen inhouden.
45 3. A: Omcirkel het goede antwoord: de volgende stelling is juist / onjuist.
Stelling: ‘Aërosolen hebben een werking die omgekeerd is aan het broeikaseffect.’
B: Licht je antwoord bij A toe. Maak, waar nodig, gebruik van voorbeelden.
... ... ... ... ... ... ... ...
4. Leg uit op welke manier industrie de temperatuur op aarde beïnvloedt. Houd hierbij rekening met het broeikaseffect.
... ... ... ... ... ... ... ...
46 Appendix XI – Coding scheme of the open question test (in Dutch)
1. A: Leg uit wat beide soorten broeikaseffect inhouden. Beschrijf hierbij hoe het broeikaseffect tot stand komt en maak, waar nodig, gebruik van voorbeelden.
B: Noem het verschil tussen beide broeikaseffecten. Maak zo nodig weer gebruik van voorbeelden.
Maximaal aantal punten: 16
Bijzonderheden: de schuin gedrukte zinsdelen moeten in het antwoord aanwezig zijn, anders worden voor dat onderdeel geen punten toegekend. Onderdeel A en B worden in één keer nagekeken. Als antwoorden dubbel worden gegeven, wordt maar één keer punten toegekend, maar het maakt niet uit of het antwoord bij onderdeel A of B is gegeven.
- Broeikaseffect is het opsluiten van warmte in de atmosfeer (½).
- Natuurlijk broeikaseffect (1) OF: normaal broeikaseffect (½) OF: standaard broeikaseffect (½) en versterkt broeikaseffect (1) OF: onnatuurlijk broeikaseffect (½)
OF: niet-natuurlijk broeikaseffect (½). ‘Andere broeikaseffect’ wordt niet goed gerekend. Alleen voor het noemen van de begrippen worden al punten toegekend. Optie 1 (indien optie 1 en 2 samen worden genoemd, wordt gekeken voor welke optie de meeste punten zijn behaald. Deze punten worden dan toegekend +½ voor het noemen van de andere optie):
- Het natuurlijk broeikaseffect is het effect dat wereldwijd is ontstaan als gevolg van/komt tot stand door de aanwezigheid van broeikasgassen (1), zoals CO2 (½) en
waterdamp (½) (voor ieder ander goed voorbeeld ook ½ punt, maximaal 1 punt), in
de atmosfeer. Optie 2:
- Het natuurlijk broeikaseffect is het evenwicht tussen warmteopname overdag en warmteafgifte ’s nachts (1), door middel van infraroodstraling (1).OF: wanneer de warmte die overdag wordt opgenomen en ’s nachts wordt gereflecteerd gelijk is (1)
als infraroodstraling wordt genoemd (1). Indien geen duidelijk onderscheid wordt gemaakt tussen overdag en ’s nachts (½). Er moet ook warmte worden genoemd, ‘licht’ of ‘straling’ is niet goed.
Onderstaande antwoorden mogen bij beide opties worden genoemd: