Automating the Layout of Image for Large,
Shared Displays
A thesis submitted in partial fulfilment of the requirements for the Degree of Master of Science by Ben McDonald
Supervisor: Professor Andy Cockburn
Associate Supervisor: Dr Richard Green
Abstract
Advances in display technology are increasing screen size and reducing their costs.
Large, wall sized screens can be found in malls, public squares and office buildings
displaying photos, videos, advertising, news and announcements. The audience of large
displays in public, urban environments can be constantly changing and in this thesis we
investigate applying automated layout algorithms to large displays to adapt layouts to
changing audiences.
We review current automated layouts, discuss new challenges when applying automated
layouts to large screens and present our design space for automated layouts. We investigate
the human factors (such as attention, vision, and perception) and the system factors
(such as display space and input devices) involved in automated layout for large displays.
This thesis presents the Viewer Aware Layout (VAL) system. VAL is a system that
automates the layout of images on a large display and is designed to allow many users
to collectively view images. VAL, and features of VAL, are tested for engagement and
it is found that there is a significant increase in agreement by users with statements
describing an engaging experience when VAL is applied to an image layout. This thesis
concludes with a summary of the research contributions and proposes future areas of
CONTENTS 5
Contents
1 Introduction 1
2 Related Work 4
2.1 Human Perception . . . 4
2.2 Uses of Large Screen Displays . . . 12
2.3 Automated Layout Algorithms . . . 13
2.4 Conclusion . . . 21
3 Goals for Automated Layouts 23 4 Hardware Design Factors for Layout Systems 28 4.1 Screen Properties . . . 28
4.2 Lightweight Interaction Methods . . . 32
4.3 Conclusion . . . 37
6 CONTENTS
5.2 Handling Multiple Users . . . 48
5.3 Layout Transitions . . . 56
5.4 Overall Layout . . . 62
5.5 Conclusion . . . 68
6 Developed System: VAL 70 6.1 First system . . . 70
6.2 VAL . . . 72
6.3 Static objective function . . . 76
6.4 Dynamic objective function . . . 77
6.5 Measurements . . . 78
6.6 Conclusion . . . 80
7 Evaluation 81 7.1 Participants . . . 81
7.2 Apparatus . . . 81
CONTENTS 7
7.4 Results . . . 86
7.5 Discussion . . . 87
8 Conclusion and Further Work 89
References 91
1
1
Introduction
Everyday people in urban environments view an array of images and posters such as product advertisements, news, timetables and announcements. Screens large enough to cover a wall sized area provide new opportunities to display content. Content can be enlarged so that it can be viewed by many users from a distance or content can be placed in an array across a display so that many users can each view individualised content.
Large display layouts can be broken into four categorises. There are static layouts that do not change. There are layouts that change based on pre-programmed, time dependent, scripts [34, 11]. There are user directed layouts which allow users to direct the layout with commands. Users can resize content when their interests change or position content close to where they are standing. But user directed layouts require users to invest time in content layout and invest time in learning layout commands. An alternative is automated layouts [43]. They do not require users to invest time in content layout and they enable content to dynamically adapt to and be influenced by a display’s audience.
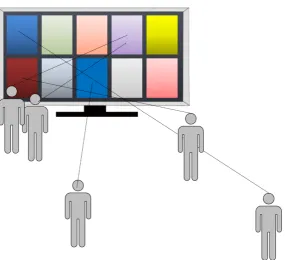
Consider this example large display layout scenario. A city is hosting a music festival and each act has a promotional poster. A large display is used to present a collection of ten promotional posters. The display has five users, each with different viewing positions and interests (see Figure 1.1). We propose using computer algorithms combined with technology such as human tracking, gesture recognition to automate the positioning, sizing, and movement of images on a large display. Using these technologies and an automated layout algorithm a layout could be found that balances the needs of all users to comfortably view the promotional posters they wish to view.
2 1 INTRODUCTION
3
users and displaying an array of content. We consider automated layouts to be computer directed layouts that automatically adapt to changes in input and do not require a user to direct the placement or size of items on a display. We do not consider the addition or removal of content but instead focus on the layout of images to simplify the research.
4 2 RELATED WORK
2
Related Work
This chapter presents the work related to the automated layout of images on large displays. Section 2.1 reviews the science on human perception and the E-conic system that corrects perspective distortion for large displays. It also highlights two variables uniquely important to large display layout, visual angle and perspective distortion. Section 2.2 discusses some of the ways large displays are currently used and the type of content that is displayed on them. Section 2.3 describes automated layout algorithms. It reviews automated layouts used in graph, document and desktop layout. Treemaps, forced based layout, machine learning are some of the different algorithms used in these domains.
The related work dealing with user inputs to a display system is reviewed in Chapter 4 “Hardware Design Factors for Layout Systems”. Chapter 4 reviews display systems that use a variety of ways to detect user interest in content. This chapter describes the background of the topic and work done related to automated layout. Some topics, such as visual angle and perspective distortion, are discussed in more detail later in the thesis.
2.1
Human Perception
When studying image layout we need to consider the capabilities and limitations of the human visual system. Human perception research is the bedrock that is at the beginning of our understanding of a good layout system. It is important to begin here because it defines from what distance and from what angle a human will be able to clearly view and perceive images.
2.1 Human Perception 5
and resizing of content will affect both visual angle and perspective distortion, which in turn affects the clarity of content. Because of this affect on the clearness of vision, visual angle and perspective distortion need to be considered for each user when laying content out. These two variables are uniquely important to users of large screens because of the large range of distances and angles a user can view content from.
It seems intuitive that an image to be comfortable viewed on a display should be directly in front of a user and, to put it informally, large in their visual field. With the two variables visual angle and perspective distortion we can measure the benefits to a user when placing content directly in front of them and large in their visual field.
Visual Angle
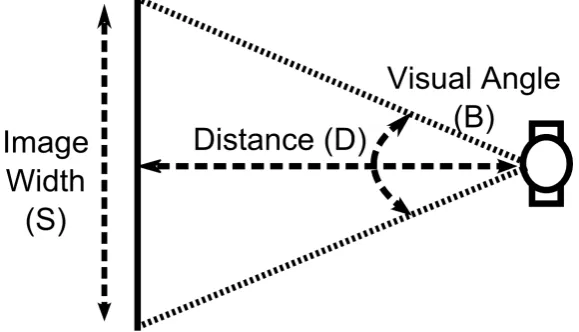
Visual angle is a key measurement in understanding how content will be perceived on a large screen. Visual angle is a measurement of the size that an image appears on a viewer’s retina, usually stated in degrees of arc (see Figure 2.1 on the following page and Equation 2.1). It is an important variable in content layout as it determines the detail a user will be able to perceive in content. The physical size of content or user distance to content do not tell us anything meaningful about a user’s perception of content by themselves but both affect visual angle.
tanB
2 = S
2D (2.1)
6 2 RELATED WORK
Figure 2.1: Visual angle is a measurement of the size that an image appears on a viewer’s retina
Display Type Distance Display Width Horizontal Visual Angle
Mobile Phone 0.53 metres 0.08 metres 9°
Desktop 0.75 metres 0.51 metres 38°
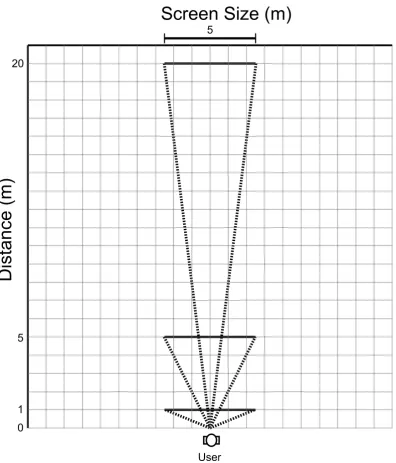
Wall Sized 1.0 metres 5.0 metres 136°
Wall Sized 5.0 metres 5.0 metres 53°
Wall Sized 20.0 metres 5.0 metres 14°
Table 1: Example visual angles of display users
object.
A general rule is that at an arm’s length a thumbnail subtends to about 1 degree of visual angle. That is a 1cm object at 60cm has a visual angle of about 1 degree of visual angle. A 5cm newspaper column has a visual angle of 7 degrees when read at a distance of 40cm.
[image:13.595.75.515.359.476.2]2.1 Human Perception 7
8 2 RELATED WORK
is continuous or broken and has been approximated as 2 seconds of arc [63]. And the most relevant to large displays, recognition acuity, which measures readability of letters, is 0.5 minutes of arc [63].
Recognition acuity and readability are mostly consistent at any one visual angle. Chapanis and Scarpa [23] tested the readability of dials at different distances while keeping the visual angle constant. Their experiments found the readability of dials were mostly consistent for a given visual angle (there was a slight, unexplained increase in readability as the distance to the dials increased) when the distance was greater than 28 inches (0.71 metres). Suzuki and Nakata [65] found reaction times in mental rotation tasks to be consistent given a visual angle and a study by Bao et al. [10] demonstrated no difference in participant’s ability to identify objects on a large and small display with consistent visual angle. Tan el al. [66] observed user performance in reading being only affected by the visual angle of content, not the location or the physical size of the display it is rendered on. The visual angle of content will indicate a user’s ability to perceive detail.
2.1 Human Perception 9
Figure 2.3: This object could be seen as either a trapezoidal window or a rectangular window rotated but it is most commonly perceived as a rectangular window rotated.
Perspective Distortion
The information the brain receives from binocular vision combined with the spatial clues from head movement can still result in ambiguous information about the physical shapes we see. The Trapezoidal Window experiment [3] highlights this ambiguity by providing a viewer with a shape that can be perceived in two mutually exclusive ways.
This experiment involves viewing a trapezoidal window at 6m with both eyes. From this distance the trapezoidal window can be seen as a trapezoidal window or as a rectangular window slanted to the left (Figure 2.3). Most commonly, the window is seen as the simpler shape of a rectangular window slanted to the left. It was hypothesised that this bias in perception was influenced by the past experiences of the viewer.
10 2 RELATED WORK
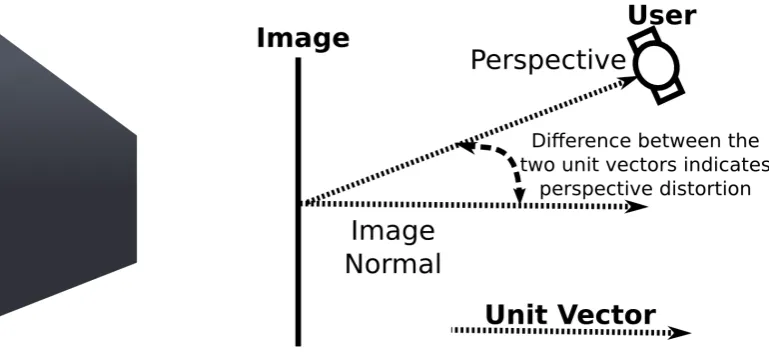
Figure 2.4: (left)A rectangular image with perspective distortion(right)A user viewing an image at an angle with the image normal and users perspective shown.
Perspective distortion on displays occurs when the direction an image is viewed from is not perpendicular to that image (see Figure 2.4). The perspective distortion of media reduces visual acuity and results in a rectangular image on a display appearing, from the viewer’s perspective, as a quadrilateral [50]. Perspective distortion can become a problem on large displays as the relative position between a user and content can vary greatly and this can result in people viewing media from obtuse or acute angles.
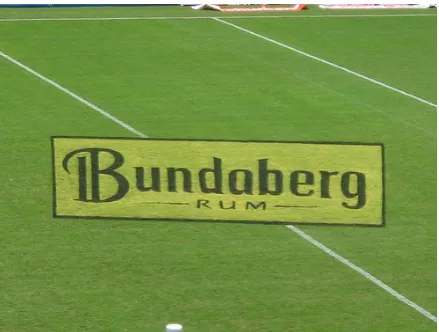
However, the perspective distortion of an image can be reduced for a single viewer by rendering the image as a quadrilateral specific to their perspective. From the viewer’s perspective, the image appears to have been rotated to face them. The image’s true shape is a quadrilateral, but it is perceived by the viewer as a rectangle. This technique is used in sports to draw images on a field as quadrilaterals so that the images will appear rectangular when filmed with a camera from above the field (see Figure 2.5).
2.1 Human Perception 11
Figure 2.5: Perspective correction of an advertisement on a sports field.
Figure 2.6: Perspective correction being used in the E-conic system.
in this way, user performance can be increased in targeting, reading and pattern-matching.
[image:18.595.195.417.338.443.2]12 2 RELATED WORK
Figure 2.7: The British Broadcasting Corporation (BBC) has constructed 19 large public displays and aims to maximise viewership for each display.
2.2
Uses of Large Screen Displays
This section describes some current uses of large display of images and looks at what kinds of images are currently been shown on large displays.
Large displays placed in public locations can be used to display many different types of content. They can show content that is relevant to a screen’s location like local maps, public announcements and timetables for buses in the area. Huang et al. [34] found large displays being used to display a range of different types of media in central Europe including art, educational content, advertising, fun facts, news and current events. Public screens have been used to show content similar to what people watch on displays in their homes such as movies and sports matches, sometimes remodelled for large audiences [11].
2.3 Automated Layout Algorithms 13
Many large displays are placed in public locations with heavy pedestrian traffic to maximise viewership. Locations such as Piccadilly Circus, London and Time Square, New York have some of the largest investments in public displays because of their heavy pedestrian traffic. The British Broadcasting Corporation (BBC) has constructed 19 large public displays and aims to maximise viewership for each display (see Figure 2.7) [11].
Wyche et al. [72] described in detail the uses of large displays in megachurches in America. The authors provide insights into how large displays are being used in megachurches and reported that megachurches have around 2000+ members viewing large displays in their church every week. The authors noted that large displays are one of the most prominent features in many megachurches. Churches use large displays to display a number of different content types including words to hymns, bible verses, administrative announcements, personal messages and videos from members of the congregation.
2.3
Automated Layout Algorithms
The current research into automated layout for large displays is limited in its quantity and scope in comparison to the research for automated layout in other applications. The algorithms that have been used are constrained to adjusting their layout to a single input such as user location or user interest [75, 51]. Methods to weigh multiple inputs still need to be explored.
14 2 RELATED WORK
These algorithms vary in their flexibility and computational complexity. The first three layout techniques we review are optimisation techniques, constraints based layouts and force based layouts. These advanced layout methods are capable of taking into account information such as the relationships between content, priority of content, grouping of content and overall layout aesthetics. Then we describe treemaps that are a simpler method for placing content but have been used to place and resize images on a desktop.
Optimisation Techniques
The problem of finding a layout can be approached by defining an optimal layout with an objective function. An objective function of a layout is a function that contains many components which each evaluate a single attribute of a layout. They define, mathematically, an optimal solution as the minimum/maximum of a combination of weighted variables. Describing an objective function lets us define mathematically what makes a good layout.
Lüders et al. [45] used two objective functions to find both optimal layouts (static objective function) and layout transitions (dynamic objective function) for window placement on a desktop computer. The static objective function, an objective for a single layout, measured properties such as how close related content was in a generated layout. The dynamic objective function, an objective for a layout transition, measured properties such as the amount of change in the current layout and the proposed generated layout.
2.3 Automated Layout Algorithms 15
objective function, an algorithm could weigh the benefits in moving content against the costs involved in changing layouts, and the algorithm only changed layout when the algorithm judges the benefits of a change in layout to outweigh the costs involved in a layout transition.
To find an optimal layout defined with an objective function an iterative algorithm, which searches the solution space to find near optimal or optimal solutions, can be applied. Evolutionary algorithms are one of these iterative algorithms.
Haraty et al. [31] used an evolutionary algorithm to find window layouts in real time. The objective function that measured the suitability of a layout in each evolution, took into account the prominence of important windows, the proximity of related windows to each other and the amount of window overlap. This objective function guided the algorithm in its search for an optimal solution. Other authors have also used evolutionary algorithms for window placement on desktop computers [64, 35, 27].
In an evolutionary algorithm, each proposed solution is evaluated with an objective function. The evolutionary algorithm tests many different solutions to search for the best match. Yet this searching and testing of many solutions has a high computational cost and can restrict their application if the evolutionary algorithm is not responsive to changes in input.
Therefore, the computational complexity of evolutionary algorithms (and other optimisation techniques) must be controlled to be used in real time. Two ways computational complexity can be reduced is by reducing the solution space (either by constraining scope of variables or reducing the number of variables in the objective function) or reducing the cost in calculating variables.
16 2 RELATED WORK
optimal layout transition. By mathematically measuring a solution, an algorithm can weigh many variables to judge whether a solution is optimal. But these optimisation techniques can be computationally intensive.
Constraint Based Layouts
Layout can be automated using constraint based layouts. Constraint based layouts use predefined constraints about content to guide the layout process. In other words, constraint based layouts are define with a set of rules and the satisfactory layouts are the layouts that do not break any of these rules. Constraints can describe such things as the strength of the relationship between content or specify the position of content in relation to other content. For example, a constraint could specify that some text describing a video be placed adjacent to the video that it describes, that a video be aligned with the right side of the screen or that one video be placed above another video. After constraints have been specified a constraint solver is used to find a solution that satisfies all constraints.
Sometimes constraints can contradict each other and different algorithms deal with constraint conflicts in different ways [43]. Constraints can be given a priority so conflicts can be resolved. In the case of two constraints conflicting with the same priority, the conflict can be solved using a first comes first served principle or a constraint grammar can be constructed so as to not allow conflicting constraints to be defined.
2.3 Automated Layout Algorithms 17
Figure 2.8: Coulomb’s Law: Fis the force acting simultaneously on particles with charges
q1andq2,ris the distance between particles andkeis called the Coulomb constant.
the top of the screen. Constraints are an optional addition to a layout system that can be used to enforce rules.
Force Based Layouts
Force based layouts simulate the movement of physical objects to find aesthetically pleasing and well spaced layouts. A common method is to simulate charged particles using Coulomb’s Law (see Figure 2.8). Coulomb’s Law states that charged particles exert forces on each other proportional to the inverse square of the distance between themselves. These forces result in particles quickly being pushed away from each other and tending towards a state where each particle is the farthest possible distances from other particles (a local low energy state). This behaviour results in symmetrical patterns with even spaces. The even spacing and the symmetry made by charged particle arrangements makes them a good candidate for simulation to produce aesthetically pleasing and well spaced layouts.
18 2 RELATED WORK
towards a destination position allows a graphical representation of objects transitioning from one layout to another and the movements are modelled on real world forces that are natural and familiar to people.
pV = k (2.2)
Boyle’s law: pis the pressure of the gas, Vis the volume of the gas and kis a constant of the system
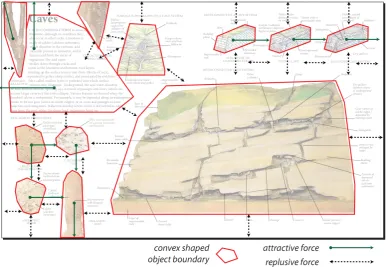
Ali et al. [2] used a combination of constraint based and forced based layout mechanisms to place items on interactive documents (see Figure 2.9 on the next page). In addition to using repulsion and attraction forces, the authors used Boyle’s Law (see Equation 2.2) to produce a force to maximise space usage. Items expanded with pressure proportional to the amount of unused space so that items expanded most forcefully when there was large unused space in a document.
2.3 Automated Layout Algorithms 19
Figure 2.9: Forced based document layout. Items on the document exert forces on each other.
Treemaps
Treemaps are a data visualisation method that can be used to divide rectangular areas into a given number of areas. The sizes of the divisions are based on a list of weights for each area. Treemaps are stored in a tree, a hierarchical data structure. The interior nodes correspond to either a horizontal or vertical division and the terminal nodes correspond to rectangles.
20 2 RELATED WORK
Figure 2.10: Treemap layout of images
would not be ideal for a user viewing media.
Kustanowitz and Shneiderman [41] developed a system that automates the layout of photos for a desktop display using a treemap algorithm. A desktop window was first divided into rectangular regions for each category of photos, and within those regions were laid out, in a grid, the photos they contained (see Figure 2.10). An algorithm called BRQ-Layout controlled the way the application window was divided into rectangles, based on the weights of each section. The system was capable of dynamically adding and removing photos.
2.4 Conclusion 21
2.4
Conclusion
In our discussion on human perception, we highlighted two important variables, visual angle and perspective distortion, which both affect the clearness of vision of images on large displays. It is important to consider visual angle and perspective distortion when laying content out on large displays as the distance and angle viewers are standing relative to the display can vary greatly.
In our discussion on automated layouts, we looked as research into automated graph, document and desktop layout. Force based layouts have been used to produce balanced and aesthetically pleasing document and desktop layouts. Researchers have published optimisations and improvements for force based layouts. Additionally, constraints and optimisation techniques have been used for document and desktop layouts.
These discoveries in graph, document and desktop layout could be ported to large displays. There are similarities between the layout of windows on a desktop or the placement of media on a document and the automated layout of information on a large display. Both require a layout system to weigh many variables when searching for a solution, fill space on a display and to be aesthetically pleasing. Large displays may benefit from the well spaced, symmetric layouts produced by force based algorithms. They may also benefit from simulations from the domain of document layout, such as Boyle’s Law which produces space filling layouts.
22 2 RELATED WORK
23
3
Goals for Automated Layouts
Automation frees a user’s time and cognitive resources from a task [? ]. With an automated layout system there is no requirement to move or resize items, no need for users to collaborate to come to a consensus on a layout and no need to learn commands for positioning images on a display. By automating the layout, users will be freed from investing their time or cognitive resources in managing the layout.
We see automated layouts as being especially suited for deployment in public locations where users may only be willing to invest a limited amount of time in interacting with the display [17]. Pedestrians may weigh the investment of time required to utilise the display against the perceived benefit of using the display. Therefore, by reducing the investment of time required to interact with a display we may increase display utilisation.
We construct six design goals for a large display layout system in a public location. First, the system will provide an engaging user experience. Second, the system will be inclusive of all interested users. Third, the system will tailor its layouts to users’ interests and viewing positions. Fourth, the system will resolve conflicting interests over screen space between viewers. Fifth, the system will be content agnostic. Sixth, the system will utilise lightweight interaction.
24 3 GOALS FOR AUTOMATED LAYOUTS
they were attracted to the display itself but because nearby objects caught their attention. One person being observed approached a computer display to view a product adjacent to the computer display and only after viewing the product did they turn their attention to the computer display. This, and other observations, by the authors led them to suggest that the attractiveness of large displays cannot be assumed and that many current deployments are not eye-catching.
It is our goal to create an engaging user experience. Engagement will be important for large display systems deployed in public locations where advertising, promotions and products will be competing for viewer’s attention. The producers of images for public display such as advertisers have an interest in maximising the number of viewers of these images and having users engaged in their viewing of images. Pedestrians also have an interest in viewing public images that they find engaging.
Bannon [9] saw the need for interfaces to be engaging to excite, motivate and enhance the user experience. O’Brien and Toms [55] argued that engagement is important in software design because users decide to invest their money, time, and effort into systems not only because of their utility, usability or efficiency but because the software also offers an engaging and emotional experience and derived six distinct attributes of engagement (perceived usability, aesthetics, focused attention, felt involvement, novelty, and endurability). The six attributes were evaluated for reliability and validity with two large scale online tests. We will use these six attributes as a guideline for producing engaging systems.
25
pedestrians so displays are placed in locations of heavy pedestrian traffic [11].
But limitations in the interaction methods or the system can prevent a large number of users for being included in a system’s decisions. For example, if the system requires all users to input commands via a touch screen then users must wait their turn to be next to the screen. We see automated layouts being inclusive of users regardless of their distance to the display or however many people there are using the display. This will require an interaction method that can be scaled to many users and a system that can consider the interests of many users.
Layout tailored to user interests and viewing positions The ultimate appearance of content for each user will be dependent on that user’s perspective. The angle that users view content from will affect the amount of perspective distortion for that user. The distance content is viewed at by users will affect the visual angle of that content —- visual angle is a measurement of the size that an image will appear on the viewer’s retina. Moving the position of content on the screen will change the image perceived for each viewer in different ways. To intelligently adapt the layout of content for viewers of a large screen we aim to design systems that will tailor the layout to users’ interests and viewing positions.
26 3 GOALS FOR AUTOMATED LAYOUTS
Content agnostic We aim to produce layout solutions that are content agnostic. A system can be applied to a broader range of image collections if it is not dependent on being given data describing images. We aim to design a layout system that will be dependent on user inputs and the displays environment instead of any data that describes the images.
Lightweight interaction method Brignull and Rogers [17], after observing users of their Opinionizer system, recommended that the form of interaction with public displays should be “very lightweight” as requiring a large investment of time can deter people from using the display. We see system benefitting from interaction methods that are intuitive and quick to learn.
The interaction styles and user commands differ between manual and automatic layouts. In a manual layout the commands are direct manipulations of image sizes or image positions. There are commands to aid layout such as showing an overview of the display, or commands to aid collaboration between users to come to a consensus on a layout [38]. On the other hand, commands to automated layouts are abstracted and simplified from their actions such as expressions of interest.
For example, a user of a display may need to tell a manual layout system that they need an image positioned in front of themselves and they must also command the system to enlarge the image because they are at a distance. These are two different commands which both require direct manipulation of a variable. In contrast, the command to an automated layout system could be abstracted to an expression of interest. The user tells the system that they are interested in an image and the system moves and resizes the image on the display with that knowledge in mind. Because of this abstraction the command set is simplified.
27
command set combined with their automation and these advantages reduce the investment of time required in layout and layout commands. Automated layouts do not require an investment in layout and this makes them suitable to be applied in situations where users’ time is limited or users’ cognitive focus needs to be freed from the task of content layout.
28 4 HARDWARE DESIGN FACTORS FOR LAYOUT SYSTEMS
4
Hardware Design Factors for Layout Systems
This chapter explores the hardware for a layout system and is divided into two sections. The screen section covers the possible sizes, environments and technologies of a display screen. The user section considers hardware that could be used to gather information about users such as user position, user gestures and body posture.
4.1
Screen Properties
This section outlines the screen properties that influence the capabilities and limitations of a layout algorithm, such as size, resolution, colour limitations and environment of a screen.
Display Type
Three frequently used methods to produce large displays are with a projector, projectors tiled together, or an array of liquid crystal display (LCD) screens tilted together to form one large display (but with noticeable gaps between them) [52].
Some large computer displays have viewing restrictions and limitations in the colours they can reproduce. Viewing a LCD at an angle can change the colour seen and reduce the intensity of the light being projected at the user [71]. The contrast between colours on projected images can be reduced if the environment they are in is too bright [52].
4.1 Screen Properties 29
Display Type Horizontal Visual Angle
Horizontal Resolution
Pixels per degree of visual angle
Mobile Phone 9° 400 pixels 44.4
Desktop 38° 1680 pixels 44.2
Wall Sized 136° 6144 pixels 45.1
Wall Sized 53° 6144 pixels 115.9
Wall Sized 14° 6144 pixels 438.9
Table 2: Pixels per degree of computer displays users
screen size limits the detail that can be displayed to far viewers.
The visual acuity of an image on the screen is limited by the display size for far users. Content can be increased in size to increase the visual angle of that content, and consequently the visual acuity of that content, but this technique will be limited by the display size.
The visual acuity of an image on the screen is limited by the screen resolution for close users [74]. Using standardised methods of measuring visual acuity, visual acuity has been shown to be inversely proportional to pixel density [20]. As a user approaches a display there will become a stage where the number of pixels a display can show over a user’s visual field is too low and the quality of the image will be lessened and visual acuity decreased.
There is a limit to the amount of detail the human eye can perceive. The human eye has about 180 receptors per degree of visual angle [70]. Ware [70] suggested that 150 pixels per degree is near the limit of a human’s ability to perceive detail. Although, Ware noted that this does not take into account aliasing, grey levels and super-acuities.
30 4 HARDWARE DESIGN FACTORS FOR LAYOUT SYSTEMS
tanB
2 =
S 2D
B =2∗arctan 0.5
2∗1
B =0.6555 ∗180
π
that is a visual angle of 38 degrees. With 1680 pixels horizontally, that is 44.2 pixels per degree. It is clear that this is well below the estimated limits of human vision of 180 receptors per degree.
4.1 Screen Properties 31
Viewing Environment
The environment of a display may influence what are optimal layouts. Some environmental factors that could influence layout are the area that is available to view the display from, the position users will be positioned relative to the display or the restrictions on access to the display.
A likely scenario for many large displays is for them to be flat on a wall and the users to be at the screen height. A variation to this scenario is the users are all on one plane but the display is raised so that close users do not obscure far users’ views.
If a display is enclosed in a room then this can restrict the number of users or the distances and angles users can view the display. The number of likely users could be restricted by the size of the room the display is contained in or the number of people that have access to the display. The size of a room a display is in could restrict the positions a user could be positioned relative to the display.
Information describing a display’s position relative to users may not be needed if user positions can be gathered. If user positions are known then important information such as users’ perspective and if users are obscuring other user’s view can be derived.
32 4 HARDWARE DESIGN FACTORS FOR LAYOUT SYSTEMS
4.2
Lightweight Interaction Methods
The user interaction with automated layouts differs from interaction with other layout systems. There are no commands to directly manipulate the position or size of content, and sometimes the commands are separated or abstracted from their actions.
Large displays present a large physical space for interaction. Users are free to move around this large space and can view the display from a distance. We aim to make an automated layout with an inclusive user experience even of users at a distance therefore they will need to be able to interact from a range of locations. This needs to be considered when reviewing possible interaction methods.
Automated layouts in other domains such as window and document management have mature, standardised way for the user to input information using a mouse and keyboard while on a large display there is a greater range of hardware being proposed for interaction. We review the range of interaction methods that have been previously developed for large display that could be used to determine user interest in images on a large shared display.
4.2 Lightweight Interaction Methods 33
User Location
Our goal for automated layout systems was to have the system adapt layout to user location. User location determines the parts of the screen a user can comfortably view and this makes it an important input in a layout system. User tracking can be achieved using computer vision techniques. Automated layouts with user tracking have been successful deployed [49, 75]. OpenCV, an open source software library, enables the tracking of people and their faces from the frames of a video camera [16]. Distances to faces from the camera can be estimated using the size of the face in the video frame, or multiple cameras can be used to triangulate positions of people detected in video frames [26].
Freehand Pointing and Pointing Devices
Pointing could be used to express interest in content. Researchers have made use of laser pointers and freehand pointing as a means for users to indicate items of interest on displays [69, 56]. Aiming a device at content and pressing a button could express interest in targeted content and a second press of the same button could remove interest. Fitts’ Law models pointing time and describes a logarithmically relationship between distance to target and pointing time, and also a logarithmically relationship between target size and pointing time (see Figure 4.1 on the following page). Fitts’ Law suggests that the time required to move to a target item is small when targets are large (as many items on a large display are) and the large distance between items results in pointing time increasing only logarithmically.
34 4 HARDWARE DESIGN FACTORS FOR LAYOUT SYSTEMS
T = a+b log2
1+ D
W
Figure 4.1: Fitts’ Law: aandbare constants specific to the pointing device. Wis the width of the target measured along the axis of motion. Dis the distance from the starting point to the centre of the target.Tis the average time taken to complete the movement.
Yet on a shared display markers of device orientations may be distracting to other viewers.
Cheng el at. [24] have proposed a user input method where the user holds their finger between their face and the display and indicate a point of input by lining up their finger tip, from their perspective, with the content of interest, so that their finger lies under the point of interest. This interaction style does not require markers on the display for orientation. It is required that the system detects the location of the user’s finger tip and their perspective for this input method. The perspective is taken as a point between a user’s two eyes.
Jota et al. [36] compared the performance of users while using a grabbing gesture, pointing gesture and a mouse in solving a puzzle over three distances close, middle and far while the display size was constant. The grabbing gesture was designed to mimic the moment used when someone reaches for a book on a shelf. Participants performed the fastest using the pointing metaphor over all three visual angles, although the results were not conclusive (p=0.09). Participants favoured the point as their metaphor of choice when rating the techniques in a survey after the experiment.
Personal Devices
4.2 Lightweight Interaction Methods 35
be used to communicate interest in images on a display. For example, optical flow analysis of the video feed or a built in accelerometer can be used to determine the movement of a personal device. Then gestures can be deduced from movement data of the personal device [7].
People could also express interest in content by sending text messages to a display system with their personal device. People are likely to already know how to use their own personal device so it would not be required for them to learn any new device. Sending text messages may require more time for viewers to communicate with the system and this would not be as fluid a way to interact as other techniques like pointing.
Body Posture
Kuno et al. [40] discussed user interaction techniques where the user does not give the computer direct commands but instead the computer reads the user’s actions, body language and unconscious movements for intentions and interests. Similarly, Nakanishi et al. [51] used head orientation to change the layout of a number of sub-windows. The sub-window the user was looking at would increase in size while the user’s head was orientated towards it.
36 4 HARDWARE DESIGN FACTORS FOR LAYOUT SYSTEMS
Bolt et al. [15] created a system where a user’s gaze was used to change the way information flowed to its user. The system was in an office like room with one wall covered in a number of displays. The displays contained a range of video feeds and information so a user would have a large number of information feeds available to view. The system used gaze direction to change the content that was being displayed to the user.
Other Methods
Ning et al. [53] proposed six different ways for users to express interest in content (pointing, slapping hand gesture, body gesture, foot button and touch). The six techniques were designed for users passing by a large display with little time to invest in the display.
Yin and Davis [73] produced technology that can count the number of digits someone is holding up to a camera. This technology could be suited to indication interests to a system. A system could mark content from 1 to 5 for one handed commands or 1 to 10 for two handed commands. Also, holding up digits is a gesture that does not require a user to have any electronic equipment on them, reducing the complexity and cost of a system’s setup.
Touch input is limited to users close to the screen which removes it as a candidate for a universal indication method for interest. It would be possible to enable users close to the screen to input interest with touch but this would require additional commands to be available for users farther from the screen. Touching also obscures content for other users and can mark the surface of a display.
4.3 Conclusion 37
Audiences often clap, cheer and holler when watching sporting events or other events where loud sounds are culturally acceptable. This can also be true of audiences watching similar content on public displays. These audible actions may be expressing enthusiasm, agreement or support and a system that can understand these expressions may be able to make use of them to build a model of its audience. Beusekon et al. suggested that clapping, cheering and waving could be measured by a computer to calculate an audience’s support for an athlete or team in competitive sports [68, 21], and this idea could be extended to viewers of displays . When media is displayed that is liked by users, user could audibly express their support and a display system could use this information prioritise the display of popular media.
4.3
Conclusion
38 5 DESIGN FACTORS FOR LAYOUTS AND LAYOUT TRANSITIONS
5
Design Factors for Layouts and Layout Transitions
The placement of images on large displays is less constrained than on smaller displays. Images can be placed high above users or far to the side of them. There are fewer constraints on the size of images. Images can be enlarged so that it can be seen by viewers far away or an array of content can be shown at smaller sizes. Different images sizes, positions and layout transitions can create layouts with unique aesthetics, moods and characters. We investigate how the three factors size of content, position of content and movement of content, which can all be controlled by a layout system, influence users with the goal of creating an engaging user experience.
This chapter is broken into four parts. First, we discuss techniques to adapt images to user position and consider factors involved in positioning and sizing images for a single user. Second, we expand on the problem of layout for a single user and consider factors involved in image layout for multiple users of a large display. Third, we look at layout transitions, layout responsiveness and animation for when layouts needs to be updated as a result of changes in the display’s audience. Fourth, we consider techniques to manage the layout of images as a whole, such as the grid method and distortion techniques.
5.1
Content Size and Position for Individuals
5.1 Content Size and Position for Individuals 39
on the way a user perceives content. In this section we consider users’ perspective of content in the design of automatic layout systems including optimal visual angle, fixed visual angle and perspective correction of images.
Visualangle is the term for the angle an image subtends to (see Figure 2.1) and we use the termviewerangle to indicate the angle between the normal of a image on a display and the angle to the viewer (see Figure 2.4).
Content Adaptation to User Position
This subsection examines content adaptation to a user’s visual angle so content can be displayed at a range of sizes and for different viewer distances. Content adaptation to visual angle can be used to enhance content’s utility on a large display by extending the range of visual angles content can be shown at.
Assumptions must be made about the visual angle of images for desktop or hand held displays because the user distance and sometimes the ultimate size of content is not known when images size is dependent on the varying device screen size. Lacking this information, content designers must produce content that can be viewed at the range of visual angles they assume content will be viewed at. Mobile-phone interfaces have large text and bold buttons relative to the screen size because it is assumed that the visual angle a 10 centimetre screen subtends to is small. Desktop applications have smaller fonts and buttons as the displays are larger.
40 5 DESIGN FACTORS FOR LAYOUTS AND LAYOUT TRANSITIONS
viewed based on the user distance.
Semantic zooming is changing the size and detail of objects as the area available to display the object changes [59]. The size an object appears to a user does not only depend on the screen space used to display an object but also the distance to the screen. A number of systems have included semantic zooming based on user distance to the display [8, 37, 38, 32] but do not explicitly base semantic zooming on visual angle.
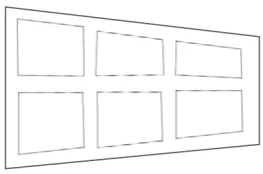
Visual angle affects the amount of detail visible to the human eye and will determine how large the image will appear in a user’s visual field [63]. Using semantic zooming, the amount of information displayed could be increased or decreased as visual angles change. For example, a map could be detailed when the visual angle is large and the map’s detail comfortably perceived. A map could be a simple rendering of text reading “map” when the visual angle is small (see Figure 5.1 on the next page). This would enable a user to gather information about content even when the visual angle is small and allow users to be provided with greater detail when the visual angle is large.
Although, viewers may vary in their distance to the screen at a single time. A display may have viewers close to the screen who would benefit if content is rendered in detail and have viewers far from the screen that will not be able to perceive this detail. This needs to be taken into consideration when adapting content to visual angle. An image could be displayed that contains both low and high detail by having an image within a larger image, such as having a translucent text of a map over a detailed map (see Figure 5.2). The translucent text can be displayed when the system detects a far user, and because the text is translucent the close user will still be able to view the detailed map.
5.1 Content Size and Position for Individuals 41
42 5 DESIGN FACTORS FOR LAYOUTS AND LAYOUT TRANSITIONS
5.1 Content Size and Position for Individuals 43
it is a raster image or vector image [29]. Raster image detail is anchored to a resolution and can only be displayed at limited sizes on the display without defects in the image becoming visible. On the other hand, vector images are re-rendered to different resolutions when resized and provide a clear image whatever the magnification.
Repositioning Content
The closer an image is positioned next to a user the clearer the view of that image the user will have [63, 50]. If the amount of time a user spends using the display is small, swapping viewer positions could be time consuming relative to the time a user views a display. For example, if a user is watching a display only for a number of minutes before moving on but is still required to change his position to comfortably view content.
You et al. employed user location to dynamically adjust the position of images on a large display in a home [75]. Participants found the crossing of each other’s sight-lines when the video feeds did not adjust to user position agitating and/or annoying. Some comments from the participants on crossing other users’ sight-lines were ‘cannot see (my content) clearly’, ‘inconvenient’, ‘difficult’, ‘irritating’ and ‘confusing’.
44 5 DESIGN FACTORS FOR LAYOUTS AND LAYOUT TRANSITIONS
Optimal Visual Angle
Screen space is limited and increasing the size of one image may result in another image being decreased in size. A layout system must divide the screen space among the images. If a user wants to view an image then what size or visual angle should be favoured for that user?
Visual angle affects our ability to recognise objects, to read text and perceive detail [63]. If the visual angle is too small then a person will not be able to perceive enough detail to identify an image. Lindberg and Näsänen [42] found that if icon sizes were displayed below the small visual angle of 0.7 degrees then search times increased significantly.
If the visual angle of an object is large then more detail will be able to be perceived by a user. But the affect that the visual angle of an image, a group of images or the display has on users is more complex and a larger visual angle is not always desirable. Biederman and Cooper [13] performed an experiment to find the optimal visual angle to recognise images and the results suggested 4 to 6 degrees of visual angle (object recognition times were slightly faster within this range).
Gould and Grischkowsky [28] argued that text with large visual angles requires more eye fixations and head movements, resulting in user discomfort and reduced reading speed. Fewer characters will cover the foveal region, the part of the eye necessary for reading and responsible for sharp central vision, and this will increase the number of eye movements required to read all the characters in the text.
5.1 Content Size and Position for Individuals 45
Grischkowsky tested proofreading speeds at visual angles of 6.7, 10.6, 16.0, 24.3, 36.4 and 53.4 degrees. Results showed proofreading speed and accuracy to be nearly invariant between 16 and 36.4 degrees, and proofreading to be reduced at 53.4 degrees. Although, the proofreading test used in this experiment may not generalise to reading comprehension.
There is a limited angle a user can rotate their eyes and move their head, and within this limit is the range of motion that is comfortable and can be performed over time without fatigue. Participant feedback in an experiment involving participants using large, projected displays for daily work suggested that the body orientation required to view content affects what content layouts users find desirable [12]. If the visual angle is too large then a user may be required to move their head to take in the whole image, like a viewer sitting in the front row of a cinema.
Lastly, there are the concerns of the designers of content. Designers may favour one visual angle, or a limited range of visual angles. This may be visual angles where the user can comfortable perceive all the information the content provider wants to present and any other visual angle is suboptimal. One specific visual angle may provide the sense of presence that a content provider wants to achieve or may be the proportion of the visual field the content provider wants to have their image cover.
46 5 DESIGN FACTORS FOR LAYOUTS AND LAYOUT TRANSITIONS
Fixed Visual Angle
Fixed sized content, no matter the user distance from the screen, could be created if content is sized proportionally to the distance a user is from the screen so that a constant visual angle is maintained. An image would be projected at a consistent size on the user’s retina (as was proposed in the E-conic system [50]).
This technique would assign more space to users far from the screen and create similar, more even visual angles among audience members. One disadvantage with this approach is that far users will use more screen space than close users for images with equivalent visual angles, and far users will be more expensive in terms of screen space to maintain. Maintaining this illusion may be difficult with multiple users, as an adjustment in the size of content to accommodate the illusion may not be possible when other parts of the screen are being used by other users.
The benefit of this technique is that a favoured visual angle can be maintained regardless of the user’s position. The visual acuity and the detail that will be able to be perceived will be maintained even as a user moves towards and away from the display.
Perspective Correction of Images
Perspective distortion reduces visual acuity by distorting content [50]. However, the perspective distortion of an image can be reduced for a single viewer by transforming the image to a convex quadrilateral, specific to a viewer’s perspective, with a linear transformation [50].
5.1 Content Size and Position for Individuals 47
Figure 5.3: (a) Two people view a square image on a display. (b) The two quadrilaterals that would minimise perspective distortion for the two viewers. (c) The linear interpolation of the two quadrilaterals. (d) The resulting rectangular rendering of the image compared to the original square image.
in Figure 5.3, (a). Two users are viewing the same square image, one to the left of the display and the other to the right. The perspective distortion can be removed for only one of the viewers by rendering the square image as either the first quadrilateral or the second quadrilateral (the two quadrilaterals are shown overlapping in Figure 5.3, (b)). A compromise must be made between these two different distortions if the image is to be rendered in a way that is unbiased for both viewers.
48 5 DESIGN FACTORS FOR LAYOUTS AND LAYOUT TRANSITIONS
quadrilaterals again in Figure 5.3, (b). Both the quadrilaterals have been stretched along the horizontal axis. An alternative method would be to linearly interpolate the matching points in the two optimal quadrilaterals (c). This interpolation would create a rectangle and this rectangle would result in corrected distortion along the horizontal axis for both viewers, unlike the square rendering (d).
However, there are complications with perspective correction. Most images on a computer display, and the display itself, are rectangular. Removing perspective distortion renders a rectangular image as a quadrilateral and this may complicate layout methods designed for rectangular items or consistent shapes (the rendered shape of the image will need to be updated as its viewer’s perspective changes). This technique is less effective when there is more than one viewer of an image. LCDs have a reduced image quality when viewed at an angle [71], and perspective correction cannot correct this reduction in the clearness of vision. Lastly, distortion removal is most effective when users are at an angle to the content they are viewing, and if users are commonly viewing images directly then perspective correction will have limited application.
5.2
Handling Multiple Users
5.2 Handling Multiple Users 49
Users Position and Screen Space
Here we outline how user position indicates the amount of screen space required to achieve a level of visual acuity and how user positions and screen size determine the amount of information that can be perceived on a large display. By defining the relationship between user position and screen space requirements we can help find solutions to allocating screen space on a display with multiple users.
Consider a user viewing a large 5 metre wide screen at a distance of 1 metre. The visual angle would be close to 135 degrees which would allow for a range of content to be placed in that user’s visual field. Then consider a user 30 metres from the same screen with a visual angle close to 10 degree. The display would cover as much of the user’s visual field as mobile phones screen held at arm’s length, and this would restrict the amount of content that could be shown, like the small screen of a mobile phone. We consider users such as the one in this scenario to have high “user cost”.
Each user has a cost in terms of screen space that is determined by their position relative to the screen. High-cost users require a lot of screen space to display information. While a low-cost user requires little screen space to display an equivalent amount of information.
There are two variables that can be derived from a user position that affect visual acuity (the clearness of vision). They are visual angle and perspective distortion.
50 5 DESIGN FACTORS FOR LAYOUTS AND LAYOUT TRANSITIONS
space is required to render an enlarged image. This is how visual angle indicates the screen space required to achieve a level of visual acuity.
The re-rendering of content to remove perspective distortion also requires additional screen space [50]. Removing perspective distortion increases the bounding box of a rectangle image (the bounding box is the smallest rectangle that encapsulates a polygon). The area of the bounding rectangle increases the greater the angle the viewer is from the centre of the window. While, a viewer angle of zero does not increase the bounding rectangle.
Example Low-cost User A user positioned close to the display and directly in front of the display.
Example High-cost User A user positioned far from the display and at an angle to the display.
The position of users places constraints on the amount of information that can be displayed for viewers. Viewers far from the screen require content to be enlarged if a level of visual acuity is to be achieved. Viewers at an angle to content require additional screen to be used if perspective distortion is to be removed.
5.2 Handling Multiple Users 51
Figure 5.4: User cost in terms of screen space can be measured on a continuum.
Conflicts of Interest between Users
The screen space on a display is limited and conflicting interests between viewers will arise over the use of that space. A conflict of interest may arise between viewers when one viewer favours content to be displayed larger than it currently is and this is not possible without reducing the size of content being viewed by another user. Users may find the system unfavourable to them if content they are viewing becomes reduced in size or is repositioned to accommodate other users. The limited screen space available on a display needs to be managed so that competing interests are resolved. Any solution will involve compromise by some viewers.
Two factors that affect conflicts of interest over space usage:
1. Number of overlapping interests between users
2. The screen cost of users
52 5 DESIGN FACTORS FOR LAYOUTS AND LAYOUT TRANSITIONS
will diverge.
Viewer positions will influence the amount of screen space required to achieve a level of visual acuity. A user close to the screen using little screen space would achieve similar visual acuity to a viewer farther from the screen using a large amount of screen space. Unfortunately, the user far from the screen, who uses a greater amount of screen space, is more likely to create a conflict of interest between users.
We are considering automated layouts that do not require human assistance, therefore it is not possible to ask users to resolve conflicts themselves. An algorithm must weigh the various factors and come up with a solution. We categorise automated solutions to this problem into two categorise. One category focuses on solutions that favour the individual and the other focuses on solutions that favour the group.
Solutions focusing on individuals ensure that requirements for individuals are met before other areas of layout are considered. For example, this may involve ensuring that for each user there is an image of interest to them that meets a set level of visual acuity so that each user has at least one image that is visible to them. A system that favours the individual may minimise sharing and treat the large display as a display divided up into smaller personal displays.
5.2 Handling Multiple Users 53
favourable amount of space.
A system could use both individual and group solutions to resolve conflicts. For example, first images could be positioned and sized so that each user has an image of interest with a level of visual acuity. After this condition had been fulfilled the system could size images based on their popularity.
User Distance and Content Sharing
Users close to the screen have small screen cost, therefore a smaller amount of screen space needs to be used to display content for them to achieve a level of visual acuity. If a user was farther away then their personalised content (content only of interest to them) would monopolise more of the screen and that space would not be available to other users. When considering user costs, content can be personalised for close users more easily than for far users and it is more efficient in terms of screen space to have close users viewing personalised content.
54 5 DESIGN FACTORS FOR LAYOUTS AND LAYOUT TRANSITIONS
Content Ownership
A system will need to provide feedback to indicate what images the user has selected as being of interest to them but at the same time not obscure images or distract other users with this feedback. Each user could be assigned a colour and the images they have selected could be marked with the colour unique to them. A head shot of the user could be taken with a tracking camera [51] and their face could be shown next to their images of interest. Or a user may be able to determine if a system has detected their interests from the systems
behaviour (e.g. repositioning images next to the user) and therefore there would be no need for additional feedback.
Wedge and halo visualisations can be used to show both direction and distance of off-screen locations and have been implemented on hand-held devices (see Figure 5.5) [30]. These visualisations could be ported to large screens to indicate the location of images on a large display that are not viewable from a user’s position, to help indicate their location on the display, and appear in front of a user to point to images of interest.
Grouping of Viewers
5.2 Handling Multiple Users 55
Figure 5.5: Wedges (left) and Halos (right) are used to indicate the direction of and distance to objects off the screen.
56 5 DESIGN FACTORS FOR LAYOUTS AND LAYOUT TRANSITIONS
5.3
Layout Transitions
In the two preceding section, we considered what would be favourable sizes and positions for images on a large display to create an image layout. This section deals with how best to transition between layouts and when transitions should occur. We consider what advantages are gained when transitioning layouts and consider potential costs involved in layout transitions.
Responsiveness to Changes in the Audience
Viewers of a large display may be viewing content from changing locations. New users will be approaching the display while other users will lose interest in the display. There are many scenarios of how a display’s audience can change and when they do a layout system may consider transitioning the layout and dynamically adjusting to these changes.
However, the amount of change in the layout of content should be balanced with the need to adjust content as a system needs to consider how the movement of content will affect users viewing experience. Users may be agitated if content they are viewing is moved too frequently or unpredictably. Additional, users need to be able to track the movement of content of interest as it moves around the display so that they can locate information after it has been repositioned.
5.3 Layout Transitions 57
or a quick response many not be possible when parts of the display are being used by other users. The amount of change in the layout of content will need to be balanced with the need to adjust content.
Maglio and Cambell [47] investigated amount of user distraction created by the animation of peripheral content and evaluated different ways of displaying peripheral information. Maglio and Cambell recommended that animated updates be kept to a minimum and, if used, they should not be continuous. They argued that discrete animation is more appropriate than continuous updates and content should changed with a quick animation and then pause until the next animation. Maglio and Cambell work with peripheral information suggested that it would be best to update a layout with quick animation, and then pause until another update is required, rather than to continuously update the layout, to reduce the amount of distraction updates may cause.
Another perspective on the trade off between calmness and responsiveness is topological consistency [45]. Topological consistency is the idea that changes in layout should be proportional to changes in input. A new layout cannot be calculated without regard to the previous layout. Minor changes in the input (e.g. user locations and interests) should lead to minor changes in the layout. Lüders et al. [45] referred to this as topological consistency, a measure of change from one layout to the next in relation to the change in input.
System Metaphors
58 5 DESIGN FACTORS FOR LAYOUTS AND LAYOUT TRANSITIONS
users understand a system’s behaviour by relating it to concept that is intuitive or familiar to a user [25]. If a user can understand the mechanics of the concrete metaphor then they can apply that understanding to the layout system.
The metaphors that can be applied to a system’s behaviour depends on the algorithm chosen to implement the system. A machine learning algorithm does not lend itself to a simple metaphor as the position and movement of content is determined by a complex algorithm that a user could not comfortable mentally model. An illusion will need to be created for the movement to appear to behave like objects familiar to a user.
On the other hand, force based algorithms model the movement of physical objects. The movement of physical objects can be observed in everyday life. The human mind is practised in predicting the behaviour of velocity, acceleration and pressure on objects. If the movement of images is based on physical forces, content will move, expand and collide in a way familiar to viewers. The system’s state will be observable through image’s velocity, momentum and position. Viewers can take their knowledge about the physical world and apply it to the system so they can anticipate how their actions will affect the system. Layouts based on these physical behaviours may be easier for a user to mentally model than other algorithms.
5.3 Layout Transitions 59
Animated Image Movement
Animation of the movement and resizing of content is an important addition to layout systems. Layout transitions without fading or smooth resizing may be unappealing, disorientating or distracting. To make for an engaging experience we can aim for the transitions to be aesthetically appealing, allow for focused attention and to be endurable as these are attributes are correlate with engagement [55].
Not only could transition animations be engaging but could also provide utility by allowing a user to track the movement of images around the large display. Adding trails behind the movement of content could help users track the movement of content. The movement of objects can be hard for users to follow on a large screen where objects may move to a location that is outside of a user’s visual field. Adding trails to the movement of content on wall sized displays may allow for users to follow the movement of content more easily. Trails have been effective in helping users locate windows on large desktop displays [33].
We can break image movements into categories. First there is resizing and repositioning to an adjacent position. These image transitions allow for smooth interpolation between current and target size and position that do not result in another image being occluded (see Figure 5.6). Second, there are image transitions where the image needs to move to another location. If these transitions are interpolated they may result in other images being occluded (see Figure 5.7).
60 5 DESIGN FACTORS FOR LAYOUTS AND LAYOUT TRANSITIONS
Figure 5.6: Two interpolations that do not occlude other images. (le f t) Image repositioning that does not cross the path of a static image. (right) Image resizing, which does not cross the path of a static image.
[image:67.595.187.397.483.648.2]5.3 Layout Transitions 61
Figure 5.8: Four interpolation transitions that change the shape, rendering order or opacity of an image as it transitions Each cell in a column shows the transitioning image in blue along with the static image it is passing through in red.
and target position b) Moving image’s fade is proportional to its distance from the middle of its interpolation. c) Moving image’s size is proportional to its distance from the middle of its interpolation. d) Moving image is rendered behind/after static image. e) No interpolation (the image fades out from its current location and then fades into its target location).