A Multi-Band Speech Enhancement Algorithm Exploiting
Iterative Processing for Enhancement of Single Channel
Speech
Navneet Upadhyay1, Abhijit Karmakar2
1Department of Electrical and Electronics Engineering, Birla Institute of Technology & Science, Pilani, India; 2Integrated Circuit Design Group, CSIR-Central Electronics Engineering Research Institute, Pilani, India.
Email: [email protected], [email protected]
Received January 20th, 2013; revised February 22nd, 2013; accepted March 3rd, 2013
Copyright © 2013 Navneet Upadhyay, Abhijit Karmakar. This is an open access article distributed under the Creative Commons Attribution License, which permits unrestricted use, distribution, and reproduction in any medium, provided the original work is properly cited.
ABSTRACT
This paper proposes a multi-band speech enhancement algorithm exploiting iterative processing for enhancement of single channel speech. In the proposed algorithm, the output of the multi-band spectral subtraction (MBSS) algorithm is used as the input signal again for next iteration process. As after the first MBSS processing step, the additive noise transforms to the remnant noise, the remnant noise needs to be further re-estimated. The proposed algorithm reduces the remnant musical noise further by iterating the enhanced output signal to the input again and performing the operation repeatedly. The newly estimated remnant noise is further used to process the next MBSS step. This procedure is iterated a small number of times. The proposed algorithm estimates noise in each iteration and spectral over-subtraction is exe- cuted independently in each band. The experiments are conducted for various types of noises. The performance of the proposed enhancement algorithm is evaluated for various types of noises at different level of SNRs using, 1) objective quality measures: signal-to-noise ratio (SNR), segmental SNR, perceptual evaluation of speech quality (PESQ); and 2) subjective quality measure: mean opinion score (MOS). The results of proposed enhancement algorithm are compared with the popular MBSS algorithm. Experimental results as well as the objective and subjective quality measurement test results confirm that the enhanced speech obtained from the proposed algorithm is more pleasant to listeners than speech enhanced by classical MBSS algorithm.
Keywords: Speech Enhancement; Multi-Band Spectral Subtraction; Iterative Processing; Remnant Musical Noise
1. Introduction
Speech is the most prominent and primary mode of in- teraction between human-to-human and human-to-ma- chine communications in various fields such as automatic speech recognition and speaker identification [1]. The present day speech communication systems are severely degraded due to various types of interfering signals which make the listening task difficult for a direct listener and cause inaccurate transfer of information [2]. Therefore, to obtain near-transparent speech communication in appli- cations such as in mobile phones, noise suppression or enhancement of degraded speech is one of the main re- search endeavors in the field of speech signal processing over the last few decades. The main focus of speech en- hancement research is to minimize the degree of distor- tion of the desired speech signal and to improve one or
more perceptual aspects of speech, such as the speech quality and/or intelligibility of the processed speech [3,4]. These two features, quality and intelligibility, are how- ever, uncorrelated and independent of each other in a certain context. For example, a very clean speech of a speaker in a foreign language may be of high quality to a listener but at the same time it will be of zero intelligibil- ity. Therefore, a high quality speech may be low in intel- ligibility while a low quality speech may be high in intel- ligibility [5].
significant field of research interest because of its simple implementation and easy computation. Single channel speech enhancement method uses only one microphone to collect noisy data but no additional information about the degrading noise and the clean speech is available. The estimation of the spectral magnitude from the noisy speech is easier than the estimate of both magnitude and phase. In [6], it is revealed that the short-time spectral magnitude (STSM) is more important than phase infor- mation for intelligibility and quality of speech signals.
The spectral subtraction proposed by Boll [7], is one of the most widely used methods based on the direct es- timation of STSM. The main attraction of spectral sub- traction method is: 1) Its relative simplicity, in that it only requires an estimate of the noise spectrum, and 2) Its high flexibility against the variation of subtraction parameters. Despite its capability of removing background noise, spectral subtraction [7] introduces perceptually noticeable spectral artifacts, known as remnant musical noise, which is composed of un-natural artifacts with random frequencies and perceptually annoys the human ear. This noise is caused due to the inaccuracies in the short-time noise spectrum estimate and it faces difficul- ties in pause detection. In recent years, a number of speech enhancement algorithms have been developed to deal with the modifications of the spectral subtraction method to combat the problem of remnant musical noise artifacts and improve the quality of speech in noisy en- vironments. In [7], magnitude averaging rule is proposed. In [8], the over-subtraction of noise is proposed and de- fined a spectral floor to make remnant musical noise in- audible. In [9], a speech enhancement algorithm by in- corporating the multi-band model in frequency domain is proposed.
This paper proposes a novel algorithm for suppressing the remnant noise and enhancement of single channel speech. In the proposed algorithm, the output of multi- band spectral subtraction (MBSS) is used as the input signal again for next iteration process. After the MBSS algorithm, the additive noise is transformed to remnant noise. The remnant noise is re-estimated in each iteration and spectral over-subtraction executed separately in each band. This procedure is iterated a small number of times. The performance of enhanced speech is characterized by a trade-off between the amount of noise reduction, speech distortion, and the level of remnant noise.
The rest of paper is structured as follows. Section 2 describes the principle of spectral subtraction method for speech enhancement [7], the spectral over-subtraction (SOS) [8], and MBSS [9] which serve as a reference of our proposed algorithm platform. In Section 3, the pro- posed enhancement algorithm, multi-band spectral sub- traction algorithm exploiting iterative processing (IP- MBSS) is introduced for suppression of remnant musical
noise. Section 4 reports the experimental results and per- formance evaluation. The conclusion is drawn in Section 5.
2. Principle of Spectral Subtraction Method
The spectral subtraction is one of the most popular and computationally simple methods for effectively suppress- ing the background noise from the noisy speech as it in- volves a single forward and inverse transform. The first comprehensive spectral subtraction method, proposed by Boll [7], is based on non-parametric approach, which simply needs an estimate of noise spectrum and used for both speech enhancement and recognition.In real-world listening environments, the speech signal is mostly corrupted by additive noise [3,7]. Additive noise is typically the background noise and is uncorre- lated with the clean speech signal. The background noise can be of stationary type, such as white Gaussian noise (WGN) or of non-stationary or colored type. The speech degraded by background noise is termed as noisy speech. The noisy speech can be modeled as the sum of the clean speech and the random noise [3,7] as
,
0, 1y n s n d n n N
(1)where is the discrete-time index and is the num-
ber of samples in the signal. Here,
n N
,s ny n , and
d n are the sample of the discrete-time signal of
noisy speech, clean speech and the noise, respectively. As the speech signal is non-stationary in nature and con- tains transient components, usually the short-time Fourier transform (STFT) is used to divide the speech signal in small frames for further processing, in order to make it stationary or quasi-stationary over the frames. Now rep-resenting the STFT of the time windowed signals by
th n
,
W
Y DW , and SW
, (1) can be written as [3,7],
W W W
Y S D
(2)where is the discrete frequency index of the frame.
The spectral subtraction method mainly involves two stages. In the first stage, an average estimate of the noise spectrum is subtracted from the instantaneous spectrum of the noisy speech. This is termed as basic spectral sub- traction step. In the second stage, several modifications like half-wave rectification (HWR), remnant noise re- duction and signal attenuation are done to reduce the signal level in the non-speech regions. In the entire proc- ess, the phase of noisy speech is kept unchanged be- cause it is assumed that the phase distortion is not per- ceived by human auditory system (HAS) [6]. Therefore, the STSM of noisy speech is equal to the sum of STSM of clean speech and STSM of random noise without the information of phase and (2) can be expressed as
W W W
where Yw
Yw
exp
jy
and y
is thephase of the noisy speech. To obtain the short-time
spec-trum of noisy speech, Yw
is multiplied by itscom-plex conjugate Yw
. In doing so, (2) become
2
2 2 *
w
w w w w w w
Y
S D S D S D
(4)
Here Dw
and
w
S are the complex conju-
gates of Dw
and Sw
respectively. The terms
2
2, ,
w w
Y S and Dw
2, are referred to as theshort-time spectrum of noisy speech, clean speech, and
random noise, respectively. In (4), the terms Dw
2,
w w
S D and Sw
Dw cannot be obtained
directly and are approximated as, E
Dw
2
,
E Sw Dw and E
w w
S D , where E
denotes the ensemble averaging operator. As the additive noise is assumed to be zero mean and orthogonal with
the clean speech signal, the terms E
Sw
Dw
and E
Sw
Dw
reduce to zero [3]. Therefore, (4)can be rewritten as
2
2
2ˆ ˆ
w w w
S Y D (5)
where Sˆw
2 and
2 w
Y is the power spectrum of
estimated speech and the noisy speech, respectively. The
2ˆ w
D is the average noise power, normally esti-
mated during speech pauses.
In spectral subtraction method, it is assumed that the speech signal is degraded by additive white Gaussian noise (AWGN) with flat spectrum. In this method, the subtraction process needs to be carried-out carefully to avoid any speech distortion. The spectra obtained after subtraction process may contain some negative values due to inaccurate estimation of the noise spectrum. Since the spectrum of estimated speech can become negative due to over-estimation of noise, but it cannot be negative, therefore a HWR or full-wave rectification (FWR) is introduced. Thus, the complete power spectral subtrac- tion algorithm is given by
2
2
2 2
ˆ
ˆ ,if ˆ
0, else
w
w w w w
S
Y D Y D
2
(6)
As the human perception is insensitive to phase [6], the enhanced speech spectrum can be obtained with phase of noisy speech and the enhanced speech is recon-
structed by taking the inverse STFT (ISTFT) of the en- hanced spectrum using the phase of the noisy speech and overlap-add (OLA) method, can be expressed as
ˆ
ˆw ISTFT w exp
s n S j y (7)
On the contrary, a generalized form of spectral sub- traction method (5) can be obtained by altering the power
exponent from , which determines the sharpness
of the transition.
2 tob
ˆ b b ˆ b,
w w w
S Y D b0 (8)
where b2 represents the power spectrum subtraction
and b1 represents the magnitude spectrum subtrac-
tion.
The drawback of spectral subtraction method is that it suffers from some severe difficulties in the enhancement process. From (5), it is clear that the effectiveness of spectral subtraction is heavily dependent on accurate noise estimation, which additionally is limited by the performance of speech/pause detectors. When the noise estimate is less than perfect, two major problems occur, remnant residual noise, referred as musical noise, and speech distortion.
2.1. Spectral Over-Subtraction Algorithm
An improved version of spectral subtraction method was proposed in [8] to minimize the annoying musical noise and speech distortion. In this algorithm, the spectral sub- traction method [7] uses two additional parameters, namely, over-subtraction factor, and noise spectral floor parameter [8]. The algorithm is given as
2
2 2
2
2
2
ˆ
ˆ 1
ˆ ,if
ˆ , else
w
w
w w
w w
S
D
Y D
Y
D
(9)
with 1 and 0 1.
The over-subtraction factor controls the amount of
noise power spectrum subtracted from the noisy speech power spectrum in each frame and spectral floor pa-
rameter prevent the resultant spectrum from going
below a preset minimum level rather than setting to zero.
The over-subtraction factor depends on a-posteriori seg-
mental SNR. The over-subtraction factor can be calcu- lated as
min 00
max
SNR SNR
(10)
dB and 0
04
is the desired value of at . These values are estimated by experimental trade-off results. The relation between over-subtractionfactor and SNR is shown in Figure 1.
0 dB SNR
This implementation assumes that the noise affects the speech spectrum uniformly and the subtraction factor subtracts an over-estimate of noise from noisy spectrum. Therefore, for a balance between speech distortion and remnant musical noise removal, various combinations of
and give rise to a trade-off between the amount
of remnant noise and the level of perceived musical noise.
For large value of , a very little amount of remnant
musical noise is audible, while with small , the rem-
nant noise is greatly reduced, but the musical noise be- comes quite annoying. Therefore, the suitable value of
is set as per (10) and 0.03.
This algorithm reduces the level of perceived remnant noise, but background noise remains present and en- hanced speech is distorted.
2.2. Multi-Band Spectral Subtraction Algorithm
In real-world listening environment, the noise does not affect the speech signal uniformly over the whole spec- trum. Here, some frequencies are affected more ad- versely than others, which eventually mean that this kind of noise is non-stationary or colored.
To take into account the fact that real-world noise af- fects the speech spectrum differently at various frequent- cies, a multi-band linear frequency spacing approach to spectral over-subtraction was presented in [9], which is the non-linear spectral subtraction approach.
In this scheme, the noisy speech spectrum is divided
into K K
4
th i
non-overlapping uniformly spaced fre- quency bands, and spectral over-subtraction is applied independently in each band. The multi-band spectral sub- traction algorithm re-adjusts the over-subtraction factor in each band. Thus, the estimate of the clean speech spec-
trum in the band is obtained by
-100 -5 0 5 10 15 20 25
[image:4.595.312.540.382.487.2]1 2 3 4 5 6 SNR [dB] O v e r-s ubtr a c ti on f a c tor
Figure 1. The relation between over-subtraction factor and SNR.
2 2 2 2 2 2 1 ˆ ˆ ˆ ,if , , else ii i i i i i
i
i i
S
Y D S Y
Y k k (11)
where ki and ki1 are the beginning and ending fre-
quency bins of the ith frequency band, i is the band
specific over-subtraction factor of the band, which is
the function of segmental SNR of the frequency band
th i th i
SNRi
th i
and provides a degree of control over the noise subtraction level in each band. The segmental SNR of
the frequency band
SNRi
can be calculated as
1 1 2 10 2SNR dB 10 log
ˆ i i i i k i k i k i k Y D
(12)
The band specific over-subtraction can be calculated
using Figure 1 and the value of parameters is given in
Section 2.1 as
max min min max max min max min min max min max ,if SNR SNR
SNR SNR ,
SNR SNR
if SNR SNR SNR
,
if SNR SNR
i i i i i (13)
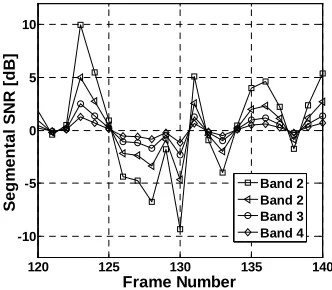
The result of an implementation of four band MBSS [9] with estimated segmental SNR of four frequency bands {60 Hz ~ 1 kHz (Band1), 1 kHz ~ 3 kHz (Band2), 2 kHz ~ 3 kHz (Band3), 3 kHz ~ 4 kHz (Band4)} of noisy
speech spectrum is shown in Figure 2. It can be seen
120 125 130 135 140
[image:4.595.89.252.559.707.2]-10 -5 0 5 10 Frame Number Seg m e n ta l S NR [ d B] Band 2 Band 2 Band 3 Band 4
[image:4.595.339.505.564.709.2]from the figure that the segmental SNR of the low fre- quency bands (Band1) is significantly higher than the segmental SNR of the high frequency bands (Band4) [9].
iterative processing [11]. The iterative processing is a technique in which the speech enhancement procedure is executed on the estimated speech that is taken as the in- put and processed repeatedly to obtain the further en- hanced speech and thus reducing the remnant noise. Therefore, the reduction of remnant musical noise can be achieved by estimating noise from processed speech in each iteration and determines the quality and intelligibil- ity of the enhanced speech. The iterative method is mo- tivated by Wiener filtering method [6,11,12] which is one of the speech enhancement techniques.
The i is an additional band subtraction factor that
can be individually set for each frequency band to cus- tomize the noise removal process and provide an addi- tional degree of control over the noise subtraction level
in each band. The values of i [9] is empirically calcu-
lated as most of the speech energy is concentrated below 1 kHz and set to
1, 1 kHz
2.5, 1 kHz 2 kHz 2
1.5, 2 kHz 2
i
s
i i
s i
f
f f f f
(14)
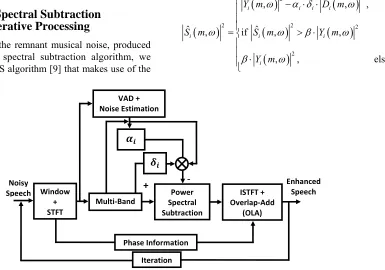
If we regard the process of noise estimation and the MBSS as a filtering step, then the output signal of the filter is used not only for designing the filter but also as the input signal of the next iteration process. More im- portantly, this filter can be refreshed adaptively by re- estimating the remnant noise to improve the speech qual- ity and intelligibility effectively [11]. The block diagram of iterative processing based multi-band spectral subtrac-
tion algorithm (IP-MBSS) is illustrated in Figure 3.
Here fi is the upper bound frequency of the band
and
th i
s
f is the sampling frequency. The motivation for
using smaller values of i for the low frequency bands
is to minimize speech distortion, since most of the speech energy is present in the lower frequencies. Both factors,
i
and i can be adjusted for each band for different
speech conditions to get better speech quality.
If denotes the iterations number, then let us as-
sume that the noisy speech signal at the iteration
step is given by
m
th m
,
,
,
,
0,y m n s m n d m n n N1
(15)As the real-world noise is highly random in nature, improvement in the MBSS algorithm for reduction of WGN is necessary. But the performance of MBSS algo- rithm is better than spectral subtraction method [7] and SOS algorithm [8]. The block diagram of MBSS algo- rithm is shown in [10].
Here, y(m, n), s(m, n), and d(m, n) are the sample
at iteration step of the discrete-time signal of noisy
speech, clean speech and the noise respectively. The iteration step of the MBSS algorithm is obtained as
th n th
m
th m
2 2
2 2 2
2
ˆ
, ,
ˆ , if ˆ , ,
, , els
i i i i
i i i
i
Y m D m
S m S m Y m
Y m
,
e
3. Multi-Band Spectral Subtraction
Exploiting Iterative Processing
In order to reduce the remnant musical noise, produced by the multi-band spectral subtraction algorithm, we have used the MBSS algorithm [9] that makes use of the
Noisy Speech
Multi-Band
Phase Information +
ISTFT + Overlap-Add
(OLA) Window
+ STFT
Power Spectral Subtraction
Enhanced Speech
-VAD + Noise Estimation
[image:5.595.137.522.449.719.2]Iteration
where ki ki1 (16)
2
2
2ˆ 1, ˆ , ,
i i i
S m S m Y m (17)
where S mˆi
,
2,Y mi
,
2,and D mˆi
,
2 is thepower spectrum of estimated speech, noisy speech and
estimated noise power in the band at the itera-
tion step, respectively. In the
iteration proc-essing, the output signal th
i mth
th1
m
ˆ ,
i
S m obtained after the
iteration is set as the input signal again as th
m
1,
ˆ ,y m n s m n
(18)In this algorithm, the noise spectrum, that is used for each iteration, is estimated from the noise component that remained after the iterative processing of the previ-
ous stage. Here, the noise component of y m
1,n
becomes the remnant noise component that could not be
suppressed by the MBSS at iteration. As the
amount of the noise component is reduced in each MBSS processing step, increasing the number of iterations in this method will reduce the amount of noise, progres- sively.
th m
The number of iteration steps is the most important parameter of this algorithm which affects the perform- ance of the speech enhancement system [11,13]. The segmental SNR at the end of each iteration step depends
on over-subtraction factor and it increases with the
number of iterations.
4. Experimental Results and Performance
Evaluation
This section presents the experiments results and per- formance evaluation of the proposed enhancement algo- rithm as well as a comparison with the conventional MBSS algorithm. For simulations, we have employed MATLAB software as the simulation environment. The clean speech and noisy speech samples have been taken from NOIZEUS corpus speech database [14]. The NO- IZEUS database is composed of 30 phonetically-bal- anced sentences belonging to six speakers, three male and three female, degraded by seven different real-world noises at different levels of SNRs. A total of four differ- ent utterances pronounced by male speakers and female speaker are used in our evaluation.
Noise signals have different time-frequency distribu- tions, and therefore a different impact on speech. For our purpose, the sentences are degraded with seven types real-world noises and white Gaussian noise, at varying
SNR levels i.e. 0 dB to 15 dB in steps of 5 dB. The
real-world noises are car, train, restaurant, babble, airport, street, and exhibition. The performance of the proposed enhancement algorithm is tested on such noisy speech samples.
For our enhancement experiments, the 8 kHz sampled speech signals are quantized into digital signal with 16-bit resolution. The frame size is chosen to be 256 (32 ms), with 50% overlapping. The sinusoidal Hamming window with size 256 is applied to the noisy signal. The noise estimate is updated during the silence frames by using averaging (20 frames) with the value of smoothing factor for noise power spectral density estimation is 0.9.
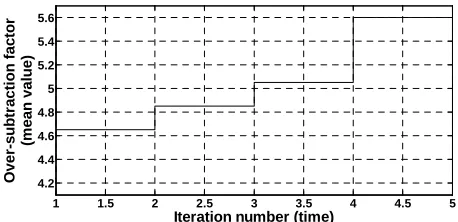
The iteration time is an important factor of the pro- posed algorithm, IP-MBSS, which effects on the per- formance of speech enhancement. In order to explore the relationship between the performance of speech en- hancement and the iteration times, the variation of the
mean over-subtraction factor
of the car speechwith iteration times are shown in Figure 4. It can be seen
from the figure that the increases as the iteration
number increases, which suggest the larger iteration number corresponds to better speech enhancement with less remnant noise. However, both the speech waveforms and the speech spectrogram suggest that the larger itera- tion number would eliminate part of the normal speech component to some extent while it works effectively for reducing the remnant noise. Therefore, the iteration number for the car speech is set to 2 to 3 and the value of other parameters have been taken as same as the refer- ence algorithm, MBSS. The signal waveforms and spec- trograms of clean, noisy and enhanced speech signals
were given in Figures 5-11.
To evaluate the performance of proposed enhancement algorithm, the objective quality and subjective quality measures are used. The objective quality measure are SNR, segmental SNR (Seg.SNR), and perceptual evalua- tion of speech quality (PESQ) while the subjective mea- sure is the mean opinion score (MOS).
4.1. Objective Measure
1)Signal-to-noise ratio: SNR is defined as the ratio
of the total signal energy to the total noise energy in the utterance. The following equation is used for evaluation of SNR results of enhanced speech signals
1 1.5 2 2.5 3 3.5 4 4.5 5
4.2 4.4 4.6 4.8 5 5.2 5.4 5.6
Iteration number (time)
O
v
e
r-s
ubt
ra
c
ti
on f
a
ct
or
(m
ean
valu
e
[image:6.595.308.537.597.708.2])
Time (Second)
Fr
e
quen
c
y
(
k
H
z
)
0 2000 4000 6000 8000 10000
0 0.2 0.4 0.6 0.8 1
Time (Seconds)
Fr
e
que
nc
y
(k
H
z
)
0 2000 4000 6000 8000 10000
0 0.2 0.4 0.6 0.8 1
Time (Second)
Fr
equency (
k
H
z
)
0 2000 4000 6000 8000 10000
0 0.2 0.4 0.6 0.8 1
Time (Seconds)
Fr
e
q
u
e
nc
y (
k
H
z
)
0 2000 4000 6000 8000 10000
0 0.2 0.4 0.6 0.8 1
Time (Second)
Fr
eq
uen
c
y
(k
H
z
)
0 2000 4000 6000 8000 10000
0 0.2 0.4 0.6 0.8 1
Time (Seconds)
Fr
e
quenc
y (k
H
z
)
0 2000 4000 6000 8000 10000
0 0.2 0.4 0.6 0.8 1
Time (Second)
F
req
ue
ncy
(kHz)
0 2000 4000 6000 8000 10000
0 0.2 0.4 0.6 0.8 1
Time (Seconds)
Fr
e
q
ue
nc
y (
kHz)
0 2000 4000 6000 8000 10000
0 0.2 0.4 0.6 0.8 1
Time (Second)
Fr
e
que
nc
y
(k
H
z
)
0 2000 4000 6000 8000 10000
0 0.2 0.4 0.6 0.8 1
Time (Seconds)
Fr
eque
nc
y (k
H
z
)
0 2000 4000 6000 8000 10000
0 0.2 0.4 0.6 0.8 1
Time (Second)
Fr
eque
nc
y (k
H
z
)
0 2000 4000 6000 8000 10000
Time (Seconds)
Fr
e
que
nc
y
(K
H
z
)
0 2000 4000 6000 8000 10000
0 0.2 0.4 0.6 0.8 1
Time (Second)
Fr
eq
ue
n
cy (k
H
z
)
0 2000 4000 6000 8000 10000
0 0.2 0.4 0.6 0.8 1
Time (Seconds)
Fr
e
q
ue
n
c
y
(
k
H
z
)
0 2000 4000 6000 8000 10000
0 0.2 0.4 0.6 0.8 1
Time (Second)
Fr
eque
nc
y (k
H
z
)
0 2000 4000 6000 8000 10000
0 0.2 0.4 0.6 0.8 1
Time (Second)
Fr
eque
nc
y (k
H
z
)
0 2000 4000 6000 8000 10000
0 0.2 0.4 0.6 0.8 1
Time (Seconds)
Fr
equen
cy (kH
z
)
0 2000 4000 6000 8000 10000
[image:8.595.88.509.85.415.2]0 0.2 0.4 0.6 0.8 1
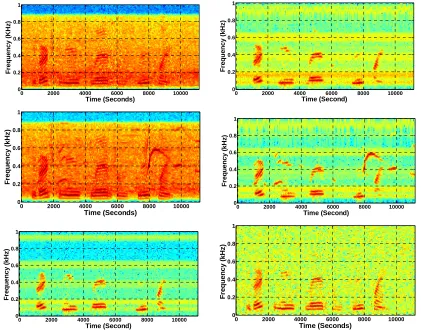
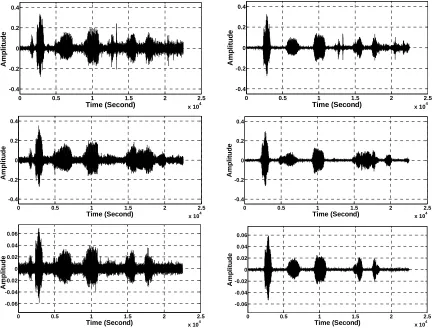
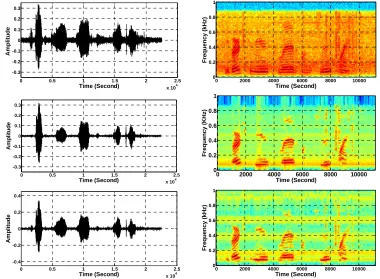
Figure 5. Speech spectrograms of sp1 utterance, “The birch canoe slid on the smooth planks”, by a male speaker from the NOIZEUS speech corpus: (from top to bottom) clean speech; (left side, from top to bottom) speech degraded by car noise, train noise, babble noise, restaurant noise, airport, street, exhibition, and white noise, respectively (5 dB SNR); (right side, from top to bottom) corresponding enhanced speech.
2
1 10
2
1
SNR 10 log
ˆ
L
n L
n
s n
s n s n
(19)where s n
is the clean speech signal,s nˆ
is the en-hanced speech reproduced by a speech processing system, is the sample index, and
n L is the number of samples
in both speech signals. The summation is performed over the signal length.
2) Segmental signal-to-noise ratio: Seg.SNR is the
average ratio of signal energy to noise energy per frame, and can be expressed as follows:
1 2 1
10 1
2 0
10 Seg.SNR log
ˆ
m
m m
m
N N M
n N N N m
n N
s n
M s n s n
(20)
where M represents the number of frames in a signal and
N the number of samples per frame. It is well-known that
Seg.SNR is more accurate in indicating the speech dis-
tortion than the overall SNR. The higher value of the Seg.SNR indicates the weaker speech distortions.
3) Perceptual evaluation of speech quality: PESQ is
an objective quality measure algorithm designed to pre- dict the subjective opinion score of a degraded audio sample and it is recommended by ITU-T for speech qual- ity assessment [15]. In PESQ measure, a reference signal and the processed signal are first aligned in both time and level. The PESQ measure was reported to be highly cor- related with subjective listening tests in [15] for a large number of testing conditions.
4.2. Subjective Measure-Mean Opinion Score
0 0.5 1 1.5 2 2.5
x 104
-0.4 -0.2 0 0.2 0.4
Time (Second)
A
m
pl
it
ude
0 0.5 1 1.5 2 2.5
x 104
-0.4 -0.2 0 0.2 0.4
Time (Second)
Am
p
li
tu
d
e
0 0.5 1 1.5 2 x 102.54
-0.4 -0.2 0 0.2 0.4
Time (Second)
Am
p
li
tu
d
e
0 0.5 1 1.5 2 2.5
x 104
-0.4 -0.2 0 0.2 0.4
Time (Second)
A
m
pl
it
ude
0 0.5 1 1.5 2 x 102.54
-0.4 -0.2 0 0.2 0.4
Time (Second)
A
m
pl
it
ude
0 0.5 1 1.5 2 2.5
x 104
-0.4 -0.2 0 0.2 0.4
Time (Second)
A
m
pli
tude
0 0.5 1 1.5 2 x 102.54
-0.4 -0.2 0 0.2 0.4
Time (Second)
A
m
pl
it
ud
e
0 0.5 1 1.5 2 2.5
x 104
-0.4 -0.2 0 0.2 0.4
Time (Second)
A
m
pl
it
ud
e
0 0.5 1 1.5 2 x 102.54
-0.4 -0.2 0 0.2 0.4
Time (Second)
A
m
pl
it
ud
e
0 0.5 1 1.5 2 2.5
x 104
-0.4 -0.2 0 0.2 0.4
Time (Second)
A
m
pl
it
ude
0 0.5 1 1.5 2 x 102.54
-0.4 -0.2 0 0.2 0.4
Time (Second)
A
m
pli
tud
0 0.5 1 1.5 2 2.5
x 104
-0.4 -0.2 0 0.2 0.4
Time (Second)
Am
pli
tud
e
0 0.5 1 1.5 2 x 102.54
-0.4 -0.2 0 0.2 0.4
Time (Second)
A
m
pl
it
ud
e
0 0.5 1 1.5 2 2.5
x 104
-0.4 -0.2 0 0.2 0.4
Time (Second)
A
m
p
litu
d
e
0 0.5 1 1.5 2 x 102.54
-0.4 -0.2 0 0.2 0.4
Time (Second)
A
m
p
lit
ud
e
0 0.5 1 1.5 2 2.5
x 104
-0.06 -0.04 -0.02 0 0.02 0.04 0.06
Time (Second)
A
m
pli
tud
e
0 0.5 1 1.5 2 x 102.54
-0.06 -0.04 -0.02 0 0.02 0.04 0.06
Time (Second)
A
m
pl
it
ud
[image:10.595.82.514.85.413.2]e
Figure 6. Temporal waveforms of sp1 utterance, “The birch canoe slid on the smooth planks”, by a male speaker from the NOIZEUS speech corpus: (from top to bottom) clean speech; (left side, from top to bottom) speech degraded by car noise, train noise, babble noise, restaurant noise, airport noise, street noise, exhibition noise, and white noise, respectively (5 dB SNR); (right side, from top to bottom) corresponding enhanced speech.
scale presented in [3]. For each speaker, the following procedure has been applied: 1) clean speech and noisy speech is played and repeated twice; 2) each test signal, which is repeated twice for each score, is played three times in a random order. This leads to 20 scores for each signal.
Table 1 presents the objective evaluation and com-
parison of the proposed algorithm, IP-MBSS, with MBSS in terms of output SNR values (dB), and output Seg.SNR values (dB) at different labels of SNR. The value of out- put SNR, and output Seg.SNR for different types of noises for IP-MBSS is observed to be better than MBSS.
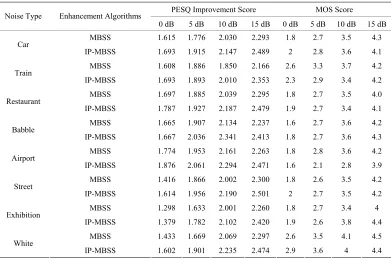
The results shown in Table 2, presents the PESQ im-
provement score and MOS score of IP-MBSS over MBSS algorithm. In the case of the PESQ measure, the proposed IP-MBSS technique gives better PESQ scores than the MBSS technique while in MOS case the en- hanced speech obtained by proposed algorithm gives poor result for train and airport noise in comparison to MBSS algorithm.
Moreover, speech spectrograms constitute a well-suited tool for observing the remnant noise and speech distor-
tion. It can be seen from Figures 5-11, that the musical
structure of the remnant noise is reduced more by IP- MBSS, even compared to MBSS. Thus, speech enhanced by the proposed algorithm is more pleasant and the rem- nant musical noise has a “perceptually white quality” while distortion remains acceptable. This confirms the
values of the SNR, Seg.SNR (Table 1) and PESQ; also it
is validated by listening tests (Table 2).
5. Conclusions
0 0.5 1 1.5 2 2.5 x 10⁴ -0.4
-0.2 0 0.2 0.4
Time (Second)
Am
p
litu
d
e
Time (Seconds)
Fr
equency (K
H
z
)
0 2000 4000 6000 8000 10000 0
0.2 0.4 0.6 0.8 1
0 0.5 1 1.5 2 2.5
x 104 -0.4
-0.2 0 0.2 0.4
Time (Second)
A
m
pl
it
ude
Time (Second)
Fr
eq
uency (
k
H
z
)
0 2000 4000 6000 8000 10000 0
0.2 0.4 0.6 0.8 1
0 0.5 1 1.5 2 2.5
x 104 -0.4
-0.3 -0.2 -0.1 0 0.1 0.2 0.3 0.4
Time (Second)
Am
p
litu
d
e
Time (Second)
Fr
e
q
ue
n
c
y
(
k
H
z
)
0 2000 4000 6000 8000 10000 0
[image:11.595.112.482.87.371.2]0.2 0.4 0.6 0.8 1
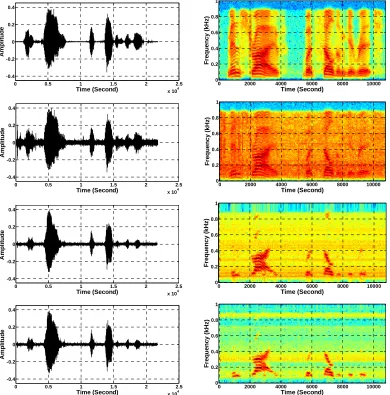
Figure 7. Temporal waveforms and speech spectrogram with sp1 utterance, “The birch canoe slid on the smooth planks”, by a male speaker from the NOIZEUS speech corpus: (from top to bottom) noisy speech (degraded by car noise at 5 dB SNR); speech enhanced by MBSS (PESQ = 1.776), and speech enhanced by IP-MBSS (1.915).
0 0.5 1 1.5 2 2.5
x 104 -0.3
-0.2 -0.1 0 0.1 0.2 0.3
Time (Second)
A
m
pl
it
ude
Time (Second)
F
requency (kH
z
)
0 2000 4000 6000 8000 10000 0
0.2 0.4 0.6 0.8 1
0 0.5 1 1.5 2 2.5
x 104 -0.3
-0.2 -0.1 0 0.1 0.2 0.3
Time (Second)
A
m
pl
it
ude
Time (Second)
Fr
equency (K
H
z
)
0 2000 4000 6000 8000 10000
0 0.2 0.4 0.6 0.8 1
0 0.5 1 1.5 2 2.5
x 104 -0.4
-0.2 0 0.2 0.4
Time (Second)
Am
p
litu
d
e
Time (Second)
Fr
equency (kH
z
)
0 2000 4000 6000 8000 10000 0
0.2 0.4 0.6 0.8 1
[image:11.595.107.487.418.697.2]0 0.5 1 1.5 2 2.5 x 10⁴ -0.4
-0.2 0 0.2 0.4
Time (Second)
Am
plit
ud
e
Time (Second)
Fr
eque
nc
y
(kH
z
)
0 2000 4000 6000 8000 10000 0
0.2 0.4 0.6 0.8 1
0 0.5 1 1.5 2 2.5
x 104 -0.4
-0.2 0 0.2 0.4
Time (Second)
Amp
li
tu
d
e
Time (Second)
Fr
e
q
uenc
y (k
H
z
)
0 2000 4000 6000 8000 10000 0
0.2 0.4 0.6 0.8 1
0 0.5 1 1.5 2 2.5
x 104 -0.4
-0.2 0 0.2 0.4
Time (Second)
A
m
plit
ud
e
Time (Second)
Fr
e
que
nc
y
(k
H
z
)
0 2000 4000 6000 8000 10000 0
0.2 0.4 0.6 0.8 1
0 0.5 1 1.5 2 2.5
x 104 -0.4
-0.2 0 0.2 0.4
Time (Second)
A
m
plitud
e
Time (Second)
Fr
equency
(kH
z
)
0 2000 4000 6000 8000 10000 0
[image:12.595.105.495.87.482.2]0.2 0.4 0.6 0.8 1
Figure 9. Temporal waveforms and speech spectrograms of sp 6 utterance, “Men strive but seldom get rich”, by a male speaker from the NOIZEUS speech corpus: (from top to bottom) clean speech; noisy speech (speech degraded by car noise at 10 dB SNR); speech enhanced by MBSS algorithm (PESQ = 2.157); and speech enhanced by IP-MBSS (PESQ = 2.267).
0 0.5 1 1.5 2 2.5
x 104 -0.4
-0.2 0 0.2 0.4
Time (Second)
A
m
pl
it
ud
e
Time (Second)
Fr
eque
nc
y
(
k
H
z
)
0 2000 4000 6000 8000 10000
0 0.2 0.4 0.6 0.8 1
0 0.5 1 1.5 2 2.5
x 104 -0.4
-0.2 0 0.2 0.4
Time (Second)
A
m
pl
it
ude
Time (Seconds)
F
re
q
ue
nc
y
(
k
H
z
)
0 2000 4000 6000 8000 10000
0 0.5 1 1.5 2 2.5 x 10⁴ -0.4
-0.2 0 0.2 0.4
Time (Second)
A
m
pl
it
ude
Time (Second)
Fr
equ
e
ncy (k
H
z
)
0 2000 4000 6000 8000 10000
0 0.2 0.4 0.6 0.8 1
0.5 1 1.5 2 2.5
x 104 -0.4
-0.2 0 0.2 0.4
Time (Second)
Am
p
lit
u
d
e
Time (Second)
Fr
e
que
n
c
y
(k
H
z
)
0 2000 4000 6000 8000 10000 0
[image:13.595.110.487.86.274.2]0.2 0.4 0.6 0.8 1
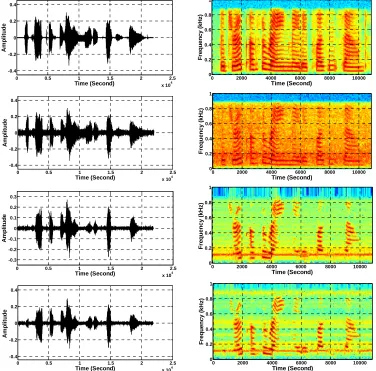
Figure 10. Temporal waveforms and speech spectrograms of sp10 utterance, “The sky that morning was clear and bright blue”, by a male speaker from the NOIZEUS speech corpus: (from top to bottom) clean speech; noisy speech (speech degraded by car noise at 10 dB SNR); speech enhanced by MBSS (2.259); and speech enhanced by IP-MBSS (2.459).
0 0.5 1 1.5 2 2.5
x 104 -0.4
-0.2 0 0.2 0.4
Time (Second)
Am
p
litu
d
e
Time (Second)
Fr
eq
ue
nc
y (
k
H
z
)
0 2000 4000 6000 8000 10000 0
0.2 0.4 0.6 0.8 1
0 0.5 1 1.5 2 2.5
x 104 -0.4
-0.2 0 0.2 0.4
Time (Second)
Am
pl
it
ude
Time (Second)
Fr
equenc
y (kH
z
)
0 2000 4000 6000 8000 10000 0
0.2 0.4 0.6 0.8 1
0 0.5 1 1.5 2 2.5
x 104 -0.3
-0.2 -0.1 0 0.1 0.2 0.3
Time (Second)
A
m
p
lit
u
d
e
Time (Second)
F
re
q
ue
nc
y
(k
H
z
)
0 2000 4000 6000 8000 10000 0
0.2 0.4 0.6 0.8 1
0 0.5 1 1.5 2 2.5
x 104 -0.4
-0.2 0 0.2 0.4
Time (Second)
A
m
p
litu
d
e
Time (Second)
F
req
uenc
y (k
H
z
)
0 2000 4000 6000 8000 10000 0
0.2 0.4 0.6 0.8 1
[image:13.595.111.487.327.698.2]Table 1. Objective evaluation and comparison of IP-MBSS in terms of output SNR values (dB), and output Seg.SNR values (dB).
SNR (dB) Seg.SNR (dB) Noise Type Enhancement Algorithms
0 dB 5 dB 10 dB 15 dB 0 dB 5 dB 10 dB 15 dB
MBSS 4.26 6.01 6.39 6.88 4.19 5.98 6.35 6.82 Car
IP-MBSS 4.50 6.11 6.46 6.94 4.46 6.10 6.44 6.90
MBSS 3.47 5.82 7.41 7.19 3.42 5.75 7.38 7.17 Train
IP-MBSS 3.57 5.96 7.33 7.23 3.54 5.92 7.33 7.25 MBSS 2.15 4.60 5.73 6.46 2.10 4.54 5.66 6.45 Restaurant
IP-MBSS 2.27 5.04 5.84 6.52 2.24 4.99 5.83 6.52
MBSS 2.27 4.64 6.45 5.92 2.21 4.63 6.42 5.87 Babble
IP-MBSS 2.40 4.89 6.51 5.98 2.35 4.88 6.50 5.97 MBSS 3.61 4.81 6.26 5.57 3.52 4.76 6.23 5.50 Airport
IP-MBSS 3.71 4.97 6.34 5.68 3.63 4.91 6.33 5.66 MBSS 4.24 5.00 5.68 6.59 4.17 4.89 5.63 6.53 Street
IP-MBSS 4.42 5.56 5.72 6.66 4.39 5.38 5.68 6.63 MBSS 3.65 3.28 7.12 6.89 3.60 3.20 7.09 6.86 Exhibition
IP-MBSS 3.92 3.34 7.12 6.91 3.91 3.27 7.11 6.89 MBSS 5.09 6.87 7.29 7.49 5.03 6.85 7.28 7.47 White
[image:14.595.103.494.395.653.2]IP-MBSS 5.25 6.86 7.25 7.46 5.23 6.86 7.26 7.46
Table 2. Object and subject evaluation of IP-MBSS in terms of PESQ and MOS score.
PESQ Improvement Score MOS Score Noise Type Enhancement Algorithms
0 dB 5 dB 10 dB 15 dB 0 dB 5 dB 10 dB 15 dB
MBSS 1.615 1.776 2.030 2.293 1.8 2.7 3.5 4.3 Car
IP-MBSS 1.693 1.915 2.147 2.489 2 2.8 3.6 4.1
MBSS 1.608 1.886 1.850 2.166 2.6 3.3 3.7 4.2 Train
IP-MBSS 1.693 1.893 2.010 2.353 2.3 2.9 3.4 4.2 MBSS 1.697 1.885 2.039 2.295 1.8 2.7 3.5 4.0 Restaurant
IP-MBSS 1.787 1.927 2.187 2.479 1.9 2.7 3.4 4.1
MBSS 1.665 1.907 2.134 2.237 1.6 2.7 3.6 4.2 Babble
IP-MBSS 1.667 2.036 2.341 2.413 1.8 2.7 3.6 4.3 MBSS 1.774 1.953 2.161 2.263 1.8 2.8 3.6 4.2 Airport
IP-MBSS 1.876 2.061 2.294 2.471 1.6 2.1 2.8 3.9 MBSS 1.416 1.866 2.002 2.300 1.8 2.6 3.5 4.2 Street
IP-MBSS 1.614 1.956 2.190 2.501 2 2.7 3.5 4.2
MBSS 1.298 1.633 2.001 2.260 1.8 2.7 3.4 4 Exhibition
IP-MBSS 1.379 1.782 2.102 2.420 1.9 2.6 3.8 4.4 MBSS 1.433 1.669 2.069 2.297 2.6 3.5 4.1 4.5 White
IP-MBSS 1.602 1.901 2.235 2.474 2.9 3.6 4 4.4
in each band. A comparison with the reference MBSS algorithm is carried out to evaluate the performance of the proposed enhancement algorithm.
Furthermore, the simulations results, with different types of noises, have shown that the proposed algorithm, IP-MBSS, with appropriate iteration number reduces the
the speech enhanced by IP-MBSS algorithm does con- tains a little amount of remnant noise and speech distor- tion. The remnant noise is of perceptually white quality and the distortions stay within acceptable limit.
REFERENCES
[1] D. O’Shaughnessy, “Speech Communications: Human and Machine,” 2nd Edition, University Press (India) Pvt. Ltd., Hyderabad, 2007.
[2] Y. Ephraim, “Statistical-Model-Based Speech Enhance- ment Systems,” ProceedingsIEEE, Vol. 80, No. 10, 1992, pp. 1526-1555. doi:10.1109/5.168664
[3] P. C. Loizou, “Speech Enhancement: Theory and Prac- tice,” Taylor and Francis, London, 2007.
[4] Y. Ephraim, H. L. Ari and W. Roberts, “A Brief Survey of Speech Enhancement,” 3rd Edition, Electrical Engi- neering Handbook, CRC, Boca Raton, 2006.
[5] Y. Ephraim and I. Cohen, “Recent Advancements in Speech Enhancement,” The Electrical Engineering Hand- book, CRC Press, Boca Raton, 2006, pp. 12-26.
[6] J. S. Lim and A. V. Oppenheim, “Enhancement and Band- width Compression of Noisy Speech,” ProceedingsIEEE, Vol. 67, No. 12, 1979, pp. 1586-1604.
doi:10.1109/PROC.1979.11540
[7] S. F. Boll, “Suppression of Acoustic Noise in Speech Using Spectral Subtraction,” IEEETransactionAcoustic,
Speech, SignalProcessing, Vol. 27, No. 2, 1979, pp. 113- 120. doi:10.1109/TASSP.1979.1163209
[8] M. Berouti, R. Schwartz and J. Makhoul, “Enhancement of Speech Corrupted by Acoustic Noise,” Proceedingsof International Conference on Acoustics, Speech, and Sig- nal Processing, Washington DC, April 1979, pp. 208-211.
[9] S. Kamath and P. Loizou, “A Multi-Band Spectral Sub- Traction Method for Enhancing Speech Corrupted by Colored Noise,” ProceedingsofInternational Conference on Acoustics, Speech, and Signal Processing, Orlando, 13-17 May 2002, pp. IV-4164.
doi:10.1109/ICASSP.2002.5745591
[10] N. Upadhyay and A. Karmakar, “The Spectral Subtrac- tive-Type Algorithms for Enhancement of Noisy Speech: A Review,” International Journal of Research and Re- views in Signal Acquisition and Processing, Vol. 1, No. 3, 2011, pp. 43-49.
[11] N. Upadhyay and A. Karmakar, “Single Channel Speech Enhancement Utilizing Iterative Processing of Multi- Band Spectral Subtraction Algorithm,” Proceedings of International Conference on Power, Control and Embedd- ed Systems, Allahabad, 17-19 December 2012, pp. 196- 201.
[12] S. Ogata and T. Shimamura, “Reinforced Spectral Sub- traction Method to Enhance Speech Signal,” Proceedings
of International Conference on Electrical and Electronic Technology, Vol. 1, 2011, pp. 242-245.
[13] S. Li, J.-Q. Wang, M. Niu, X.-J. Jing and T. Liu, “Itera- tive Spectral Subtraction Method for Mil-Limeter Wave Conducted Speech Enhancement,” Journal Biomedical Science andEngineering, Vol. 3, No. 2, 2010, pp. 187- 192. doi:10.4236/jbise.2010.32024
[14] “A Noisy Speech Corpus for Assessment of Speech En- hancement Algorithms,”
http://www.utdallas.edu/~loizou/speech/noizeus