Munich Personal RePEc Archive
Panel Data Analysis of Performance of
QDII Equity Funds in China
Jin, Hui and Cao, Yanka
Hangzhou Dianzi University
10 May 2014
Online at
https://mpra.ub.uni-muenchen.de/55855/
1
Panel Data Analysis of Performance of QDII Equity Funds
in China
Hui JIN
,
Yanka CAO
School of Economics
,
Hangzhou Dianzi University
,
Zhejiang, 310018 China.
Abstract: Based on a sample of 16 QDII Equity Funds in China established before 2010, this paper evaluates the performance of these funds during 2009 to 2013 by risk-adjusted measures of return and analyzes the influencing factors of performance using panel data models. Empirical study shows that most Chinese QDII funds almost get no excess return compared to risk-free rate, and exchange rate is the main factor affecting the fund performance. Industrial and regional concentration on asset allocation have positive effects to fund performance, which indicates that
QDII funds’ activities do not meet the principle of risk diversification and may increase the risk in long term investment. Although the size of fund is limited by the approved QDII quota, there is only low correlation between size and performance,which implies that the current quota policy is suitable for fund companies.
Key Words: QDII Equity Funds; Risk-adjusted Performance Measures; Influencing Factors; Panel Data Analysis
1 Introduction
QDII (Qualified Domestic Institutional Investors) refers to the mechanism under the limitation of RMB’s full convertibility and capital market liberalization, which permits qualified domestic institutions to invest bonds and stocks in the overseas capital market. In this mechanism, residents and enterprises in China can invest their foreign exchange savings to overseas capital market only through QDII. Under the background of increase in foreign exchange reserves and
RMB appreciation pressure, the QDII institution started on April 2006 in China. Until now, the approved QDII consist of four kinds of institutions such as banks, securities, insurances and trusts, which are engaged in overseas securities investment within approved quota from the State Administration of Foreign Exchange in China. Among them, the securities got the largest quota and raise money from the society to establish QDII funds for the purpose of overseas securities investment. According to the website of Asset Management Association of China, there are 82 QDII funds of 76.08 billion shares issued in the domestic market with total net asset value of 58.41 billion Yuan by the end of December, 2013.
QDII funds are international mutual funds managed by Chinese institutions. According to the principle of international diversification investment, QDII funds should perform better on risk diversification and improve the return per unit of risk. Therefore, the QDII funds should be more attractive to investors compared to the similar funds in the domestic market, which in turn helps to release the foreign exchange reserves and the pressure of RMB appreciation in China. Besides this, the growth of QDII funds helps to develop rational and high quality institutional investors to promote capital market liberalization in China.
Literatures study extensively the benefits on performance of international mutual funds and have different results. Gallo & Swanson(1996)compares the international two index model to international arbitrage pricing model to evaluate the performance of 37 U.S.-based international mutual funds over 1985-1993 periods. Results from index model show that the international mutual funds perform as well as the market proxy and the arbitrage model implies superior investment performance by the international funds. Fletcher & Marshall (2005) examine the benefits of international portfolio diversification for U.K. investors between January 1985 and December 2000. They find significant increases in the Sharpe and certainty equivalent return performance in moving from a domestic strategy to an international strategy that includes either global industry or country equity portfolios.Driessen & Laeven (2007) find that the benefits of investing abroad are largest for investors in developing countries, including when controlling for currency effects. Most of the benefits are obtained from investing outside the region of the home country. Eling & Faust (2010) use five existing performance measurement models plus a new asset-style factor model to identify the return sources and the alpha generated by both types of funds. Their results indicate that some hedge funds generate significant positive alpha, whereas most mutual funds do not outperform traditional benchmarks. Zhou & Ma(2012)calculate the CVaR of QDII funds through Monte Carlo simulation and indicate that QDII fund manager should decrease the investment proportion in the developed market and emerging market while more money should be invested in Chinese A shares and the Hong Kong market.
Previous studies also analyze the influencing factors to international fund performance. Fortin & Michelson (2005) examine the benefits of active international mutual fund management and find that no relationship between total return and expense ratio, but there is a significant positive relationship between total return and turnover, and a significant positive relationship between total return and fund size. Bialkowski & Otten (2011) test the performance of Polish mutual fund industry and examine the influence of fund characteristics such as expenses ratio, size of assets and age in years on risk-adjusted performance. The size of assets under management is the only variable which has statistically significant positive impact on fund performance. Their results indicate the presence of negative correlation between risk-adjusted performance and following variables: expense ratio and the age of funds. However, none of them is statistically significant.
There are also several Chinese literatures contributed to the performance and influencing factors of QDII funds, but empirical studies are rare. Huang et al.(2008)indicate that equity fund is the main category of QDII funds and the investment prefers to Hong Kong stocks and financial industry. The age of funds and investing regions are key factors related to the performance. Wu and Huang(2012)find the local preference in QDII funds asset allocation which decrease the risk diversification effect and therefore reduce the return of QDII funds. Zhang and Chen(2013)use DEA model to study the performance of QDII funds from 2009 to 2010 and indicate that expense ratio is the main factor affecting the fund performance.
3
exchange rate is not considered.
This paper would construct panel data model to study the performance of QDII fund in China including factors such as industrial and regional concentration on asset allocation, fund size and exchange rate. The rest of paper is organized as follows. The next section describes the data and samples used in this study. Section 3 includes the preliminary statistics such as risk- adjusted performance of QDII funds and statistics about the industrial and regional concentration in the fund investment. Section 4 constructs panel data models to analyze the influencing factors of fund performance and discuss the empirical results. Section 5 concludes the paper.
2 Sample Selection
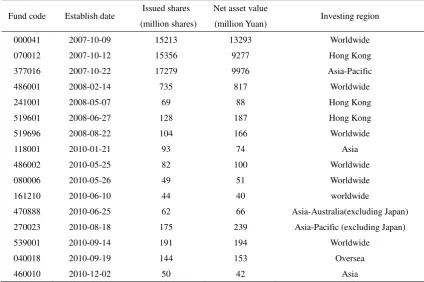
[image:4.595.83.508.400.682.2]The Chinese QDII funds are all open-end ones which were introduced in September 2006 and most of them are equity funds at the early period. QDII Index funds started in 2010, and recent years there occurs other categories such as bond fund and theme fund. The history of Chinese QDII funds is short with few categories. For analysis convenience, a sample of 16 QDII equity funds established before 2010 is selected. The studying period is from 2009 to 2013 so that the sample fund has at least 3 years of life. The data are obtained from the CSMAR database, IFIND database, quarterly reports of funds and website of the State Administration of Foreign Exchange in China. Table 1 describes the establish date, issued shares, total net asset value and investing region of the sample QDII funds.
Table 1 General information of sample QDII funds(till 2013.12.31)
Fund code Establish date Issued shares (million shares)
Net asset value
(million Yuan) Investing region 000041 2007-10-09 15213 13293 Worldwide 070012 2007-10-12 15356 9277 Hong Kong 377016 2007-10-22 17279 9976 Asia-Pacific 486001 2008-02-14 735 817 Worldwide 241001 2008-05-07 69 88 Hong Kong 519601 2008-06-27 128 187 Hong Kong 519696 2008-08-22 104 166 Worldwide 118001 2010-01-21 93 74 Asia 486002 2010-05-25 82 100 Worldwide 080006 2010-05-26 49 51 Worldwide 161210 2010-06-10 44 40 worldwide
470888 2010-06-25 62 66 Asia-Australia(excluding Japan) 270023 2010-08-18 175 239 Asia-Pacific (excluding Japan) 539001 2010-09-14 191 194 Worldwide
040018 2010-09-19 144 153 Oversea 460010 2010-12-02 50 42 Asia Data source: IFIND database
the funds’ main investing region, the risk-free rate is chosen from either the Hong Kong or U. S. market.
As the QDII funds must be invested within their quota, the size of fund is limited by the quota they obtained. From the beginning of QDII institution of April 2006, the fund companies have obtained the largest quota within the four kinds of institutions such as banks, securities, insurances and trusts. The approved quota is also increased from year to year. According to the
“Approval of Quota for QDII” that the State Administration of Foreign Exchange in China announced in November 29, 2013, there are 47 fund companies got the quota of $39.3 billion totally accounted to 48% of the total quota amount. Among them, Harvest Fund Management Limited and China International Fund Management Limitedhave gotten the largest quota of $3.5 billion each. However, the number of QDII funds that the company issued is not related to the quota they got. For example, although the mentioned two companies got the same largest quota, Harvest Fund Management Limited has issued 8 QDII funds but 3 QDII funds by China International Fund Management Limited. In general, the number of issued QDII funds by each approved company is from 1 to 9. This implies that the quota limitation maybe has not affected the activities of QDII fund companies significantly.
3 Preliminary Statistics
3.1 Evaluating performance of QDII funds
The one-parameter measures for fund performance consist of traditional return rate and risk-adjusted return measure. The traditional return rate is net growth rate where net unit asset value is used for calculating in this paper. The risk-adjusted return measures the excess return per risk and includes Sharp ratio, Sortino ratio and Treynor ratio by the corresponding risk measures. The Sharp ratio refers to the excess return on total risk while the Sortino ratio is on downside total risk. The total risk is measured by standard deviation of return. The Treynor ratio calculates the excess return on non-diversifiable risk presented by Beta coefficient. The calculating formula of the above four measures is as following.
(1)Net growth rate(
NGR
)Regardless of any trading expense related to fund investment, the NGR at time t can be computed as following.
i t i t
-
i t-1 t/
i t-1NGR
,
(
NAV
,NAV
,
D
)
NAV
, (1)whereNAVtis the net unit asset value at time t,NAVt1 is the net unit asset value ate time t-1,
t
D represents the dividends at time t. Daily data are used for computing NGR and quarterly average is taken finally. The net growth rate is the base of remaining three measures.
(2)Sharp ratio(
SP
)Sharp ratio is based on the Capital Market Line (CML) and its calculating formula is:
5
(3)Sortino ratio (
STN
)Sortino Ratio is quite similar to Sharp ratio but discriminate goodness or badness of the volatility of return. To measure the risk, only the downside deviation is calculated instead of standard deviation. The volatility of return higher than the risk-free rate is not counted. The following is its calculating formula.
p f p t
i,
(R
-
R
)
/
STN
(3)where
R
p is the net growth rate of fund,R
fis the risk free rate,
pis the downside standard deviation of net growth rate.(4) Treynor ratio(
TLN
)Treynor ratio is based on the Security Market Line (SML) and measures the excess return under per unit non-diversifiable risk. The calculation formula is as following.
TLN
i,t
(
R
P
R
F)
/
p (4) whereR
pis the net growth rate of fund,R
f is the risk-free rate,
P represents the non-diversifiable risk of fund which can be estimated by the Capital Asset Pricing Model.Based on the four return measures, the performance of QDII funds from 2009 to 2013 is evaluated and the descriptive statistics are presented in Table 2.
Table 2 Descriptive statistics of return index for QDII funds
Year Statistics Net growth rate Sharp ratio Treynor ratio Sortino ratio
2009 mean 0.00131 0.00028 0.00060 0.00214
Maximum 0.00173 0.00056 0.00119 0.00305
minimum 0.00075 -0.00023 -0.00053 0.00089
Stand Deviation 0.00280 0.00016 0.00056 0.00651
2010 mean 0.00012 -0.00086 -0.00091 0.00056
Maximum 0.00380 0.00062 0.00386 0.00151
minimum -0.00525 -0.00128 -0.00195 -0.00027
Stand Deviation 0.01557 0.00017 0.00173 0.00547
2011 mean -0.00068 -0.00116 -0.00210 -0.00123
Maximum 0.00340 -0.00071 -0.00034 0.00021
minimum -0.00497 -0.00160 -0.00419 -0.00743
Stand Deviation 0.00230 0.00014 0.00088 0.00334
2012 mean 0.00043 -0.00047 -0.00063 0.00205
Maximum 0.00212 0.00011 0.00001 0.00217
minimum -0.00814 -0.00154 -0.00278 0.00045
Stand Deviation 0.00054 0.00084 0.00074 0.00497
2013 mean 0.00038 0.00022 -0.00011 0.00743
Maximum 0.00560 0.00093 0.00023 0.00032
minimum -0.00054 -0.00211 -0.00274 -0.00321
Stand Deviation 0.00044 0.00024 0.00032 0.00045
From Table 2 one can see that the four return measures have similar variation trend and there are almost no excess return obtained from 2009 to 2013. In 2009, the mean of four return measures is positive, indicating the risk diversification effect of QDII funds even under the influence of aftermath of financial crisis. However, the standard deviations of four measures are all big implying that the performance is quite different from fund to fund. The performance of QDII funds is decreasing since 2010 because of the impact of European Debt Crisis. The mean of the four measures all declines and the standard deviation rises up. In 2011, the performance of funds reaches the bottom and the mean of four return measures become negative. Particularly, the maximum of both Sharp ratio and Treynor is also negative. Since 2012, along with the recovery of overseas market, the QDII fund performance becomes better, but the mean value of Sharp ratio and Treynor still keep negative. In 2013, both the mean and the standard deviation become better than the last year. According to the Maximum and Minimum values of fund, the performance difference from fund to fund is varied significantly from year to year.
3.2 Features of asset allocation
The QDII fund is international mutual fund that implements global asset allocation. To describe the features of its asset allocation, the investing region and industry are considered. First, compute the degree of regional concentration of fund investment. This paper uses the HHI index to measure the regional concentration degree of fund. The calculating formula is as following.
n 2 i 1
i
HHI
Y
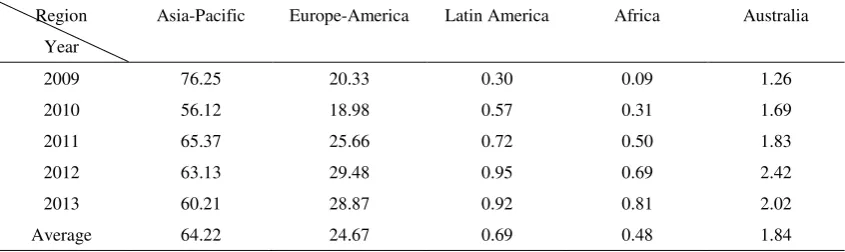
(5) [image:7.595.88.511.481.607.2]where Yi represents the proportion of market value of stocks in region i to the total net asset value of fund, n is the number of investing regions. The larger the HHI, the more regional concentrated the fund. When only one region is invested for a fund, the HHI equals one. Table 3 describes the distribution of investing regions for sample QDII funds from 2019 to 2013.
Table 3 Investing region distribution of QDII funds(%)
Region Year
Asia-Pacific Europe-America Latin America Africa Australia
2009 76.25 20.33 0.30 0.09 1.26 2010 56.12 18.98 0.57 0.31 1.69 2011 65.37 25.66 0.72 0.50 1.83 2012 63.13 29.48 0.95 0.69 2.42 2013 60.21 28.87 0.92 0.81 2.02 Average 64.22 24.67 0.69 0.48 1.84 Note:○1The regional investment proportion less than 0.01% is not exposed in the quarterly report of fund, therefore the sum of the proportions in the table less than 1. ○2Average of quarterly data.
7
managers are optimistic to developed market. Although the investing proportion in Latin America, Africa and Australia is still low, it is increasing in general. In summary, the QDII funds prefer investing in developed market and the regional diversification degree is not high.
Next is to measure the degree of industrial concentration of fund investment. The calculating formula is as following:
ij
i
j 1 i
N
N
IM
CIR
TAV
(6)where
IM
ijrepresents the market value of stock j hold by the fund i,TAV
iis the total net asset value of fund i, andCIR
iN is the proportion of investment to N industries for fund i. The higher theCIR
iNproportion, the more industrial concentrated the fund on asset allocation. This paper uses the top 5 industries of investment to measure the degree of industrial concentration for each fund. Table 4 describes the distribution of industrial concentration on asset allocation for QDII funds from 2009 to 2013.Table 4 Investing industry distribution of QDII funds(%)
Note:○1 According to GICS;○2 Average of quarterly data.
Table 4 indicates that the industrial concentration on asset allocation of QDII funds achieves 79.45% average per year according to the 10 sectors of Global Industry Classification Standard (GICS). The top three investing sectors are finance, energy and Unnecessary consume. The proportion of finance sector is highest at 23.92% average per year, showing that fund managers are optimistic to the development of finance sector. The proportions of energy, unnecessary consume and information technology are all about 10% average per year, implying little more devoted for investment compared to other sectors. The smallest proportion of fund investing is the medical & health sector with only 2.24% average per year. From the view of time periods, the proportions of investment in finance and energy sectors decline year by year from 2009 to 2013, but still higher than the other sectors. The proportion of investment in utility sector is significantly improved. By the investing proportion of 10 sectors, the impact of risk diversification for QDII funds is not completely utilized.
4 Panel Data Analysis
4.1 Correlation analysis
According to the features of asset allocation and worldwide investment for QDII funds, this paper considers the influencing factors of QDII fund performance such as regional and industrial concentration on asset allocation, size of assets and foreign exchange rate. Table 3 and Table 4 present the concentration degrees of asset allocation and the regional and industrial concentration are calculated by formula (5) and (6) respectively. Since the size of QDII funds is limited by the
Industry
Year
Finance Energy
Unnecessary Consume
Information
technology Materials Industry
Necessary
Consume Telecom
Medical & Health
Utility Total
[image:8.595.43.553.308.451.2]approved quota, which may limit the development of QDII funds. Therefore, it is worth noting without considering the influence of fund size to performance. In this paper, the change of total net asset value is used to measure the change of fund size and the calculating formula is
t
-
t-1/
t-1t
SZV
(
TAV TAV
)
TAV
,whereSZV
trepresents the change in fund size andTAV
tis the total net asset value of fund at time t.As the domestic investors buy QDII funds using RMB and get return from the overseas market by foreign currency which is converted to RMB finally, there exits exchange rate risk for QDII fund investment. According to the Interest Parity theory, the RMB return of the investment should be the sum of foreign currency based return from overseas market and the degree of variability in the exchange rate. Therefore the change in exchange rate can be used to measure the exchange rate risk. As the sample QDII funds are mainly invested in U.S. and Hong Kong market, the daily change in exchange rate of RMB to USD or HKD is chosen and taken quarterly average in result.
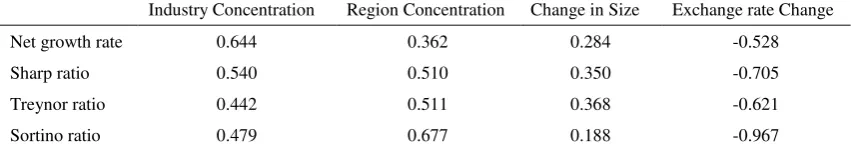
[image:9.595.85.511.419.494.2]Before constructing models to analyze influencing factors of fund performance, correlation analysis is implemented among the return measures and the four factors discussed above. The correlation coefficient is applied to reveal the relationship between these variables. In general, three categories are divided by the value of correlation coefficient. Correlation coefficient ≥0.7 means high relationship, correlation coefficient <0.4 means low relationship, and correlation coefficient between them is medium relationship. The result of correlation analysis is shown in Table 5.
Table 5 Correlation coefficients between performance and its influencing factors
Industry Concentration Region Concentration Change in Size Exchange rate Change Net growth rate 0.644 0.362 0.284 -0.528 Sharp ratio 0.540 0.510 0.350 -0.705 Treynor ratio 0.442 0.511 0.368 -0.621 Sortino ratio 0.479 0.677 0.188 -0.967
From Table 5 one sees that the four return measures are positive related to industrial concentration, regional concentration and change in fund size, but negative related to the change in exchange rate. Furthermore, the relationship to industrial and regional concentration show medium degree while that to change in fund size show low degree. The relationship to change in exchange rate presents highest relevance, especially both Sharp ratio and Sortino ratio are in the high degree range. This implies that the exchange rate should have significantly impact to the performance of QDII funds.
Because the change in fund size shows low relationship to fund performance, this factor would be eliminated in the following model construction.
4.2 Model construction
9
so that their data from 2009 to the establishment dates are missed. To complete the data, the Bootstrap method is applied to estimate the missed data sampling with 500 times repetition.
Let N be the number of funds, T be the time periods of observations. The expression of the unrestricted model is as following:
Y
i t,= +
i 1CIR
i,t+
2HHI
i,t+
3FER
i,t+
i,ti = 1,2.. N;t = 1, 2 T
...
(7)where
Y
i,trepresents either net growth rate(NGR
i,t), Sharp ratio(SP
i,t),Treynor ratio(
TLN
it)or Sortino ratio(STN
i,t),CIR
i,trepresents degree of industrial concentration,i t
HHI
,represents degree of regional concentration,FER
i,tis the change in exchange rate,
iis fund-specific constant,
1,
2and
3represents parameters corresponding to three independent variables respectively,
i,tis the error term.Eviews 6.0 is applied to estimate parameters of the model. In order to avoid spurious regression, the unit-root test is first implemented for all variables. The results reject the null hypothesis of containing unit roots so that all individual series are stationary.
4.2.1 Covariance analysis
The panel data models consist of three forms: pooled model, variable-intercept model with individual effect and variable-coefficient model with individual effect. This paper utilizes analysis-of-covariance test to identify the form of model and the following two hypotheses H1 and H2 are used to identify the correct one from the three forms.
1
:
1 2...
KH
,which represents variable-intercept model with individual effect;1 2 N
2
1 2 K
...
:
...
H
,which represents the pooled model.Here
i(
i
1, 2,...K)
represents the independent variable parameters and K is the number of independent variables;
i(
i
1, 2,... N)
represents the individual-specific constant and N is thenumber of individuals.
If hypothesis H2 is accepted, that the sample data adapt to pooled model, no further test is done; if the hypothesis H2 is rejected, then further test procedure for hypothesis H1 is necessary. If hypothesis H1 is rejected, then the data adapt to variable-coefficient model; otherwise the data adapt to variable-intercept model.
following.
2 1 1
1
- )
[(
1) ]
~ [(
1) , (
1)]
[ (
1)]
S S
N
k
F
F N
k N T
k
S
N T
k
(
(8)
3 1 2
1
- )
[(
1)(
1)]
~ [(
1)(
1),
(
1)]
[ (
1)]
S S
N
k
F
F N
k
N T
k
S
N T
k
(
(9)
where S1 is residual sum of squares for variable-coefficient model, S2 is residual sum of squares for variable-intercept model, S3 is residual sum of squares for pooled model.
The test procedure starts from H2 test and the significant level is 5%. The following Table 6 presents covariance analysis results for hypothesis test corresponding to four dependent variables. According to the analysis results in Table 6, the equations with dependent variables of
i t i t
and
i tNGR
,,
SP
,STN
, should be variable-intercept model, while that with dependent [image:11.595.90.512.416.589.2]variables of
TLN
itshould be pooled model. The results mean that the influence of three factors on performance is almost no statistically difference among all 16 sample funds, and either variable-intercept model or pooled model could be applied for parameter estimation at the 5% significant level.Table 6 Results of analysis-of-covariance test
Dependent
variable Hypothesis S1 S2 S3 N T K
F1 or
F2
Critical
F Result
i t
NGR
,H1 1.38 1.65 - 16 20 3 1.11 1.32 accepted
H2 1.38 - 2.01 16 20 3 3.35 1.30 rejected
i t
SP
,H1 1.60 1.81 - 16 20 3 0.72 1.32 accepted
H2 1.60 - 2.35 16 20 3 2.24 1.30 rejected
t i,
STN
H1 4.48 5.31 - 16 20 3 1.08 1.32 acceptedH2 4.48 - 5.89 16 20 3 1.60 1.30 rejected
t i,
TLN
H2 0.15 - 0.17 16 20 3 1.26 1.30 accepted4.2.2 Individual-specific effects specification
For variable-intercept models, further testing procedure is necessary to specify the individual-specific effects that treated as either fixed constant or random variables. As a result, the former is fixed-effects model and the latter is random-effects model. Hauseman test proposed by Hauseman(1978)is used in this paper, whose null hypothesis is random-effects model to be accepted. The testing results are shown in Table 7.
11
Table 7 Hausma test for model determination Dependent
variable
Chi-square Prob. H0 Individual-specific
effects
i t
NGR
,15.35 0.0021 rejected Fixed-effects model
i t
SP
,13.23 0.00017 rejected Fixed-effects model
t i,
STN
18.23 0.0021 rejected Fixed-effects model4.3 Results and discussion
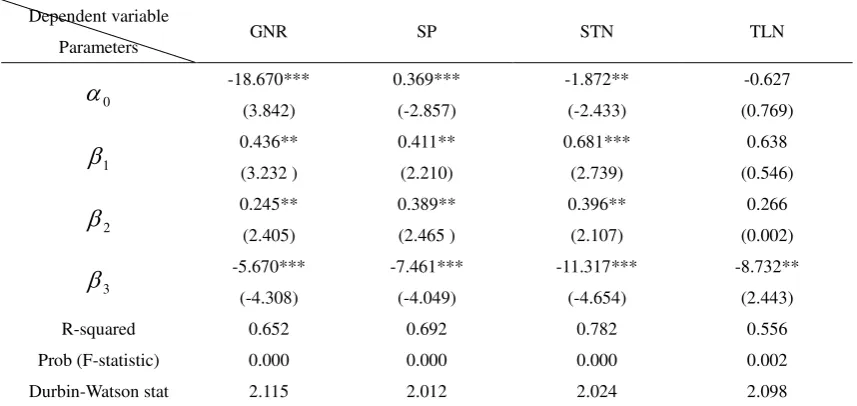
After the identification of model forms and individual-specific effects, the generalized least-squares estimation is applied to estimate the parameters of equation (7). Estimating results are presented in the following Table 8 and Table 9. Note that
i=
0 for TLN in equation (7).Table 8 shows that the parameters
1 of industrial concentration and
2 of regional concentration are positive at the 5% significant level for all return measures. It implies the positive influencing effects to the performance of QDII funds of both regional and industrial concentration, which violate the principle of risk diversification. The reason may lie in the short of oversea investing experiences for fund managers so that focus on familiar industries and regions helps to improve the fund performance instead.In addition, influence of the change in exchange rate is largest, which has negative effect to the fund performance. This indicates that the change in exchange rate is the main factor related to fund performance and the realized return of QDII funds is most affected by the exchange rate. In case of appreciation of RMB, since the exchange rate change is negative in direct quotation, the performance of QDII funds declines.
Table 8 Panel Regression results of different dependent variables Dependent variable
Parameters GNR SP STN TLN
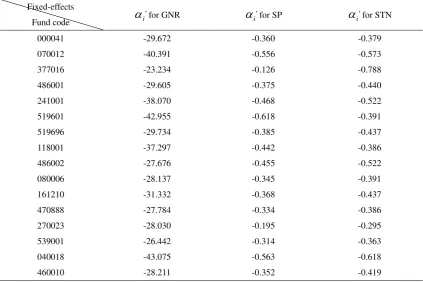
[image:12.595.84.513.511.714.2]Table 9 Individual-specific effects
i, for variable intercept modelsFixed-effects
Fund code
i,
for GNR
i,for SP
i,for STN000041 -29.672 -0.360 -0.379 070012 -40.391 -0.556 -0.573 377016 -23.234 -0.126 -0.788 486001 -29.605 -0.375 -0.440 241001 -38.070 -0.468 -0.522 519601 -42.955 -0.618 -0.391 519696 -29.734 -0.385 -0.437 118001 -37.297 -0.442 -0.386 486002 -27.676 -0.455 -0.522 080006 -28.137 -0.345 -0.391 161210 -31.332 -0.368 -0.437 470888 -27.784 -0.334 -0.386 270023 -28.030 -0.195 -0.295 539001 -26.442 -0.314 -0.363 040018 -43.075 -0.563 -0.618 460010 -28.211 -0.352 -0.419
Note:
i=
i+
0i
1, 2,...16
,
(
)
in case of GNR, SP and STN for equation (7).
In Table 8, the constant terms
0 ofNGR
i,t,
SP
i,tand
STN
i,tare significant at 1%level, which implies other factors such as culture background, political system and global economic circumstance also influence the fund performance. Table 9 show the fund-specific effects
i, of sample funds in variable-intercept model, indicating that the mentioned other factors affect the performance fund by fund. The reason may be from the difference of overseas investing experiences and risk awareness for fund managers.5 Conclusion
This paper applies several risk-adjusted return measures to evaluate the performance of QDII Equity funds in China. These measures such as Shape ratio, Sortino ratio and Trenyor ratio show that, the Chinese funds almost have no excess return during 2009 to 2013 based on a sample of 16 QDII Equity funds. The main reason lies in the increase of international investing risk along with the deceleration of world economic growth, especially the financial crisis in 2008 and the European Debt Crisis in 2010, which affect the fund return during the developing period of Chinese QDII funds.
13
effect on the performance so that the more depreciation of RMB, the better of fund performance. Besides these, other factors such as oversea culture and political system, the global economic circumstance and fund manager’s personal ability also affect the performance of fund. Although the size of QDII fund is limited by the quota, there is almost no affect to performance, which implies that the current quota policy is suitable for fund companies.
The improvement of QDII funds performance is considered to lead the foreign exchange outflow by the efficiency of overseas investment so that to decrease the pressure of RMB appreciation. On the other hand, the development of QDII funds helps to promote the openness of Chinese capital market with the growth of rational and high quality institutional investors. However, QDII funds are not as attractive as expected to domestic investors because of its poor performance, and fund companies are still not rational and high quality institutional investors. The activities of QDII funds violate the principle of risk diversification by industrial and regional concentration on asset allocation, which would increase the investing risk from the view of long term investment. The risk awareness of fund manger should be improved. Exchange rate risk should be hedged which has significantly effect to the fund performance. In other words, risk hedging assets must be considered to the portfolio of QDII funds. It is also necessary for fund managers to have the global economic knowledge and improve their abilities to analyze the overseas capital market.
References
Bialkowski,J., Roger Otten (2011). Emerging market mutual fund performance: Evidence for Poland. North American Journal of Economics and Finance, 2011(22):118-130.
Driessen J., Luc Laeven (2007). International portfolio diversification benefits: Cross-country evidence from a local perspective. Journal of Banking & Finance, 2007(31):1693-1712. Eling,M., Roger Faust (2010). The performance of hedge funds and mutual funds in emerging
markets. Journal of Banking & Finance, 2010(34):1993-2009.
Fortin,R., Stuart Michelson (2005). Active international mutual fund management: can managers beat the index. Managerial Finance, 2005(1):41-51.
Fletcher J., Andrew Marshall (2005). An empirical examination of the benefits of international diversification. International Financial Markets Institutions & Money, 2005(15):455-468. Gallo,J.G., Peggy E. Swanson (1996), Comparative measures of performance for U.S.-based
international equity mutual funds. Journal of Banking & Finance 20 (1996):1635-1650. Zhou,M., Chaoqun Ma (2012). Risk Management of QDII Fund Based on Dynamic Copula.
Systems Engineering Procedia 3 (2012): 222-228.
黄晓萍,梁锐汉,钟恒 (2008).1 全球化视野下中国QDII现状分析.证券市场导报, 2008(8):6-12.
吴立广,黄珍 (2012).2 国际分散化投资与本土偏好行为.产经评论, 2012(1):138-146.
张珺,陈卫斌 (2013).3 基于非参数法的我国QDII基金绩效研究. 投资研究, 2013(5):138-148.