Published Online April 2013 in SciRes (http://www.scirp.org/journal/psych) http://dx.doi.org/10.4236/psych.2013.44061
Determinants of Online Social Business Network Usage
Behavior—Applying the Technology Acceptance Model
and Its Extensions
Guido Moeser
1*, Heiko Moryson
2, Gero Schwenk
1# 1Research Department, Masem Research Institute, Wiesbaden, Germany 2Department of Cultural and Social Sciences, University of Giessen, Giessen, Germany Email: *[email protected]
Received December 7th, 2012; revised January 6th, 2013; accepted February 1st, 2013
Copyright © 2013 Guido Moeser et al. This is an open access article distributed under the Creative Commons Attribution License, which permits unrestricted use, distribution, and reproduction in any medium, provided the original work is properly cited.
Usage of online social business networks like LinkedIn and XING have become commonplace in today’s workplace. This research addresses the question of what factors drive the intention to use online social business networks. Theoretical frame of the study is the Technology Acceptance Model (TAM) and its extensions, most importantly the TAM2 model. Data has been collected via a Web Survey among users of LinkedIn and XING from January to April 2010. Of 541 initial responders 321 finished the questionnaire. Operationalization was tested using confirmatory factor analyses and causal hypotheses were evaluated by means of structural equation modeling. Core result is that the TAM2 model generally holds in the case of online social business network usage behavior, explaining 73% of the observed usage intention. This intention is most importantly driven by perceived usefulness, attitude towards usage and social norm, with the latter effecting both directly and indirectly over perceived usefulness. However, perceived ease of use has—contrary to hypothesis—no direct effect on the attitude towards usage of online social business net- works. Social norm has a strong indirect influence via perceived usefulness on attitude and intention, cre- ating a network effect for peer users. The results of this research provide implications for online social business network design and marketing. Customers seem to evaluate ease of use as an integral part of the usefulness of such a service which leads to a situation where it cannot be dealt with separately by a ser- vice provider. Furthermore, the strong direct impact of social norm implies application of viral and peer- to-peer marketing techniques while it’s also strong indirect effect implies the presence of a network effect which stabilizes the ecosystem of online social business service vendors.
Keywords: Technology Acceptance Model (TAM); Online Social Business Networks; Usage Intention; Structural Equation Modeling; Network Effect
Introduction
Online social business networks have been growing rapidly in recent years, with LinkedIn and XING being among the most established (Boyd & Ellison, 2007). So far, only a small num- ber of studies have used psychological methods to investigate factors which are relevant for typical usage behavior. Espe- cially noteworthy theoretical approaches in this field are the Technology Acceptance Model (TAM) formulated by Davis (1986) and its extensions (Venkatesh & Davis, 2000), which are aiming on explanation of usage intention.
Despite minor ciriticisms (e.g. Straub & Burton-Jones, 2007; Benbasat & Barki, 2007), the Technology Acceptance Model is widely accepted and empirically tested, including several meta- analyses (Yousafzai et al., 2007; Schepers & Wetzels, 2007; Ma & Liu, 2004; King & He, 2006). Recently a series of appli- cations of the Technology Acceptance Model in other Internet and Web 2.0 technologies (e.g. internet shopping malls (Gentry
& Calantone, 2002), online banking (Pikkarainen et al., 2004), mobile internet user acceptance (Venkatesh et al., 2003)) and internet acceptance in general (Kim et al., 2007) have been pub- lished.
Given the impression of the repeated successful application of this type of model in related fields of online services, it seemed promising to us to employ them for our focus on Online Social Business Networks. This promise is also underlined by the fact that the family of TAM-models also focuses on the ef- fects of peer influences, which should be a key driver for the online social networking services in focus.
Models and Research Questions
The original Technology Acceptance Model developed by Davis (1989) is based on the works of Fishbein & Ajzen (1975) and Ajzen & Fishbein (1980) who developed the Theory of Reasoned Action (TORA) which will be outlined as a starting point. Within the framework of TORA, two determinants ex- plain the intention to perform a specific behavior. The first de- *
Corresponding author. #
terminant is attitude towards the behavior, which is defined as the degree to which performance of the behavior is positively or negatively valued (Ajzen & Fishbein, 1980). The second deter- minant is subjective norm which is the perceived social pres- sure to engage or not to engage in a behavior (Ajzen & Fishbein, 1980). The intention to perform a specific behavior finally af- fects whether people perform the action.
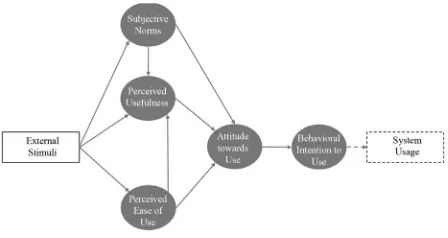
Building on this structure of a psychological attitude model, the Technology Acceptance Model was developed by Davis et al. (1989) to explain the use of information systems and com- puter adoption. TAM (Davis, 1989) consists of five constructs which channel the influence of external variables specific to the application. The model is depicted graphically in Figure 1. Its schema can be described as follows: the external variables in- fluence perceived usefulness (PU) and perceived ease of use (PEU) of an information system, which are both influencing a person’s attitude towards use (ATT), in turn influences behav- ioral intention to use (INT), which finally influences actual usa- ge behavior. A major difference to TORA is that the original TAM does not include effects of subjective norm. Taylor & Todd (1995) provide a more detailed comparison of the two models.
It should be further noted that Davis later recommended to drop attitude (ATT) out of the model formulation (Davis et al., 1989), while it has been reintroduced in the newer TAM2- ex- tension of the model (Venkatesh & Davis, 2000).
The variables are specified as follows: Perceived usefulness (PU) is defined as the extent to which a person believes that using a specific technology/information system will enhance her performance (Lee et al., 2003). The meta-analysis of Sche- pers & Wetzels (2006) reports PU being one of the strongest direct and indirect influences on usage intention. Perceived ease of use (PEU) is defined as the extent to which a person believes that using the specific technology/information system will be free of effort (Lee et al., 2003). Scheepers & Wetzels (2006) re- port only substantial indirect effects of PEU on ATT over PU, direct effects of PEU on ATT and INT are reported as being often weak.
The lack of inclusion of the Subjective Norms (SN) which was deemed relevant for system usage led to development of the already mentioned extension of the Technology Acceptance Model by Venkatesh & Davis (2000) called TAM2. The model is depicted graphically in Figure 2.
[image:2.595.312.536.86.205.2]TAM2 is of course of special interest for us, given our focus on Social Business Networks and served as theoretical back- bone of this study. In our application it has been further ex- tended by inclusion of external moderators which will be dis- cussed in detail in the operationalization section. According to the theory they can be classified into the following groups: or- ganizational factors, technology factors such as technology com- plexity (operationalized by PEU) and individual factors such as
Figure 1.
Schematic of the original Technology Acceptance Model (Davis, 1989).
Figure 2.
Schematic of the extended Technology Acceptance Model 2 (Ven- katesh & Davis, 2000).
age, gender or experience (Sun & Zhang, 2006). Given that Social Business Networking is an individual and non-corporate behavior, we did not include organizational factors in our study. If our approach was to be summarized in a single sentence, it would be: “What are the psychological mechanisms associated with Social Business Network usage, seen from a perspective of attitude research in terms of the TAM2 model?”
Of course, such a statement needs some decomposition in order to be tested systematically and empirically. In particular, we focused on examining several research questions of differ- ent granularity, which arose before the background of the TAM2 model.
The first and most obvious question is whether TAM2 is an appropriate approach to model Social Business Network usage. Given that TAM2 can be considered appropriate, the next ques- tion regards to the pattern of effects as postulated by the model. What are the strongest influences and what are the orders of magnitude of direct and indirect effects? Given the case of So- cial Networking Services we expect the influence of Social Norm to be substantive. However, the relative roles of Per- ceived Usefulness and Perceived Ease of Use of the technology are not clear at this point and will be subject to closer examina- tion.
Hypotheses
H1 (ATT > INT): The more positive the attitude (ATT), the stronger the intention (INT) to use online social business net- works in the next four weeks.
H2 (SN > INT): The more positive the attitude of the subjec- tive norms (SN), the stronger the intention (INT) to use online social business networks in the next four weeks.
H3 (PU > ATT): The more positive the perceived usefulness (PU), the more positive the attitude (ATT) towards the use of online social business networks in the next four weeks.
H4 (PEU > PU): The more positive the perceived ease of use (PEU), the more positive the perceived usefulness (PU) towards the use of online social business networks in the next four weeks.
H5 (PEU > ATT): The more positive the perceived ease of use (PEU), the more positive the attitude (ATT) towards the use of online social business networks in the next four weeks.
[image:2.595.56.289.633.711.2]Sample
Data were collected via a Web survey of social business network users over four months, from January 2010 to April 2010. Social business network users of the two major social business networks, LinkedIn and XING, were invited to par- ticipate in the survey. The questionnaire was hosted on a uni- versity server using the open-source survey tool LimeSurvey. A total of 541 respondents started the questionnaire with 321 fi- nishing it.
Thirty-three percent of the respondents were female, and sixty-seven percent were male. Over seventy percent of the res- pondents were between thirty one and fifty years old. About half of the respondents were self-employed. The empirical dis- tribution of gender is very close to those communicated by XING (XING Mediendaten, 2010) and shows a lesser propor- tion of women than communicated by LinkedIn (LinkedIn Au- dience, 2013). The distribution of ages deviates slightly from those communicated both by XING and LinkedIn, showing a lower proportion in the age class from 27 to 30 years and higher proportion in the age class from 41 to 50 years. Table 1 sum- marizes the samples demographics. Taken together, our sample shows small deviations from what can be considered the popu- lation’s marginal distribution. However, we can see no evi- dence for a systematic sampling or self-selection bias.
Operationalization
Before formulating the questionnaire items, qualitative inter- views of about 30 minutes in length had been conducted with eight persons to gather deeper insight into the behavior under investigation and its relevant determinants, following recom- mendations by Fishbein & Ajzen (2010).
[image:3.595.263.530.322.732.2]After analyzing the collected qualitative interviews, ques- tions had been formulated in concordance to recommendations of Davis et al. (1989) and Fishbein & Ajzen (2010). All con- structs have been operationalized using multi-item scales to avoid problems regarding reliability (Ajzen, 2005). After for- mulation of the first draft of the questionnaire, cognitive pre-
Table 1.
Demographic of the survey respondents.
Measure Frequency Percent Valid N
Gender 317
Female 105 33.1
Male 212 66.9
Age 313
Under 26 10 3.2
27 - 30 30 9.6
31 - 40 107 34.2
41 - 50 121 38.7
51+ 45 14.4
Employment status 307
Employed or other 148 48.2
Self employed 159 51.8
tests had been conducted with several persons. This resulted in shortening the quite lengthy questionnaire and a reformulation of selected items.
Respondents were asked to score on a 7 point Likert scale in the questionnaire with different endpoints specific to the ques- tion asked. The final version was coded in the online question- naire tool and tested again. Several items have been excluded after the pretests and a smaller amount has been excluded after data collection and conducting some descriptive analyses. All items were formulated in German, so we will only present Eng- lish translations here, which can be found in Table 2. The ori- ginal questionnaire can be requested from the authors.
Data Analysis
Confirmatory Factor Analysis
Confirmatory factor analysis was used to examine the con- vergent validity of each multi-item scale, through specifying a
Table 2.
Operationalization of the central multi-item scales. English translations of original items formulated.
Constructs Questionnaire item
Perceived ease of use
PEU1 When using business related SNS during the next 4 weeks··· [it will be easy to familiarize with its handling.]
PEU2
When using business related SNS during the next 4 weeks··· [I expect my IT related knowledge to be sufficient to
handle it without difficulty.]
PEU4 When using business related SNS during the next 4 weeks··· [handling of SNS will be easy for me.]
Perceived usefulness
PU1
When using business related SNS during the next 4 weeks··· [a broad availability of other users will be
guaranteed.]
PU2
When using business related SNS during the next 4 weeks··· [I will have got the possibility to create
contacts with other users.]
Attitude
ATT4 Usage of business related SNS during the next 4 weeks will be (or might be)··· [not valuable/valuable] for me.
ATT5 Usage of business related SNS during the next 4 weeks will be (or might be)··· [disadvantageous/advantageous] for me.
ATT6 Usage of business related SNS during the next 4 weeks will be (or might be)··· [not helpful/helpful] for me.
Subjective norms
SN1 Most of the people who are important for me use business related SNS [completely disagree/completely agree].
SN2
Most of the people who are important for me would appreciate if I would use business related SNS during the
next 4 weeks [very improbable/very probable].
Behavioral intention
INT_1 My intent to use business related SNS during the next 4 weeks is··· [very weak/very strong].
[image:3.595.57.291.526.733.2]separate single factor model for each of the five theoretical con- structs. After testing every single factor, model all factor mod- els were included simultaneously in a final model in order to investigate joint reliability and validity of measurement items.
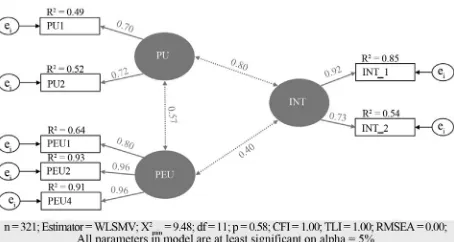
We started with the measurement setup of the classical Tech- nology Acceptance Model (TAM) developed by Davis (1989), but excluded the Attitude construct (ATT), as later recommen- ded by Davis et al. (1989). Standardized factor loadings of the measurement items and correlations between latent constructs are depicted in Figure 3.
The chi-square statistic was found to be non-significant, in- dicating a close fit between model and data. All other indicators surpassed the recommended levels as well (compare Hu & Bentler, 1999), which indicates that the operationalization is statistically appropriate.
In the next step, we extended the core model by relevant con- structs of Technology Acceptance Model 2 (Venkatesh & Davis, 2000). Again a setup of several tests had been performed. Fig- ure 4 shows results for the extended Technology Acceptance Model (TAM2).
[image:4.595.59.286.373.494.2] [image:4.595.308.535.390.515.2]Here the chi-square statistic was found to be significant, in- dicating presence of a misfit between model and observations. However, it should be noted that the chi-square statistic is as- sumed to be generally very sensitive to sample size. If it is me- dium or large, as in our case where n equals 321, the statistic tends to be significant even though differences between the data
Figure 3.
[image:4.595.58.288.542.700.2]Simultaneous confirmatory factor analyses of the constructs included in the classic TAM.
Figure 4.
Simultaneous factor analyses of the constructs included in the extended TAM2.
generated and the proposed model are low. All other indicators surpass the recommended levels (compare Hu & Bentler, 1999), which leads us to the conclusion that the operationalization of the TAM2 is statistically appropriate.
Structural Equation Modeling
Both the original Technology Acceptance Model (TAM) and its extended version, the Technology Acceptance Model 2 (TAM2) have been tested in a path model in order to answer our list of research questions. Both models show an acceptable overall fit to the data as can be seen from Figures 5 and 6. Again, TAM2 shows a significant misfit between model and observations, while its non-inferential fit-measures are looking well. As in the case of test of operationalization we conclude that this significant chi-square statistic is due to our relatively large sample size and does not indicate any serious misfit of the model. The proportion of explained variance of constructs is considerable with a maximum of 72.7% for Behavioral Inten- tion (INT) in the case of TAM2.
Examining the pattern of effects of both models, the most striking observation is the both negligible and insignificant di- rect effect of Perceived Ease of Use (PEU) on Intention (INT) in both models (and on Attitude (ATT) in TAM2). These are contrasted by substantial indirect effects mediated over Per- ceived Usefulness (PU). In the big picture, this pattern can be interpreted as follows: It seems that across all users, social business networks are evaluated as easy to use and users utilize
Figure 5.
Path model for the classic Technology Acceptance Model.
Figure 6.
[image:4.595.308.537.559.709.2]the platforms rather to satisfy their social needs (as measured by Perceived Usefulness (PU) instead of being attracted by the technical innovation.
As expected, the influences of Social Norm (SN) on Attitude (ATT) and Behavioral Intention (INT) are considerable, with even stronger indirect effects being mediated over Perceived Usefulness (PU). This can be interpreted as evidence for the presence of a “network-effect” regarding usage related utility which exceed direct influences of peers in magnitude.
Discussion
The above results have immediate consequences for design and marketing of Social Business Networks. First, and contrary to hypothesis of both original and modified Technology Ac- ceptance Model, there is no evidence for a direct effect of Per- ceived Ease of Use (PEU) which can be considered in separa- tion from Perceived Usefulness (PU).
Second, there is a considerable direct effect of Social Norm (SN) which implies potential for peer-2-peer and recommenda- tion marketing techniques. This effect is exceeded in magnitude by an indirect effect mediated by Perceived Usefulness (PU) which implies a substantial “network effect”. Given such a me- chanism, growth of social networking services seems to be au- tocatalytic to some extent, leading to a situation where market potential is absorbed by larger or more mature players.
Above findings also have implications for theory since they raise the question under which circumstances Perceived Ease of Use (PEU) and Perceived Usefulness (PU) become inseparable. Furthermore the mediation of Social Norm (SN) over Perceived Usefulness (PU) is a striking example for a micro mechanism which translates directly to structural effects on a macroscopic level.
A possible direction for future research could be the question whether there are significant moderators which could eventu- ally explain the vanishing direct effect of Ease of Use (PEU). Castaneda et al. (2007) examines the moderating effect of user experience on TAM’s structure of coefficients, which appears promising for our present situation.
REFERENCES
Ajzen, I. (1991). The theory of planned behavior. Organizational Beha- vior and Human Decision Processes, 50, 179-211.
doi:10.1016/0749-5978(91)90020-T
Ajzen, I. (2005). Attitudes, personality, and behavior (2nd ed.). Milton- Keynes: Open University Press/McGraw-Hill.
Ajzen, I., & Fishbein, M. (1980). Understanding attitudes and predict- ing social behavior. Englewood Cliffs, NJ: Prentice-Hall.
Benbasat, I., & Barki, H. (2007). Quo Vadis TAM? Journal of AIS, 8,
211-218.
Boyd, D. M., & Ellison, N. B. (2007). Social network sites: Definition, history, and scholarship. Journal of Computer-Mediated Communi- cation, 13, 210-230. doi:10.1111/j.1083-6101.2007.00393.x
Castaneda, J., Munoz-Leiva, F., & Luque T. (2007). Web Acceptance Model (WAM): Moderating effects of user experience. Information & Management, 44, 384-396. doi:10.1016/j.im.2007.02.003 Davis, F. (1989). Perceived usefulness, perceived ease of use and user
acceptance of information technology. Management Information Sys- tems Quarterly, 13, 319-340. doi:10.2307/249008
Davis, F., Bagozzi, R., & Warshaw, P. (1989). User acceptance of com- puter technology: A comparison of two theoretical models. Man- agement Science, 35, 982-1003. doi:10.1287/mnsc.35.8.982
Fishbein, M., & Ajzen, I. (1975). Belief, attitude, intention, and behav- ior: An introduction to theory and research. Reading, MA: Addi- son-Wesley.
Fishbein, M., & Ajzen, I. (2010). Predicting and changing behavior: The reasoned action approach. New York: Psychology Press/Taylor & Francis.
Gentry, L., & Calantone, R. (2002). A comparison of three models to explain shop-bot-use on the web. Psychology & Marketing, 19, 945- 956. doi:10.1002/mar.10045
Hu, L., & Bentler, P. M. (1999). Cutoff criteria for fit indexes in co- variance structure analysis: Conventional criteria versus new alterna- tives. Structural Equation Modeling: A Multidisciplinary Journal, 6,
1-55. doi:10.1080/10705519909540118
Kim, B. G., Park, S. C., & Lee, K. J. (2007). A structural equation mo- deling of the Internet acceptance in Korea. Electronic Commerce Re- search and Applications, 6, 425-432.
doi:10.1016/j.elerap.2006.08.005
King, W. R., & He, J. (2006). A meta-analysis of the technology ac- ceptance model. Information & Management, 43, 740-755. doi:10.1016/j.im.2006.05.003
Lee, Y., Kozar, K., & Larsen, K. (2003). The technology acceptance model: Past, present and future. Communications of the Association for Information Systems, 12.
LinkedIn Audience (2013). LinkedIn marketing solutions. http://marketing.linkedin.com/audience
Ma, Q., & Liu, L. (2004). The technology acceptance model: A meta- analysis of empirical findings. Journal of Organizational and End User Computing, 16, 59-72. doi:10.4018/joeuc.2004010104
Pikkarainen, K., Karjaluoto, H., & Pahnila, S. (2004). Consumer accep- tance of online banking: An extension of the technology acceptance model. Internet Research, 14, 224-235.
doi:10.1108/10662240410542652
Schepers, J., & Wetzels, M. (2007). A meta-analysis of the technology acceptance model: Investigating subjective norm and moderation ef- fects. Information & Management, 44, 90-103.
doi:10.1016/j.im.2006.10.007
Straub Jr., D. W., & Burton-Jones, A. (2007). Veni, Vidi, Vici: Break-ing the TAM logjam. Journal of the Association for Information Systems, 8, 223-229.
Sun, H., & Zhang, P. (2006). Causal relationships between perceived enjoyment and perceived ease of use: An alternative approach. Jour- nal of the Association for Information Systems, 7, 618-645. Taylor, S., & Todd, P. A. (1995). Understanding information
technol-ogy usage: A test of competing models. Information Systems Resear- ch, 6, 144-176. doi:10.1287/isre.6.2.144
Venkatesh, V., & Davis, F. D. (2000). A theoretical extension of the technology acceptance model: Four longitudinal field studies. Man- agement Science, 46, 186-204. doi:10.1287/mnsc.46.2.186.11926 Venkatesh, V., Morris, M. G., & Davis, F. D. (2003). User acceptance
of information management: Toward a unified view. MIS Quartely, 27, 425-478.
XING Mediadaten (2010). Deutschland Österreich Schweiz (DACH). http://de.slideshare.net/Jotschkins/XING-mediadaten-4716467 Yousafzai, S. Y., Foxall, G. R., & Pallister, J. G. (2007). Technology
acceptance: A meta-analysis of the TAM: Part 1. Journal of Model- ling in Management, 2, 251-280.