Supported by the Grant Agency of the University of South Bohemia in České Budějovice (GAJU) (Projects No. 011/2013/Z and No. 022/2013/Z).
Effect of
DGAT1
polymorphisms on the estimated
breeding values of Czech Simmental sires
L. Hanusová
1, A. Míková
1, L. Večerek
1, D. Schroeffelová
2, V. Řehout
1,
L. Tothová
1, K. Vernerová
1, B. Hosnedlová
1, J. Čítek
11Department of Genetics and Animal Breeding, Faculty of Agriculture,
University of South Bohemia in České Budějovice, České Budějovice, Czech Republic
2Czech-Moravian Breeders Association, Hradištko, Czech Republic
ABSTRACT: The aim was to evaluate the effect of polymorphisms in the promoter and in the coding region of the DGAT1 gene on the estimated breeding values (EBV) of Czech Simmental sires. The K232A polymorphism
(n = 191) in the coding region was genotyped by PCR/RFLP, and the KU and SA polymorphisms in the
pro-moter (n = 203) were identified in an automatic sequencer. In the K232A polymorphism, the frequency of the
genotype AA (Alanine) was greater than that of the genotype KA, the homozygous genotype KK (Lysine) was
not found. Similarly, the allele A predominated over the K allele (0.945 and 0.055). The EBV for milk
perfor-mance have been assigned to the genotypes, and the associations quantified. For the AA genotype and A allele,
positive association with EBV of milk yield and protein yield was found, and negative association with the breeding values of fat percentage and yield, and protein percentage, but only the value of fat content was found
to be significant. The positive non-significant association of the A variant with the protein yield was caused by
the high milk yield. In the KU polymorphism, the CC genotype was associated significantly with lower EBV for
the fat percentage, both the C allele and the CC genotype were associated with higher EBV for milk yield, so
both the fat and the protein yield were non-significantly increased. For the diplotypes K232A/KU, there was a
significant association with the fat percentage. The AACC combination seemed to have some breeding
poten-tial. The K232A polymorphism explained maximum of 6.2% of EBV variability, the KU polymorphism of 4.4%,
and the SA polymorphism of 4.2%. The diplotypes K232A/KU explained maximum of 7.4% of variability. The
highest proportion of variability was explained for fat percentage. The results confirmed the important role of the BTA14 region in controlling milk performance.
Keywords: cattle; acyl-CoA diacylgycerol transferase1; K232A; promoter; milk performance; breeding; genotypes
InTRoduCTIon
The DGAT1 gene encodes the DGAT1 enzyme, which catalyzes the final step of triglyceride syn-thesis (Sanders et al. 2006).
Several studies in cattle have described a quan-titative trait locus (QTL) with impact on milk production traits, and on milk fat percentage in particular, in the 3-cM region in the centromeric
part of Bos taurus autosome 14 (BTA14) (Riquet
et al. 1999; Looft et al. 2001). Grisart et al. (2002,
2004) and Winter et al. (2002, 2004) have identi-fied a nonconservative dinucleotide substitution (K232A) in the acyl-CoA diacylglycerol
acyltrans-ferase1 (DGAT1) gene at position 10433 and 10434
in exon number 8 as the most likely mechanism underlying the QTL on this chromosome.
content should be present in the same QTL (Ben-newitz et al. 2004; Kuhn et al. 2004). Winter et al. (2002) considered alleles of the DGAT1 promoter region, which comprise a variable number of tan-dem repeats (VNTR), as likely candidates. In the German Holstein population, Kuhn et al. (2004) described 5 alleles at a VNTR polymorphism in the DGAT1 promoter, which showed an effect on fat content additional to the DGAT1 K232A mutation. The most frequent allele in the DGAT1 promoter
VNTR was allele 3. Multiple regression analysis
of the DGAT1 promoter VNTR alleles in sons of genotype DGAT1 232A/232A revealed that the allele substitution effect on the milk fat content of
allele 5 was higher than of all the other alleles. The
regression analysis of the DGAT1 promoter VNTR
alleles revealed significant effects for the allele 5
enhancing the milk fat content percentage as well as the milk protein percentage but decreasing the milk yield and milk protein yield (Kuhn et al. 2004).
Sanders et al. (2006) reported 6 alleles found in the DGAT1 promoter VNTR in the Angeln
popula-tion, which were denoted as VNTR alleles A, B, C,
D, E, and F, respectively. The allele F was present
in two unrelated daughters only. The most frequent
DGAT1 allele was E. In their study, they observed
that the VNTR allele E showed significant effects
for some milk production indicators compared with all other alleles in the DGAT1 promoter. The same results were reported by Kuhn et al.
(2004) for the DGAT1 VNTR allele 5. However, in
contrast to Kuhn et al. (2004), the VNTR allele E
was mainly linked to the K variant at DGAT1 K232A (Sanders et al. 2006), whereas the DGAT1
VNTR allele 5 showed up with the A variant in
the German Holstein Friesian population (Kuhn
et al. 2004). The VNTR allele E of Sanders et al.
(2006) probably corresponds to the DGAT1 VNTR
allele 5 of Kuhn et al. (2004).
In the paper, we report on our analysis of the effect of the genotypes and alleles in the pro-moter, and in the coding region at nucleotide
positions 10433 and 10434 of the DGAT1 gene
on the estimated breeding values (EBV) of Czech Simmental sires.
MATERIAl And METhodS
The analyzed group was made of the Czech Sim-mental sires born in the period 2000–2004, the sires were selected randomly. The DNA was isolated from frozen sperm. The respective parts of the
DGAT1 locus carrying the polymorphisms studied were amplified in the PCR. The primer sequences and PCR conditions were as in Kuhn et al. (2004) and Sanders et al. (2006) for the polymorphisms in
the promoter and as in Winteret al. (2002) for the
polymorphisms at nucleotide positions 10433 and
10434 of the DGAT1 gene (K232A polymorphism).
In promoter, the polymorphisms SA and KU were
studied (Kuhn et al. 2004; Sanders et al. 2006). The PCR was carried out on the Biometra TGradient Thermocycler (Biometra GmbH, Göttingen,
Ger-many). The VNTR polymorphisms KU and SA in
the promoter of the DGAT1 gene were
distingui-shed in the automatic sequencer ABI PRISM®310
Genetic Analyzer (Applied Biosystems, Foster City,
USA). The polymorphism K232A causing K to A
substitution was distinguished by a restriction fragment length polymorphism using the
restric-tion endonuclease CfrI (PCR/RFLP method). An
alternative genotyping method was published by
Abdolmohammadi et al. (2011). For the K232A
polymorphism, 191 sires were genotyped, and 203 sires for the polymorphisms in the promoter. The actual breeding values estimated in 2011 (Plemdat; www.plemdat.cz) have been assigned to the genotypes, and the associations quantified. The genotypes with low frequency were left out in the
association analysis. So, for the K232A
polymor-phism, 180 sires were involved, namely purebred
Simmentals (n = 54), crossbreds of Simmental
with Holstein and Ayrshire with the proportion
of Simmental above 75% (n = 93), crossbreds with
the proportion of Simmental of 50–74% (n = 21),
and purebred Montbeliardes (n = 12). For the
promoter polymorphisms, the counts were the same, just the number of purebred Simmentals was 55, and so the total number of sires was 181.
The statistical evaluation was based on the model equation:
EBV = µ + Gi + eijk
where:
EBV = estimated breeding value for partial milk
production parameter
µ = overall mean
Gi = fixed effect of genotype/allele of polymorphic
sites in the promoter, or in K232A
eijk = residual effect
Assumptions for the Analysis of Variance (ANOVA) were tested by using the Bartlett test of homo-geneity of variance. The estimated breeding va-lues were evaluated by ANOVA depending on
the genotype on the DGAT1 locus; similarly, the
differences between the alleles were quantified. The differences were evaluated at the significance
levels of P < 0.05*, and P < 0.01**. The software
STATISTICA (Version 10, 2013) and the ANO-VA/MANOVA procedure were used. The Hardy-
Weinberg equilibrium was tested by the χ2 test.
RESulTS And dISCuSSIon
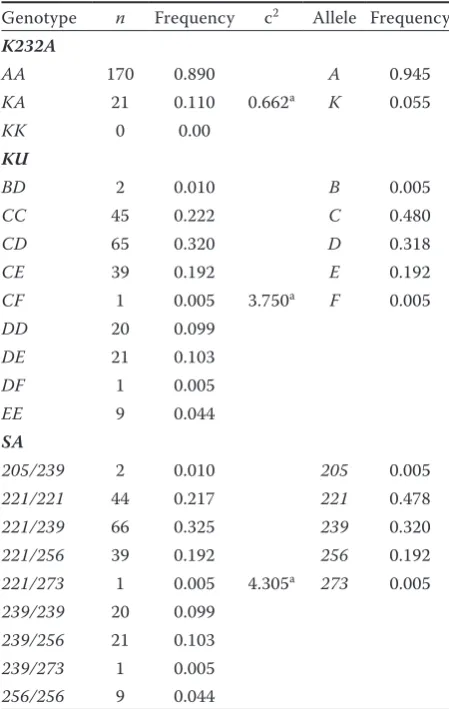
Genotypes and alleles frequencies. In the K232A
polymorphism, the genotype AA prevailed
sub-stantially over the KA, while the homozygous
genotype KK was not found. Similarly, the allele A
predominated over the K allele in the group
ana-lyzed (0.945 and 0.055, respectively) (Table 2). This is different from frequencies found in German Holsteins in our own previous study (Hradecka
et al. 2008), where the frequencies of 0.660 and 0.340 were found, but the population mentioned was upgraded with the Jersey breed. Weller et al. (2003) in Israeli Holstein cows gave a frequency
of K allele of 0.09, in sires of 0.16. By contrast,
Thaller et al. (2003) gave the frequency of the
al-lelic variant coding for K in the German Holstein
of 0.548. As in Grisart et al. (2002), K is probably
the ancestral allele; its frequency is indirectly influenced by selection and decreased while se-lecting for high milk yield. The low frequency of
the K allele found in this paper implies indirect
[image:3.595.63.291.115.298.2]selection as a consequence of the preference of the protein yield in Czech Simmentals in the last decades. Moreover, the Czech Simmental was upgraded by using Ayrshire and Red Holstein cattle with the aim of bettering the milk perfor-mance, and the crossing could have influenced the Table 1. Reliability of estimated breeding values (EBV) of
Czech Simmental sires with different DGAT1 genotypes
Polymorphism Genotype Reliability of EBV
K232A AA 89 ± 3.36
KA 89 ± 3.08
KU
CC 89 ± 3.69
CD 89 ± 2.89
CE 89 ± 4.25
DD 90 ± 2.64
DE 88 ± 2.14
SA
221/221 89 ± 3.73 221/239 89 ± 2.87 221/256 89 ± 4.25 239/239 90 ± 2.65 239/256 88 ± 2.14
Table 2. Genotype and allele frequencies of DGAT1
polymorphisms
Genotype n Frequency c2 Allele Frequency
K232A
AA 170 0.890 A 0.945
KA 21 0.110 0.662a K 0.055
KK 0 0.00
KU
BD 2 0.010 B 0.005
CC 45 0.222 C 0.480
CD 65 0.320 D 0.318
CE 39 0.192 E 0.192
CF 1 0.005 3.750a F 0.005
DD 20 0.099
DE 21 0.103
DF 1 0.005
EE 9 0.044
SA
205/239 2 0.010 205 0.005 221/221 44 0.217 221 0.478 221/239 66 0.325 239 0.320 221/256 39 0.192 256 0.192 221/273 1 0.005 4.305a 273 0.005
239/239 20 0.099 239/256 21 0.103 239/273 1 0.005 256/256 9 0.044
anon significant
c2 = test for evaluation of average variation from expected
[image:3.595.304.529.355.710.2]Ta
ble 3. E
stima te d br ee ding v alue s ac cor ding t o genoty pe
s and alle
le s of D G AT1 K232A poly mor phi sm G enoty pe/alle le n Trait milk y ie ld fa t (%) fa t y ie ld (kg) pr ot ein (%) pr ot
ein (%) R
BV pr ot ein y ie ld (kg) RBV (kg) RV B AA 161
166 ± 490
109 ± 12
–0.01 ± 0.20
a
6.09 ± 18.81
–0.01 ± 0.12
98.66 ± 11.42
5.19 ± 15.18
109.08 ± 12.11
KA
19
–4 ± 618
105 ± 15
0.18 ± 0.30
a
9.21 ± 20.47
0.01 ± 0.12
100.05 ± 11.55
0.16 ± 19.92
105.21 ± 15.63
F -te st 1.93 1.77 4.32* 0.46 0.35 0.25 1.74 1.63 R 2 0.005 0.004 0.062 –0.003 –0.003 –0.004 0.004 0.003 A 341
157 ± 498
109 ± 13
0.00 ± 0.21
b
6.27 ± 18.87
0.00 ± 0.12
98.74 ± 11.40
4.91 ± 15.47
108.87 ± 12.32
K
19
–4 ± 618
105 ± 15
0.18 ± 0.30
b
9.21 ± 20.47
0.01 ± 0.12
100.05 ± 11.55
0.16 ± 19.92
105.21 ± 15.63
R 2 0.002 0.002 0.029 –0.002 –0.002 –0.002 0.002 0.001 RB
V = r
el ative br ee ding v alue (%) avalue
s in one c
olumn w ith iden tic al le tters diff er sig nific an tly ( P < 0.05 ) * P < 0.05 Ta
ble 4. E
stima te d br ee ding v alue s ac cor ding t o genoty pe
s and alle
le s of D G AT1 KU poly mor phi sm G enoty pe/alle le n Trait milk y ie ld fa t (%) fa t y ie ld (kg) pr ot ein (%) pr ot
ein (%) R
BV pr ot ein y ie ld (kg) RBV (kg) RBV CC 44
306 ± 418
113 ± 11
–0.06 ± 0.20
a
8.86 ± 18.28
–0.04 ± 0.11
95.25 ± 10.61
Aa
8.55 ± 13.76
112.00 ± 10.87
CD
62
101 ± 584
107 ± 15
0.07 ± 0.24
a
7.48 ± 20.74
0.02 ± 0.13
101.06 ± 11.45
A
4.19 ± 18.02
108.02 ± 14.14
CE
36
107 ± 481
108 ± 12
0.04 ± 0.23
6.27 ± 14.77
0.02 ± 0.14
101.06 ± 12.86
a
4.31 ± 14.93
108.53 ± 11.75
DD
19
223 ± 483
111 ± 12
–0.03 ± 0.21
7.79 ± 19.65
–0.03 ± 0.08
95.89 ± 7.67
5.31 ± 14.57
109.63 ± 11.57
DE
20
105 ± 342
108 ± 8
–0.06 ± 0.19
0.75 ± 12.64
–0.02 ± 0.13
97.20 ± 12.28
2.35 ± 10.33
107.00 ± 8.25
F -te st 1.21 1.36 2.65 * 0.60 1.90 2.08 0.76 1.00 R 2 0.009 0.011 0.044 –0.006 0.027 0.032 –0.005 –0.001 C 186
199 ± 498
109 ± 13
0.00 ± 0.23
7.90 ± 18.43
–0.01 ± 0.13
98.31 ± 11.63
6.27 ± 15.56
110.00 ± 12.27
D
120
140 ± 517
108 ± 13
0.02 ± 0.22
6.46 ± 19.22
0.00 ± 0.12
98.78 ± 10.72
4.24 ± 15.77
108.36 ± 12.44
E
70
98 ± 412
107 ± 11
0.02 ± 0.22
5.10 ± 14.78
0.00 ± 0.13
98.86 ± 12.27
3.00 ± 13.32
107.16 ± 11.10
R 2 0.001 0.003 –0.004 –0.002 –0.005 –0.005 0.002 0.003 RB
V = r
el ative br ee ding v alue (%) avalue
s in one c
olumn w ith iden tic al le tt ers diff er sig nific an tly ( P < 0.05) Avalue
s in one c
frequencies in the DGAT1 locus. Spelman et al. (2002) recorded variable frequencies in Holstein sires based on the origin of the genetic material. The frequency was higher in the homebred (New Zealander) population, where it was similar to the Jersey breed, and it indicates changes due to indirect selection. They report a low frequency of
0.22 in Ayrshire. In Montbeliarde, the A variant
is practically fixed (Gautier et al. 2007), and this is concordant with our frequencies in phylogenic related Simmental cattle.
In the promoter region, two possible
polymor-phisms, SA and KU, were studied. In the SA
poly-morphism, the most frequent allele 221 had a
frequency of 0.478 and the least frequent alleles 205
and 273 of 0.005. Using the same allele designation
as Sanders et al. (2006), the most frequent allele
in our study was allele B and the least frequent
were alleles A and E. These results are in contrast
to results of the authors mentioned, who found
allele E to be the most frequent. The allele with
the lowest frequency was allele A in both studies.
In the KU polymorphism, we studied 5 alleles. The
most frequent was allele C (0.480) and the least
frequent were alleles B and F (0.005). Our results
are also not completely concordant with Kuhn et
al. (2004). They described allele 3 (D) as the most
frequent, and allele 1 (B) as the least frequent. In
our paper, the frequencies as compared among the purebred Simmentals, purebred Montbeliarde, and crosses were not significantly different both in K232A and promoter polymorphisms.
Association analysis of the K232A polymor-phism. For the coding region of the DGAT1 gene (Table 3), significant differences in estimated bre-eding values of fat content both for genotypes and
alleles were found; the K variant was associated
with higher values. The results are in accordance with those previously found in German Holsteins (Citek et al. 2007). However, also in Holsteins, the estimated breeding values of milk yield, fat yield, protein yield, and protein content were significant. In this paper, the trend of estimated breeding values for genotypes and alleles was the same, i.e.
the homozygous AA genotype and A allele were
associated with higher milk yield, protein yield,
and with lower fat percentage, fat yield, and
pro-tein percentage, but significance was found only
in fat content. The positive non-significant link
of the A variant on protein yield was caused by
high milk yield. The highest portion of variability was explained in EBV for fat content (6.20% by
genotype; 2.90% by allele), the other values did not exceed 1%.
Because there was a high breeding value for milk yield and a negative value for fat content in the
homozygotes for the Alanine variant, the K232A
polymorphism may contribute to the negative cor-relations between the traits. The group has been in Hardy-Weinberg equilibrium, that implies that the selection on breeding value for protein yield did
not importantly affect frequencies on the K232A
polymorphism. The possible reasons may be seen in the rational selection on the fat and protein yield in the breeding programme, which could steady the frequencies; and also in the fact that the DGAT1 itself does not directly influence the protein synthesis (compare Citek et al. 2007). Our results correspond well with many other authors (Grisart et al. 2002; Weller et al. 2003; Sanders et al. 2006), and are applicable in breeding practice.
Association analysis of the promoter polymor-phisms. The CC genotype in the KU polymorphism was associated significantly with lower EBV for fat
percentage compared with CD, and with the protein
percentage compared with CD and CE genotypes,
but non-significantly with the others (Table 4).
But both C allele and CC genotype were linked to
higher EBV for milk yield, so the fat and protein
yield were increased non-significantly. For the EE
genotype, the lowest EBV for milk yield of 65 kg was stated, the highest increase of fat percentage of 0.09%, and low protein yield of 0.57 kg; this was
similar to the allele E effect, although the number
of animals was very low (n = 7), and thus the data
are not shown in Table 4. Again, the highest portion of variability was explained in EBV for fat content,
4.40% for genotype. Evidently, the SA
polymorphi-sm (Table 5) is the same as that of KU, as noted by
other authors (Kuhn et al. 2004, Sanders et al. 2006). The relationship between the combined
geno-types of K232A and KU polymorphisms and the
estimated breeding values was quantified (Ta-ble 6). The significant association with the fat
percentage was noted. At the KU polymorphism,
the combination of the AA genotype in K232A
and the CC, DE, and DD in KU had the negative
link, whereas LA/CD had the positive. For fat
content, the combined genotype explained 7.4%
of variability. The AA/CC combination seems to
Ta
ble 5. E
stima te d br ee ding v alue s ac cor ding t o genoty pe
s and alle
le s of D G AT1 S A poly mor phi sm G enoty pe/ alle le n Trait milk y ie ld fa t (%) fa t y ie ld (kg) pr ot ein (%) pr ot ein (%) RBV pr ot ein y ie ld (kg) RBV (kg) RBV 221/221 43
308 ± 423
113 ± 11
–0.06 ± 0.20
a
9.19 ± 18.37
–0.04 ± 0.11
95.53 ± 10.56
8.77 ± 13.84
112.12 ± 10.92
221/239
63
103 ± 579
107 ± 15
0.06 ± 0.23
a
7.29 ± 20.63
0.02 ± 0.13
100.78 ± 11.58
4.11 ± 17.89
107.95 ± 14.03
221/256
36
107 ± 481
108 ± 12
0.04 ± 0.23
6.28 ± 14.77
0.02 ± 0.14
101.06 ± 12.86
4.31 ± 14.93
108.53 ± 11.75
239/239
19
224 ± 483
111 ± 12
–0.03 ± 0.21
7.79 ± 19.65
–0.03 ± 0.08
95.89 ± 7.67
5.32 ± 14.57
109.63 ± 11.57
239/256
20
105 ± 342
108 ± 8
–0.06 ± 0.19
0.75 ± 12.64
–0.02 ± 0.13
97.20 ± 12.28
2.35 ± 10.33
107.00 ± 8.25
F -te st 1.21 1.36 2.57 * 0.63 1.65 1.81 0.82 1.07 R 2 0.009 0.011 0.042 –0.005 0.020 0.024 –0.003 0.000 221 185
199 ± 499
110 ± 13
0.00 ± 0.23
7.97 ± 18.45
–0.01 ± 0.13
98.39 ± 11.61
6.31 ± 15.59
110.03 ± 12.30
239
121
141 ± 515
108 ± 13
0.01 ± 0.22
6.36 ± 19.17
–0.01 ± 0.12
98.65 ± 10.77
4.20 ± 15.71
108.32 ± 12.39
256
70
98 ± 412
107 ± 11
0.02 ± 0.22
5.10 ± 14.78
0.00 ± 0.13
98.86 ± 12.27
3.00 ± 13.32
107.16 ± 11.10
R 2 0.001 0.003 –0.004 –0.001 –0.005 –0.005 0.002 0.004 RB
V = r
el ative br ee ding v alue (%) avalue
s in one c
olumn w ith iden tic al le tters diff er sig nific an tly ( P < 0.05 ); * P < 0.05 Ta
ble 6. E
stima te d br ee ding v alue s ac cor ding t o c ombine d genoty pe s of K232A and KU p oly mor phi sms G enoty pe n Trait milk y ie ld fa t (%) fa t y ie ld (kg) pr ot ein (%) pr ot ein (%) RBV pr ot ein y ie ld (kg) RBV (kg) RBV A A/C C 44
306 ± 418
113 ± 11
–0.06 ± 0.20
A
8.86 ± 18.28
–0.04 ± 0.11
95.25 ± 10.61
8.55 ± 13.76
112.00 ± 10.87
A
A/C
E
32
140 ± 474
108 ± 12
0.02 ± 0.21
6.63 ± 15.52
0.01 ± 0.14
100.28 ± 12.98
5.03 ± 14.89
109.06 ± 11.72
A
A/C
D
53
125 ± 552
108 ± 14
0.04 ± 0.22
6.87 ± 19.64
0.02 ± 0.13
101.04 ± 11.56
4.96 ± 16.56
108.58 ± 13.01
A
A/DE
18
74 ± 346
107 ± 8
–0.05 ± 0.20
b
0.11 ± 13.20
–0.01 ± 0.13
98.50 ± 12.00
1.94 ± 10.84
106.67 ± 8.66
A
A/DD
16
263 ± 461
112 ± 12
–0.06 ± 0.15
c
8.19 ± 20.45
–0.03 ± 0.09
96.18 ± 8.10
6.69 ± 13.50
110.81 ± 10.73
A
A/E
E
6
63 ± 372
105 ± 12
0.03 ± 0.17
4.50 ± 16.21
–0.06 ± 0.11
93.67 ± 10.25
–0.33 ± 14.80
102.83 ± 14.39
K
A/C
E
4
–153 ± 524
101 ± 13
0.19 ± 0.30
3.50 ± 6.76
0.09 ± 0.13
107.25 ± 11.44
–1.50 ± 16.13
104.25 ± 12.84
K
A/C
D
9
–38 ± 771
104 ± 19
0.24 ± 0.27
Ab
c
11.11 ± 27.51
0.02 ± 0.12
101.22 ± 11.40
–0.33 ± 25.83
104.67 ± 20.24
K
A/DD
3
17 ± 658
105 ± 16
0.10 ± 0.45
5.67 ± 18.15
–0.05 ± 0.06
94.33 ± 5.78
–2.00 ± 21.17
103.33 ± 16.44
F -te st 1.126 1.196 2.845* 0.472 1.417 1.521 0.788 0.496 R 2 0.005 0.008 0.074 –0.024 0.018 0.022 –0.009 –0.002 RB
V = r
el ative br ee ding v alue (%) value
s in one c
olumn w ith iden tic al le tters diff er sig nific an tly
A(P
< 0.01),
b(P
< 0.05)
*
P
Finally, the effect of the alleles at the KU site
within the group of 232A/232A sires was evaluated
(Table 7). The differences were not significant;
the allele E showed to be linked to lower EBV of
milk, fat, and protein yield, and the relation to the fat and protein content was neutral. This is in concordance with Sanders et al. (2006) who found the interallelic differences to be insignificant but the influence of haplotypes to be significant.
Together with other markers analyzed in Czech
Simmental (Boleckova et al. 2012), the DGAT1
locus should be studied intensively, as the breed-ing potential is high. Then, the genomic approach (Schopen et al. 2009; Pribyl et al. 2010, 2012, 2013; Matejickova et al. 2013; Szyda et al. 2013) could be completed by the known major genes con-cerning milk performance and by the biometric approach (Sigl et al. 2012; Meszaros et al. 2013; Zavadilova and Stipkova 2013; Zavadilova and Zink 2013). When different effects depending on the breed are found, e.g. Suchocki et al. (2010) noted a stronger effect in Jersey than in Holstein, the gene polymorphisms should be evaluated regard-ing the breed. In the paper, we have analyzed the dual-purpose Czech Simmental cattle, as in most cases the dairy breeds, predominantly Holstein, are in the spotlight.
ConCluSIon
Concludingly, in the K232A polymorphism the
K allele was associated significantly with higher
estimated breeding values of fat content and vice
versa for the AA genotype and A allele. The CC
genotype in the KU polymorphism was associated
significantly with lower EBV for fat and protein
percentage. Both C allele and CC genotype were
linked to higher EBV for milk yield, so the fat and protein yield were linked positively, but
non-signif-Table 7. Estimated breeding values for different KU alleles in 232A/232A homozygous sires
KU
allele1 n
Trait milk yield
fat (%) fat yield (kg) protein (%) protein (%) RBV protein yield
kg RBV kg RBV
C 173 220 ± 477 110 ± 12 –0.02 ± 0.21 7.83 ± 18.11 –0.01 ± 0.13 97.95 ± 11.61 6.80 ± 14.86 110.41 ± 11.73
D 103 159 ± 493 109 ± 12 –0.01 ± 0.20 6.10 ± 18.90 –0.01 ± 0.12 99.08 ± 10.78 4.97 ± 14.68 108.94 ± 11.60
E 62 106 ± 414 107 ± 11 0.00 ± 0.20 4.32 ± 15 –0.01 ± 0.13 98.48 ± 12.21 3.10 ± 13.64 107.16 ± 11.41
R2 0.020 0.025 0.033 0.005 0.030 0.037 0.010 0.019
RBV = relative breeding value (%)
1differences among alleles were not significant
icantly. The combined genotypes of K232A and KU
polymorphisms and the EBV for the fat percentage
were linked significantly, and the combination AA/
CC may have some breeding potential. The K232A
polymorphism explained at the most of 6.2% of
variability of estimated breeding value, the KU
polymorphism of 4.4%, and the SA polymorphism
of 4.2%. The combined genotypes K232A and KU
explained at the most of 7.4% of variability. In all polymorphisms, the highest proportion of EBV variability was explained for fat percentage. Defi-nitely, there is promising that repeated analyses in different breeds show the important role of the BTA14 region in controlling milk performance.
Acknowledgement. The authors thank John P. McAvoy for the language revision.
REfEREnCES
Abdolmohammadi A., Atashi H., Zamani P., Bottema C. (2011): High resolution melting as an alternative method
to genotype diacylglycerol o-acyltransferase 1 (DGAT1)
K232A polymorphism in cattle. Czech Journal of Animal Science, 56, 370–376.
Bennewitz J., Reinsch N., Paul S., Looft C., Kaupe B., Wei-mann C., Erhardt G., Thaller G., Kuhn C., Schwerin M., Thomsen H., Reinhardt F., Reents R., Kalm E. (2004): The DGAT1K232A mutation is not solely responsible for the milk production quantitative trait locus on the bovine chromosome 14. Journal of Dairy Science, 87, 431–442. Boleckova J., Matejickova J., Stipkova M., Kyselova J., Barton
L. (2012): The association of five polymorphisms with milk production traits in Czech Fleckvieh cattle. Czech Journal of Animal Science, 57, 45–53.
Citek J., Rehout V., Hradecka E., Vecerek L., Panicke L. (2007): The breeding values of German Holstein sires
and the DGAT1 polymorphism. Archiv für Tierzucht,
[image:7.595.63.532.102.202.2]Gautier M., Capitan A., Fritz S., Eggen A., Boichard D.,
Druet T. (2007): Characterization of the DGAT1 K232A
and variable number of tandem repeat polymorphisms in French dairy cattle. Journal of Dairy Science, 90, 2980–2988.
Grisart B., Coppieters W., Farnir F., Karim L., Ford C., Berzi P., Cambisano N., Mni M., Reid S., Simon P., Spelman R., Georges M., Snell R. (2002): Positional candidate cloning of a QTL in dairy cattle: identification of a missense
muta-tion in the bovine DGAT1 gene with major effect on milk
yield and composition. Genome Research, 12, 222–231. Grisart B., Farnir F., Karim L., Cambisano N., Kim J.J.,
Kvasz A., Mni M., Simon P., Frere J.M., Coppieters W., Georges M. (2004): Genetic and functional
confirma-tion of the causality of the DGAT1 K232A quantitative
trait nucleotide in affecting milk yield and composition. Proceedings of the National Academy of Sciences of the United States of America, 101, 2398–2403.
HradeckaE., Citek J., Panicke L., Rehout V., Hanusova L.
(2008): The relation of GH1, GHR and DGAT1
polymor-phisms with estimated breeding values for milk produc-tion traits of German Holstein sires. Czech Journal of Animal Science, 53, 238–245.
Kuhn C., Thaller G., Winter A., Bininda-Edmonds O.R.P., Kaupe B., Erhardt G., Bennewitz J., Schwerin M., Fries R.
(2004): Evidence for multiple alleles at the DGAT1 locus
better explains a quantitative trait locus with major effect on milk fat content in cattle. Genetics, 167, 1873–1881. Looft C., Reinsch N., Karall-Albrecht C., Paul S., Brink M.,
Thomsen H., Brockmann G., Kuhn C., Schwerin M., Kalm E. (2001): A mammary gland EST showing linkage dis-equilibrium to a milk production QTL on bovine chromo-some 14. Mammalian Genome, 12, 646–650.
Matejickova J., Stipkova M., Sahana G., Kott T., Kyselova J., Matejicek A., Kottova B., Sefrova J., Krejcova M., Melcova
S.(2013):QTL mapping for production traits in Czech
Fleckvieh cattle. Czech Journal of Animal Science, 58,
396–403.
Meszaros G., Kadlecik O., Kasarda R., Solkner J. (2013): Analysis of longevity in the Slovak Pinzgau population – extension to the animal model. Czech Journal of Animal Science, 58, 289–295.
Pribyl J., Rehout V., Citek J., Pribylova J. (2010): Genetic evaluation of dairy cattle using a simple heritable genetic ground. Journal of the Science of Food and Agriculture, 90, 1765–1773.
Pribyl J., Haman J., Kott T., Pribylova J., Simeckova M., Vostry L., Zavadilova L., Cermak V., Ruzicka Z., Splichal J., Verner M., Motycka J., Vondrasek L. (2012): Single-step prediction of genomic breeding value in a small dairy cattle population with strong import of foreign genes. Czech Journal of Animal Science, 57, 151–159.
Pribyl J., Madsen P., Bauer J., Pribylova J., Simeckova M., Vostry L., Zavadilova L. (2013): Contribution of domestic production records, Interbull estimated breeding values, and single nucleotide polymorphism genetic markers to the single-step genomic evaluation of milk production. Journal of Dairy Science, 96, 1865–1873.
Riquet J., Coppieters W., Cambisano N., Arranz J.J., Berzi P., Davis S.K., Grisart B., Farnir F., Karim L., Mni M., Simon P., Taylor J.F., Vanmanshoven P., Wagenaar D., Womack J.E., Georges M. (1999): Fine-mapping of quantitative trait loci by identity by descent in outbred populations: application to milk production in dairy cattle. Proceed-ings of the National Academy of Sciences of the United States of America, 96, 9252–9257.
Sanders K., Bennewitz J., Reinsch N., Thaller G., Prinzen-berg E.M., Kuhn C., Kalm E. (2006): Characterization of the DGAT1 mutations and the CSN1S1 promoter in the German Angeln dairy cattle population. Journal of Dairy Science, 89, 3164–3174.
Schopen G.C.B., Koks P.D., van Arendonk J.A.M., Bovenhuis H., Visker M.H.P.W. (2009): Whole genome scan to detect quantitative trait loci for bovine milk protein composi-tion. Animal Genetics, 40, 524–537.
Sigl T., Meyer H.H.D., Wiedemann S. (2012): Gene ex-pression of six major milk proteins in primary bovine mammary epithelial cells isolated from milk during the first twenty weeks of lactation. Czech Journal of Animal Science, 57, 469–480.
Spelman R.J., Ford C.A., McElhinney P., Gregory G.C., Snell
R.G. (2002): Characterization of the DGAT1 gene in New
Zealand dairy population. Journal of Dairy Science, 85, 3514–3517.
Suchocki T., Komisarek J., Szyda J. (2010): Testing candidate gene effects on milk production traits in dairy cattle un-der various parameterizations and modes of inheritance. Journal of Dairy Science, 93, 2703–2717.
Szyda J., Zukowski K., Kaminski S., Zarnecki A. (2013): Test-ing different sTest-ingle nucleotide polymorphism selection strategies for prediction of genomic breeding values in dairy cattle based on low density panels. Czech Journal of Animal Science, 58, 136–145.
Thaller G., Kramer W., Winter A., Kaupe B., Erhardt G.,
Fries R. (2003): Effects of DGAT1 variants on milk
pro-duction traits in German cattle breeds. Journal of Animal Science, 81, 1911–1918.
Viitala S., Szyda J., Blott S., Schulman N., Lidauer M., Maki-Tanila A., Georges M., Vilkki J. (2006): The role of the bovine growth hormone receptor and prolactin receptor genes in milk, fat and protein production in Finnish Ayr-shire dairy cattle. Genetics, 173, 2151–2164.
production in the Israeli Holstein population. Journal of Dairy Science, 86, 2219–2227.
Winter A., Kramer W., Werner F.A.O., Kollers S., Kata S., Durstewitz G., Buitkamp J., Womack J.E., Thaller G., Fries R. (2002): Association of lysine 232 alanine polymorphism in bovine gene encoding CoA:diacylglycerol
acyl-transferase (DGAT1) with variation at a quantitative trait
locus for milk fat content. Proceedings of the National Academy of Sciences of the United States of America, 99, 9300–9305.
Winter A., Alzinger A., Fries R. (2004): Assessment of the gene content of the chromosomal regions flanking bovine DGAT1. Genomics, 83, 172–180.
Zavadilova L., Stipkova M. (2013): Effect of age at first calving on longevity and fertility traits for Holstein cattle. Czech Journal of Animal Science, 58, 47–57.
Zavadilova L., Zink V. (2013): Genetic relationship of func-tional longevity with female fertility and milk production traits in Czech Holsteins. Czech Journal of Animal Sci-ence, 58, 554–565.
Received: 2013–05–14 Accepted after corrections: 2014–03–04
Corresponding Author