Cardiff Economics
Working Papers
Helmuts
Ā
zacis and Max Gillman
Baltic Tax Reform
E2008/6CARDIFF BUSINESS SCHOOL
WORKING PAPER SERIES
This working paper is produced for discussion purpose only. These working papers are expected to be published in due course, in revised form, and should not be quoted or cited without the author’s written permission.
ISSN 1749-6101
February 2008, updated October 2008
Cardiff Business School Cardiff University Colum Drive Cardiff CF10 3EU United Kingdom t: +44 (0)29 2087 4000 f: +44 (0)29 2087 4419 www.cardiff.ac.uk/carbs
Flat Tax Reform: The Baltics 2000 - 2007
Helmuts ¯
Azacis
Cardi¤ Business School
Max Gillman
Cardi¤ Business School
EIHAS, Budapest
October 28, 2008
Abstract
The paper presents an endogenous growth economy with a repre-sentation of the tax rate system in the Baltic countries. Assuming that government spending is a given fraction of output, the paper shows how a ‡at tax system balanced between labor and corporate tax rates can be second best optimal. It then computes how actual Baltic tax reforms from 2000 to 2007 a¤ect the growth rate and wel-fare, including transition dynamics. Comparing the actual reform e¤ects to hypothetical tax experiments, it results that equal ‡at tax rates on personal and corporate income would have increased welfare in all three Baltic countries by 24% more on average than the actual reforms. This shows how equal, balanced, ‡at rate taxes can be opti-mal in both theory and practice. Further, movement towards a more equal balance between labor and capital tax rates, through changing just one tax rate, achieved almost as high or higher utility gains as in actual law for all three countries under both open and closed economy cases. This shows bene…ts of moving towards the optimum.
JEL: E13, H20, O11, O14
Keywords: tax reform, endogenous growth, transitional dynamics, ‡at taxes
1
Introduction
The theoretically optimal capital tax in a second-best setting is to build up revenue by initially taxing capital at high rates and then decreasing the capital tax to zero in the long run (Ljungqvist and Sargent, 2000). But in practice, there is not an obvious international trend towards zero capital tax rates, and an initial build-up of taxes does not appear to have been documented. What we do see is that the level of tax rates on both capital and labor have trended down over time; and perhaps they have become more “balanced”. For example in 1952 the US tax rate for the top-bracket of personal income was 92% and the top-bracket corporate income tax was 52% and now both of these are 35%.
However, evidence is more extensive for movements towards low ‡at taxes, which has been called “The Global Flat Tax Revolution”(Mitchell, 2007). A ‡at tax can refer to a single tax rate bracket on either personal or corporate income; there are many countries with a single tax bracket for each personal and corporate income tax rates; in some countries there are equal ‡at tax rates on both personal and corporate income (Romania- 16%; Serbia- 14%); and one at least even has equal rates on personal, corporate and on the value-added tax (Slovakia- 19%).
There are good reasons for these ‡at regimes in terms of the bene…ts of tax simpli…cation for these systems, and for low tax rates in terms of de-creasing the tax-induced disincentive to work, accumulate capital, and sell goods. It remains unclear however whether more balanced ‡at rate systems are better than more unbalanced ones. For example, the Baltic countries have low personal income tax rates but even lower corporate tax rates. And in contrast, Russia, Ukraine and Georgia have low ‡at corporate tax rates (24%) but even lower ‡at personal income tax rates (13%). One motivation for balanced personal and corporate rates is that tax evasion devices exist whereby the higher tax rate can be avoided in favor of the lower tax rate: for example the personal income tax rate can be evaded when company employ-ees become self-employed consultants so that their labor income is subject to the corporate tax rate rather than the personal tax rate.
more basic reasons for balanced ‡at rate tax systems to be preferred in terms of the optimum welfare of the economy. In particular, an economy is pre-sented in which the zero second-best optimal capital tax rate is replaced by a possible second-best optimum of balanced labor and capital tax rates. This results by assuming as in Barro (1990), Turnovsky (2000) and Funke and Strulik (2006) that government spending is a constant fraction of income, rather than exogenous and independent of income. The equal rate ‡at tax optimum combines the insight of Barro that a single ‡at tax income rate is equal to the government expenditure share and the extension in Turnovsky that with both labor and capital taxes, the equal ‡at rate on each tax is equal to the government expenditure share. This assumes zero bene…ts of non-transfer government spending. Applying this model to the Baltic coun-tries, by developing a detailed model of the economy and its tax system, the optimum is derived and then the e¤ects of actual tax reforms experienced from 2000 to 2007 are examined in light of the optimum. The details of the economy also allow for extension of the second-best optimum such that a "composite labor tax", which includes social security and VAT taxes, is equal to the corporate income tax rate and the government spending share. The Baltic tax reforms started in 1994 in Estonia, and by 2000 the average Baltic personal tax rates had fallen to 28% and average corporate tax rates to 16%. By 2007, the average Baltic tax rates had fallen further: to 25% for personal tax rates and to 10% for corporate tax rates. It emerges from the model that this tax regime is not well-balanced in that it is sub-optimally weighted towards higher labor taxes. Intuitively, the economy has a central feature that the return on human capital is equal to the return on physical capital along the balanced growth path, and this in part gives rise to the desirability of balancing composite labor and corporate tax rates.
After setting up the economy (Section 2), the paper next presents the social planner problem (Section 3). It then calibrates a baseline initially-closed economy model for each of the three Baltic countries (Section 4) and estimates the maximum possible utility gains from tax reform (Section 5.1) and the actual estimated utility gains from the 2000-2007 reforms (Section 5.2). For Latvia and Lithuania, it is shown that using only equal ‡at taxes, on personal and corporate income, to raise the same revenues as were raised
under the 2007 tax law would have been better than the actual tax reforms instituted by 2007. And again raising the same amount of revenue as in 2007, but by changing just one tax, it is shown that lowering the personal income tax, or social security contributions, moves the countries towards more “bal-anced”tax rates and raises welfare by more than did the actual reforms in all three countries (Section 5.3). Under open economy assumptions the order-ing of the bene…ts from changorder-ing individual taxes is preserved, although the bene…t of the reforms from 2000 to 2007 becomes smaller and actually turns negative for two of the Baltic countries (Section 6). Also it is shown how the improvement in welfare from changing individual tax rates depends upon the initial set of tax rates; this helps explain how seemingly contradictory results from other studies for the ranking of tax reforms can be explained by di¤erent initial sets of tax rates (Section 7).
Under both closed and open economy assumptions and starting from the 2000 law, the paper concludes that moving towards more balanced ‡at taxes, in terms of the labor tax versus the corporate income tax, improves welfare in the Baltic countries. The puzzle of the international movement towards ‡at and equal taxes rather than zero corporate taxes is partly addressed by this type of result. But also, as the optimum allows for lower personal tax rates than corporate tax rates when there are other taxes on social security and goods purchases, this analysis better rationalizes the Russia-Ukraine-Georgia case than those countries with relatively low corporate tax rates (Section 8).
2
The Endogenous Growth Economy
The endogenous growth model shares common elements with Kim (1998) and Devereux and Love (1994). As in Kim (1998), the paper introduces a realistic tax system while the speci…cation of preferences and technology resembles that of Devereux and Love (1994). A corporate sector, as the representative …rm, is introduced following Turnovsky (1995, Chapters 10 and 11), so as to account for di¤erent types of corporate income and dividend tax treatment. We assume that there are no new equity issues, that investment is …nanced by retained earnings, and that the remaining income is distributed as divi-dends. Also, as in Kim, we account for the added complexity of the di¤erence
between the actual depreciation rate and the accounting depreciate rate. The most closely related paper in terms of the study of tax reform in the Baltic countries is Funke and Strulik’s (2006) interesting analysis of Estonia’s 2000 tax reform. Although that paper assumes exogenous growth, while we use endogenous growth, it includes the e¤ect of transitional dynamics on welfare and includes a similar open economy analysis with a given world interest rate as in our economy extension in Section 7.
2.1
The Consumer Problem
The representative consumer’s utility, with > 0; 0 and 2 (0;1), depends at time t on consumption C and leisure time l:
U = 1 X t=0 t(Ctlt)1 1 : (1)
The consumer divides a time endowment of 1 between leisure, labour supplied for goods productionu, and time spent producing human capital in a non-market sector z:
1 =lt+ut+zt: (2)
Following Lucas (1988), the consumer uses human capital indexed labour for goods and human capital production. With human capital denoted byH, its depreciation denoted by h, and Ah a constant productivity parameter,
its accumulation is governed by
Ht+1 Ht=AhztHt hHt: (3)
The consumer derives income from the supply of labour to goods pro-duction at the real wage rate of w for e¤ective, quality-indexed labour, the holding of government bonds B, and the holding of corporate equity shares
E. Also the government provides a lump sum transfer T. The consumer spends the income on consumption goods and the acquisition of additional government bonds or corporate equity.
Taxes that the consumer faces are a personal income tax rate of p that
income, value added tax (VAT) rate of v that falls on goods purchases,
a dividend tax rate of d that falls on equity income, and a capital gains
tax rate of g that falls on net price gains on equity sales. Government
bond income and government transfers are treated as tax exempt. Withqt+1
the ex-dividend price on equities in period t with dividends paid starting in periodt+ 1, withrtE the equity dividend yield, and withrtthe interest yield
on government bonds, the budget constraint is
(1 p)(1 sw)wtutHt+ (1 +rt)Bt+ (1 d)rtEqtEt+Tt (4)
= g(qt+1 qt)Et+ (1 + v)Ct+Bt+1+qt+1(Et+1 Et):
It will be convenient to denote by Dt rtEqtEt the consumer’s dividends
that the corporate …rm pays out.
Using the time constraint (2) to Substitute in lt = 1 ut zt for leisure
in the utility function, the consumer maximizes utility (1) subject to (3) and (4) with respect to Ct, ut, zt, Ht+1, Bt+1, andEt+1, taking prices, taxes and
the bond and dividend rate as given. Let tand tbe Lagrangian multipliers
associated with the budget constraint (4) and human capital accumulation function (3), respectively. First order conditions are:
Ct lt(1 )= t(1 + v); (5) Ct1 lt(1 ) 1 = twt(1 sw)(1 p)Ht; (6) Ct1 lt(1 ) 1 = tAhHt; (7) t= [ t+1wt+1(1 sw)(1 p)ut+1+ t+1(Ahzt+1+ 1 h)]; (8) t= t+1(1 +rt+1); (9) tqt+1 = t+1[(1 d)rEt+1qt+1 g(qt+2 qt+1) +qt+2]: (10)
Combining (9) and (10) gives the arbitrage condition between bond and equity returns:
rt= (1 d)rtE+ (1
g)qt+1 qt qt
: (11)
Thus return on government bonds must be equal to after tax return from dividend yield and capital gains.
2.2
The Corporate Sector
The corporate …rm problem follows Turnovsky (1995, Chapters 10 and 11). Capital is stated in terms of the level of the usual economic capital K and in terms of the accounting level of the capital stock Ka. These di¤erent stock
levels are necessary in order to introduce properly the statutory depreciation rate , which causes the economic and accounting capital to be unequal if the statutory depreciation rate di¤ers from the economic one k. The accounting
level of capital evolves according to
Kta+1 = (1 )Kta+It; (12)
while the economic capital is given by
Kt+1 = (1 k)Kt+It: (13)
Output Y is produced with Cobb-Douglas function in physical capital and e¤ective labour; with 2(0;1)
Yt=AKt(utHt)1 : (14)
Given a social insurance tax paid by the …rm on the wages, at the rate of se, the gross pro…ts are de…ned as
t =AKt (utHt)1 wt(1 + se)utHt: (15)
With the corporate income tax given by c, the pro…t net of taxes is(1 c) t.
Pro…ts paid in taxes c
t can be decreased by two other factors. First,
there may exist an investment subsidy sthat adds sIto pro…t in proportion
to the new investment (an “investment tax credit”). Second, taxable pro…ts are decreased by the depreciated amount of capital that adds c Ka
t to
after-tax pro…t. The net pro…t is used to pay out dividendsD and to …nance new investment
(1 c) t+ sIt+ c Kta =Dt+It: (16)
The speci…cation of (16) assumes that investment is …nanced only from pro…ts of the …rm, and not by the issue of new equities. The latter is justi…ed by the under-developed nature of …nancial markets in the Baltics, making
equity …nancing expensive. Only the initial equity issues are positive, and then held constant over time, so that
E0 =:::=Et=Et+1: (17)
This corresponds to the privatization programs and other forms of initial public o¤erings, whereby additional equity o¤erings cannot be supported in the market. The speci…cation also rules out corporate bonds or bank credit.
De…ne the value V of equities at a given time as
Vt qtEt: (18)
Given the assumption (17), the arbitrage condition (11) gives the di¤erence equation in the value of equities as
Vt+1 =Vt 1 + rt
1 g
1 d
1 g Dt: (19)
From (16) dividends equal
Dt = (1 c) t (1 s)It+ c Kta; (20)
and the equation of motion for the value of the corporate …rm, equation (19), becomes Vt+1 =Vt 1 + rt 1 g 1 d 1 g [(1 c ) t (1 s)It+ c Kta]: (21)
Equation (21) gives the result, by the coe¢ cient of Vt term, that the
cost of capital is independent of the dividend yield and the tax rate on dividends. Solving the di¤erence equation (21) gives that the current value of outstanding equities is equal to the present value of the discounted stream of future cash ‡ows;
V0 = 1 d 1 g 1 X t=0 (1 c) t (1 s)It+ c Kta Qt j=0 1 + rj 1 g : (22) However, expression (22) is in terms ofKa, the accounting capital, while
needs to be put in terms of K. Investment made at date t can be brought together from the terms in (22) to give that the present value of tax sav-ings from future depreciation of date tinvestment (see Atkinson and Stiglitz (1980, Lecture 5)), as denoted by m, is equal to1
mt= c 1 X j=1 (1 )j 1 Qj i=1 1 + rt+i 1 g ; (23)
which has the recursive form of
mt= c 1 + rt+1 1 g + 1 1 + rt+1 1 g mt+1:
Now the expression (22) can be rewritten, with substitution for from equation (15) and for I from equation (13), as
V0 = 1 d 1 g 1 X t=0 t Y j=0 (1 + rj 1 g) 1 (1 c) AKt(utHt)1 (24) wt(1 + se)utHt] (1 s mt) [Kt+1 Kt(1 k)] + c K0a(1 )t :
The …rm maximizes equation (24) with respect to capitalKt+1 and
e¤ec-tive labor ut to yield the …rst-order conditions;
(1 s) rt 1 g + k +mt( k) c = (1 c) A Kt utHt 1 ; (25) wt(1 + se) = (1 )A Kt utHt : (26)
For example, with g = s = = 0 the after tax input price ratio is rt+ k wt(1 + se)(1 c) = a 1 utHt Kt :
2.3
Government sector
The government receives income from taxes on consumption goods, labour wage income to the consumer and labour wage payments by the …rm, capital gains, dividend payments, pro…ts, and new bond issues. Expenditures are for government spending , interest payments and redemption of bonds, and the lump sum transfer T. This implies the temporal government budget constraint: (1 +rt)Bt+ t+Tt (27) = Bt+1+ vCt+ [ sw+ (1 sw) p+ se]wtutHt+ g(qt+1 qt)Et + drEt qtEt+ c[AKt(utHt)1 (1 + se)wtutHt Kta] sI t:
Transversality conditions also apply whereby as time tends to in…nity the discounted value of each the bond and the equity holdings by agents, and the capital stock held by …rms, approaches zero.
It is assumed that government runs a balanced budget every period and that there are no outstanding government bonds at datet = 0: B0 = 0. Then
the transfer each period is the di¤erence between government revenue and expenditure. And it is assumed that government expenditure texogenously
grows at the rate of output growth gt for each t, so that t=Yt is a given
constant 2(0;1) :
t = Yt: (28)
2.4
Balanced-Growth Path Equilibrium
The balanced-growth path (BGP) equilibrium is derived from …rst order con-ditions (5)–(9) and (25)–(26), with the shares of time allocation for di¤erent activities being stationary while the variables Y, C, K, I, H all grow at common BGP growth rate, denoted by g. To solve for the equilibrium as a single implicit equation in terms of onlyg;the ratios YC and YI are solved and substituted into the social resource constraint
1 = Ct Yt + It Yt + t Yt : (29)
Dropping time subscripts, the time allocation and human capital accumu-lation equations (2)-(3) imply that the growth rate is the following function
of leisure l and work u:
g =Ah(1 l u) h: (30)
Using equations (6)-(9), the interest rate in terms of l is
r =Ah(1 l) h; (31)
stating that the net return on physical capital equals the net return on human capital. Equations (30)- (31) imply a leisure to work ratio of
l u =
Ah h r
r g ; (32)
which is used now to solve for CY:The marginal rate of substitution between goods and leisure, from equations (5)-(6), is
C l =
(1 sw)(1 p)wH
1 + v : (33)
Solving for the wage rate from the output production function and the mar-ginal product of labor condition, in equations (14) and (26), and substituting this into equation (33) gives the ratio CY in terms of ul :
C Y = (1 sw)(1 p) (1 + se)(1 + v) (1 ) l u; (34)
and using the ul ratio of equation (32), CY is then a function of g and r:
C Y = (1 sw)(1 p) (1 + se)(1 + v) (1 ) Ah h r r g : (35)
The ratio CY is then solved as a function of g alone by solving for r as a function of g from the Euler condition that results from equations (5) and (9):
(1 +g) = (1 +r): (36)
Next the ratio YI is solved by …rst dividing the investment equation (13) by Y :
I
Y = (g+ k) K
Simplifying the the steady state the expression for m in equation (23) to m = c r 1 g + ; (38)
the capital to output ratio KY is given by combining the output production function and the marginal product of capital equations, (14) and (25):
(1 c) Y K = 1 s c r 1 g + ! r 1 g + k : (39)
Solving for KY from equation (39) and substituting this into equation (37) gives the solution for I=Y in terms of r and g:Substituting this solution for
I=Y into the social resource constraint (29), gives the implicit solution forg
in terms of only r : 1 Y = (1 sw)(1 p) (1 + se)(1 + v) 1 Ah h r r g (40) + (g+ k)(1 c)(1 g) (1 s)r+ (1 s c)(1 g) r+ (1 g) r+ (1 g) k :
Given that Y is exogenous and equal to ; substituting into equation (40) for r from the Euler equation (36) gives an implicit equation only in g and allows all other BGP variables to be solved.
For example, the bond interest rate follows from equation (36); the time allocation among sectors comes from equations (30) and (31); the capital-output ratio from equation (39), the investment-capital-output ratio from equation (37), the consumption-output ratio from equation (34); and the …rst-order conditions for the …rm give the e¤ective labour to physical capital ratio and the wage rate. The share of pro…ts in total output is obtained from (15).
Given equations (36) and (40), the dividend and equity values relative to the capital stock can be solved as well. From equation (12) the balanced-growth path ratio Ka=Y is
Ka Y = 1 g+ I Y = g+ k g+ K Y ; (41)
giving that the steady state dividends to physical capital ratio D=K; from equations (15), (20), (25), (26) and (41), is
D K = (1 s ) r 1 g g ; (42) where is = c ( k) r (1 g) + (g+ ) ;
and where it is noted that g is independent of the tax rate on dividends, by equation (40). From equation (19), the steady state equity value to physical capital is given by V K = (1 d) (1 g)(1 s ): (43)
McGrattan and Prescott (2005) derive a similar expression for the value of the …rm; similar to their Propositions 2 and 5, it can be shown that if changes in the tax on dividends are o¤set by changes in lump-sum transfers, then the equilibrium path is unchanged.2
3
Social Planner Optimum
The social planner maximizes utility in equation (1), subject to time and goods constraints in equations (2) and (29), technology in equations (14) and (3), capital accumulation in equation (13) and the government spending condition in equation (28). The competitive equilibrium conditions that replicate the social planner …rst-order conditions achieve the second-best optimum given positive government expenditure; zero taxes and zero gov-ernment expenditure are the …rst-best optimum. The following proposition
2Note that in Turnovsky (1995, chapters 10 and 11), the personal income tax falls
on income from wages, interest income and dividends, while in our paper each of these income sources has a di¤erent tax rate according to the tax structure of the Baltics; here interest income from the government bonds is not taxed. This results in the dividend tax not having a growth e¤ect. And although Turnovsky (1995, ch. 11) also …nds that the personal income tax does not a¤ect the cost of capital when investment is …nanced through retained earnings, the personal income tax still a¤ects the interest rate and hence the growth rate in Turnovsky and here.
states one such second-best optimum, which is a special case of Turnovsky (2000).
Proposition 1 Given sw = se = v = g = s = = 0; equal ‡at rate
taxes on personal and corporate income are second-best optimal.
Proof. The …rst order conditions of the social planner’s problem are similar to the ones obtained from the consumer and …rm problems. But now, instead of (34) in the representative agent problem, by whichCt
Yt = h (1 sw)(1 p) (1+ se)(1+ v) i (1 )lt ut, the social planner consumption ratio is
Ct Yt
= [1 ](1 ) lt
ut
: (44)
And in the social planner’s problem the …rst order conditions with respect to Ct and Kt+1 are Ct lt"(1 ) = t and t= t+1 " (1 ) A Kt+1 ut+1Ht+1 1 + 1 k #
where t is the Lagrange multiplier of the social resource constraint. This
implies that the Euler equation is
Ct l"t(1 )= Ct+1l"t+1(1 ) " (1 ) A Kt+1 ut+1Ht+1 1 + 1 k # : (45) De…ning the interest rate rt as
rt 1 Ct 1 Ct lt 1 lt "(1 ) 1; (46)
which is equal to rt in the competitive equilibrium (equations (5) and (9)),
then equations (45)-(46) imply that
rt+ k= (1 ) A Kt utHt
1
In the competitive equilibrium problem, the comparable equation is (25), by which(1 s) rt 1 g + k +mt( k) c = (1 c) A Kt utHt 1 , where mt = c P1j=1 (1 ) j 1 Qj i=1(1+ rt+i 1 g)
from equation (23). Comparing equations (34) and (44), and (25) and (47), it can be seen that one way to implement this optimum is to set equal tax rates on personal and corporate income, at a level equal to the share of government expenditure in output: p = c = , with all other tax and subsidy rates set to zero ( sw = se= v = g = s = = 0). The equal ‡at tax rate optimum holds both along the transition path towards and at the BGP equilibrium. And the balanced tax optimum of
p = c = is found also in Turnovsky (2000), using his equations (19a)
and (19b) under the assumptions that v = 0 and that government spending
has zero utility or productive e¤ect, as in our economy. More generally, Turnovsky derives results with positive e¤ects of government spending.3
More generally, as an extension of Turnovsky (2000), the optimum can be similarly characterized when the social security and VAT tax rates, sw;
se and v; are not restricted to be zero.
Corollary 2 Given g = s = = 0; rather than equal personal and
corpo-rate income tax corpo-rates, a balanced tax corpo-rate optimum is now an equalization of the composite labor tax rate, de…ned as 1 (1(1+ swse)(1+)(1 vp)); and the corporate
tax rate:
1 (1
sw)(1 p)
(1 + se)(1 + v) =
c = :
This corollary’s more realistic setting implies that with positive social security and VAT taxes, sw > 0, se > 0 and v > 0, the personal income
tax rate must be less than to achieve the optimum. The importance of this is that corporate tax rates would be higher than personal income tax rates
3If government consumption is utility-enhancing as in Turnovsky (2000), then U =
P1
t=0
t(Ctlt t)1
1 ; and the condition for the second best optimum in Proposition 1
be-comes p= c= C Y with
v= sw = se= 0. Since, in general,C
t=Ytis not constant
along the transition path, the second best cannot be attained with constant tax rates, but it can still hold in the steady state. In the …rst best the share of government consumption is then given by = C
in the optimum, even while the composite labor tax rate and corporate tax rate remained equal.
In the actual calibration of the model, given in the next section, the assumptions in the corollary are not too far amiss. For example, s = 0 is assumed in the corollary while the investment subsidy s was zero only in Latvia and Estonia, and was 24% in Lithuania in 2000 (and zero in all countries in 2007). With s >0; an optimum would result if the balance of
tax rates were modi…ed from that given in the corollary to1 (1(1+ swse)(1+)(1 vp)) = c s
1 s = : In e¤ect, the corporate tax rate would need to be even higher than in the corollary.
Or, alternatively, if = k and s = g = ; instead of instead g = s = = 0as in the corollary, then the economic and accounting depreciation
rate would be the same and a positive investment tax would be combined with a subsidy to capital gains. In this case, the exact same balance of tax rates results as stated in the corollary.
4
Calibration of the Baseline Model for 2000
4.1
Summary of 2000, 2007 Tax Systems
Information about the tax rates in the year 2000 of the Baltic states is con-tained in IMF country reports (1998; 1999a; 1999b; 2000a; 2000b; 2001), while information on the 2007 tax rates can be found on the web-sites of the Ministries of Finance of all three countries. Table 1 summarizes the tax rates that are found in law and that are used in the baseline calibration of the 2000 Baltic tax regimes. Further descriptions of the tax structures of each of the Baltic countries is found in Appendix A.1. In summary, while there are di¤erences in tax rates across the Baltics, the similarities in the major taxes that form most of the government tax revenue show a high de-gree of "harmonization" in both 2000 and 2007. The tax rate changes from the baseline of 2000 to the new rates in 2007 are studied in the next section.
Table 1: Tax Rates in Baltic Countries for Calibration
Tax Rate Values Estonia Latvia Lithuania Estonia Latvia Lithuania 2000 2000 2000 2007 2007 2007 Consumption tax v 0.18 0.18 0.18 0.18 0.18 0.18 Personal income tax p 0.26 0.25 0.33 0.22 0.25 0.27 Social security contribution
by workers sw 0.00 0.09 0.01 0.00 0.09 0.03 by employers se 0.33 0.28 0.30 0.33 0.2409 0.31 Corporate income tax c 0.00 0.25 0.24 0.00 0.15 0.15 Tax on dividends d 0.26 0.00 0.29 0.22 0.00 0.15 Tax on capital gains g 0.26 0.00 0.15 0.22 0.00 0.15 Investment subsidy s 0.00 0.00 0.24 0.00 0.00 0.00 Statutory tax depreciations 0.00 0.40 0.00 0.00 0.40 0.20
4.2
Baseline Calibration at Year 2000
Technological parameters are comprised by scale parameters of the human capital production function Ah, and the market good production functionA,
the share of physical capital income in output and the ‘true’depreciation rates of physical and human capital k and h: Preferences parameters are
the coe¢ cient of relative risk aversion , the leisure weight and the discount factor .
Assuming that the economies are in the steady state before the tax rate changes, three of these parameters are estimated separately for each country using annual GDP data for 1995-2000: is set equal to the average share of government consumption in domestic demand, that is, GDP less net export, while the parameters andAh are chosen to match the average shares of
in-vestment and consumption in domestic demand, respectively, using equations (35), (37) and (39). These parameter estimates are based on GDP statis-tics by the expenditure approach at current prices, obtained from the online databases of national statistical o¢ ces (Statistics Estonia, Central Statistical Bureau of Latvia, Statistics Lithuania). Note that the resulting value of is approximately 0:2; which is also used in Funke and Strulik’s (2006) study of Estonian tax change.
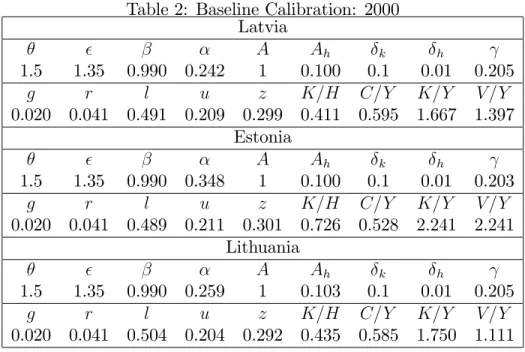
Table 2 reports the parameter values and the implied steady state values for each country. The values of di¤er substantially due to considerable di¤erences in the average ratios of investment to domestic demand across the Baltic states. The lowest ratio is 20% for Latvia, while the highest is26:9% for Estonia. And, consequently, Latvia has the highest and Estonia the lowest
C=Y ratio since the shares of government consumption are approximately the same. This, in turn, results in the highest steady stateK=H andK=Y ratios for Estonia and the lowest ratios for Latvia. In the case of Estonia, the stead state value of the …rm is equal to the capital stock according to (43) since
d = g and s = = 0.4 While for Lithuania the market value of a unit
of the …rm’s capital V =K is the lowest. No data appear to be available on the capital to output ratioK=Y and the value of equity to output ratioV =Y
for the Baltic countries; but for comparison to Table 2 note that McGrattan and Prescott (2005, Tables 4 and 5) report that the (sum of tangible and intangible) capital to output ratio was1:68for the U.S. and was1:96for U.K. during 1990-2001, while the value of equity to output ratio, respectively, was 1:576and1:845during 1998-2001. The allocation of time is similar across the countries, with the share of time devoted to both goods and human capital production being the highest in Estonia and the lowest in Lithuania.
The rest of the parameters are set equal across the three Baltic states. The coe¢ cient of relative risk aversion is set at = 1:5;the discount factor is = 0:99; and the utility weight for leisure weight is selected to ensure that approximately 21% of time is spent on work (1840 annual hours of work). The long run growth rate is common for all three countries and is set at 2%. Finally, the scale parameterA a¤ects the ratio of physical to human capital in the economy and this is normalized to A = 1. We assume that physical capital becomes obsolete at a faster rate than human capital, setting k = 0:1
and h = 0:01 in all three countries, similar to Jones, Manuelli and Siu
(2005) who discuss the di¤erent estimates of h at length. The steady state
interest rate in each country is set equal to the world interest rate of 4:1% used in McGrattan and Prescott (2000, Tables 4 and 5) that approximately corresponds to the risk-free rate on 30-year in‡ation-protected US Treasury bonds in the 1st quarter of 2000. Given that r = 4:1% and g = 2%, plus choosing leisure near to 50% and labour time near to 20% gives values for
Ah and h from equations (30) and (31).
4By substituting (26) and (25) into (24), one can verify that under Estonian tax system, Vt=Ktalso holds outside the steady state.
Table 2: Baseline Calibration: 2000 Latvia A Ah k h 1.5 1.35 0.990 0.242 1 0.100 0.1 0.01 0.205 g r l u z K=H C=Y K=Y V =Y 0.020 0.041 0.491 0.209 0.299 0.411 0.595 1.667 1.397 Estonia A Ah k h 1.5 1.35 0.990 0.348 1 0.100 0.1 0.01 0.203 g r l u z K=H C=Y K=Y V =Y 0.020 0.041 0.489 0.211 0.301 0.726 0.528 2.241 2.241 Lithuania A Ah k h 1.5 1.35 0.990 0.259 1 0.103 0.1 0.01 0.205 g r l u z K=H C=Y K=Y V =Y 0.020 0.041 0.504 0.204 0.292 0.435 0.585 1.750 1.111
4.3
Sensitivity Analysis
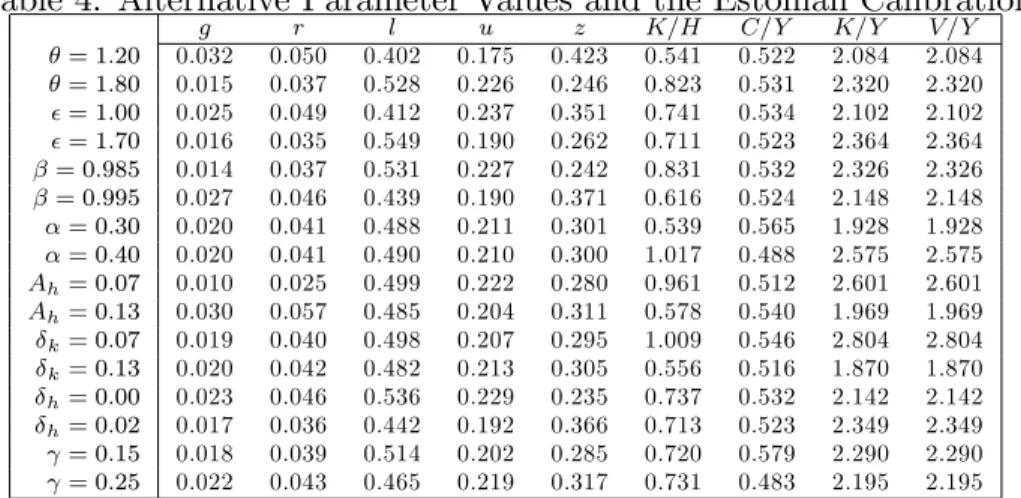
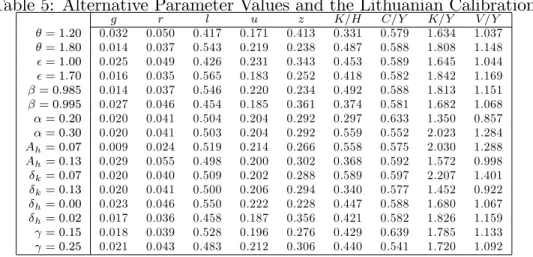
Tables 3-5 show one table for each Baltic country in which modi…ed results are obtained by varying one parameter at a time with all other parameters staying at the benchmark values. It results that for all three countries, when a parameter is changed, the a¤ected variables move in the same direction. The largest variations in the growth rateg come from changes in utility para-meters and parapara-meters a¤ecting human capital accumulation. The discount factor and elasticity of relative risk aversion a¤ect g through (36) while a¤ects g through the leisure time and equation (31). The parameters of hu-man capital accumulation a¤ect growth rate through equations (30) and (31). The growth rate is stable to changes in the share of physical capital and the depreciation rate of physical capital k. So is time allocated to di¤erent
activities. Changes in the utility parameters that lead to higher growth also lead to a larger share of time devoted to human capital accumulation z. It is accompanied with a bigger variation in time devoted to leisure than to market activity. An increase in government consumption raises the growth rate but decreases one-for-one the consumption to output ratio C=Y. The
C=Y ratio also falls with the increase in the share of capital income in out-put but otherwise this ratio is relatively insensitive to parameter changes. The changes in value of equities to output ratioV =Y are positively correlated with the changes in the capital to output ratioK=Y, and the biggest changes in both ratios come from varying parameters of the market good production technology and kand the scale parameter of the human capital production
function Ah.
Table 3: Alternative Parameter Values and the Latvian Calibration
g r l u z K=H C=Y K=Y V =Y = 1:20 0.032 0.050 0.405 0.174 0.421 0.314 0.589 1.561 1.320 = 1:80 0.014 0.037 0.531 0.225 0.244 0.460 0.598 1.719 1.434 = 1:00 0.025 0.049 0.413 0.237 0.350 0.429 0.598 1.571 1.324 = 1:70 0.016 0.035 0.553 0.188 0.259 0.394 0.592 1.750 1.460 = 0:985 0.014 0.037 0.534 0.226 0.240 0.464 0.598 1.723 1.437 = 0:995 0.027 0.046 0.442 0.189 0.369 0.354 0.591 1.605 1.352 = 0:20 0.020 0.041 0.492 0.209 0.299 0.312 0.630 1.377 1.154 = 0:30 0.020 0.041 0.490 0.210 0.300 0.590 0.547 2.062 1.728 Ah= 0:07 0.009 0.025 0.506 0.219 0.275 0.514 0.587 1.908 1.579 Ah= 0:13 0.030 0.057 0.485 0.204 0.311 0.343 0.602 1.482 1.256 k= 0:07 0.020 0.041 0.496 0.208 0.296 0.563 0.604 2.126 1.746 k= 0:13 0.020 0.041 0.489 0.210 0.301 0.319 0.589 1.372 1.172 h= 0:00 0.024 0.046 0.537 0.228 0.235 0.424 0.597 1.600 1.346 h= 0:02 0.016 0.036 0.446 0.191 0.364 0.396 0.592 1.740 1.452 = 0:15 0.018 0.039 0.515 0.201 0.284 0.405 0.649 1.698 1.420 = 0:25 0.021 0.043 0.471 0.217 0.313 0.416 0.551 1.640 1.377
Table 4: Alternative Parameter Values and the Estonian Calibration
g r l u z K=H C=Y K=Y V =Y = 1:20 0.032 0.050 0.402 0.175 0.423 0.541 0.522 2.084 2.084 = 1:80 0.015 0.037 0.528 0.226 0.246 0.823 0.531 2.320 2.320 = 1:00 0.025 0.049 0.412 0.237 0.351 0.741 0.534 2.102 2.102 = 1:70 0.016 0.035 0.549 0.190 0.262 0.711 0.523 2.364 2.364 = 0:985 0.014 0.037 0.531 0.227 0.242 0.831 0.532 2.326 2.326 = 0:995 0.027 0.046 0.439 0.190 0.371 0.616 0.524 2.148 2.148 = 0:30 0.020 0.041 0.488 0.211 0.301 0.539 0.565 1.928 1.928 = 0:40 0.020 0.041 0.490 0.210 0.300 1.017 0.488 2.575 2.575 Ah= 0:07 0.010 0.025 0.499 0.222 0.280 0.961 0.512 2.601 2.601 Ah= 0:13 0.030 0.057 0.485 0.204 0.311 0.578 0.540 1.969 1.969 k= 0:07 0.019 0.040 0.498 0.207 0.295 1.009 0.546 2.804 2.804 k= 0:13 0.020 0.042 0.482 0.213 0.305 0.556 0.516 1.870 1.870 h= 0:00 0.023 0.046 0.536 0.229 0.235 0.737 0.532 2.142 2.142 h= 0:02 0.017 0.036 0.442 0.192 0.366 0.713 0.523 2.349 2.349 = 0:15 0.018 0.039 0.514 0.202 0.285 0.720 0.579 2.290 2.290 = 0:25 0.022 0.043 0.465 0.219 0.317 0.731 0.483 2.195 2.195
Table 5: Alternative Parameter Values and the Lithuanian Calibration g r l u z K=H C=Y K=Y V =Y = 1:20 0.032 0.050 0.417 0.171 0.413 0.331 0.579 1.634 1.037 = 1:80 0.014 0.037 0.543 0.219 0.238 0.487 0.588 1.808 1.148 = 1:00 0.025 0.049 0.426 0.231 0.343 0.453 0.589 1.645 1.044 = 1:70 0.016 0.035 0.565 0.183 0.252 0.418 0.582 1.842 1.169 = 0:985 0.014 0.037 0.546 0.220 0.234 0.492 0.588 1.813 1.151 = 0:995 0.027 0.046 0.454 0.185 0.361 0.374 0.581 1.682 1.068 = 0:20 0.020 0.041 0.504 0.204 0.292 0.297 0.633 1.350 0.857 = 0:30 0.020 0.041 0.503 0.204 0.292 0.559 0.552 2.023 1.284 Ah= 0:07 0.009 0.024 0.519 0.214 0.266 0.558 0.575 2.030 1.288 Ah= 0:13 0.029 0.055 0.498 0.200 0.302 0.368 0.592 1.572 0.998 k= 0:07 0.020 0.040 0.509 0.202 0.288 0.589 0.597 2.207 1.401 k= 0:13 0.020 0.041 0.500 0.206 0.294 0.340 0.577 1.452 0.922 h= 0:00 0.023 0.046 0.550 0.222 0.228 0.447 0.588 1.680 1.067 h= 0:02 0.017 0.036 0.458 0.187 0.356 0.421 0.582 1.826 1.159 = 0:15 0.018 0.039 0.528 0.196 0.276 0.429 0.639 1.785 1.133 = 0:25 0.021 0.043 0.483 0.212 0.306 0.440 0.541 1.720 1.092
5
Tax Reform E¤ects from 2000-2007
After setting out the compensating utility measure, Section 5.1 establishes the maximum possible gains from tax reforms, starting with the 2000 baseline system and moving to the (second-best) optimum of ‡at rate taxes as in Proposition 1. Section 5.2 presents the actual growth rate and utility changes of the 2000 to 2007 reforms. And Section 5.3 shows the contribution of each type of tax to growth and welfare under the assumption that the same tax revenue is raised as in 2007, when only the one tax is changed; this provides a comparison of the di¤erent taxes in the sense of which are best ones to use to raise revenue. Note that all comparisons of actual and experimental reforms are conducted using the long run steady state and always include the transition dynamics; in other words, we calculate the welfare gains accruing from the date of reform to in…nity.
With tax reform, the initial post-reform state of the economy is not at its steady state equilibrium. Therefore, to calculate welfare gains from a tax reform, the transition dynamics to the new steady state must be taken into account. For that, we …rst solve for the policy functions relating di¤erent economic variables to the state variables, as described in Appendix A.2.
Lu-cas (1990) and de…ning the indirect utility function W( ; )as W( ; ) = 1 X t=0 t((1 + )Ctlt)1 1 :
This is the utility the consumer obtains under the tax system
= c; p; sw; se; v; d; g; s; when in addition there is a consumption
supplement of Ct at each date t. When the tax system changes from a
set of initial rates, say old; to a new set of rates, say new; the percent of
consumption goods that compensate utility for the new tax system new is
equal to the that equates utility in the new regime to the utility of the old regime (when = 0), as given by the following standard equation:
W( ; old) =W(0; new): (48)
Assuming the economy is in the steady state under the old tax system, then
Ct=C0(1 +g)t while lt is constant and W( ; old)is equal to W( ; old) =
((1 + )C0l )1 1
1
1 (1 +g)1 ;
where C0, l and g are steady state values corresponding to the baseline
cal-ibration. Here human capital is normalized at date t = 0 to H0 = 1. The
representation of W(0; new) is more complex in that it includes
consump-tion and leisure both along transiconsump-tion path and in the new steady state; this is computed numerically.
5.1
Maximum Possible Gain From Tax Reform
In this economy, the gain from moving to the second-best optimum of equal ‡at rate taxes on personal and corporate income provides an upper bound to the potential welfare gains from tax reform. The implementation of the second-best optimum assumes that the Baltic economies start in steady state in 2000, and move to the new second-best optimum. Table 6 reports values of variables in the steady state of the second best optimum; Table 7 summarizes the total welfare gains including transition dynamics and the impact on the government budget as a result of going to the second best optimum. The
total utility gains, in consumption terms, for Latvia, Estonia and Lithuania, respectively, are = 13:75%, = 11:18% and = 16:27%. The steady state growth rate increases by almost one percentage point in all three economies. Table 7 also shows the impact of the tax changes on revenues, where notationally, P V R is the present value of government revenues, P V T the present value of government transfers andP V Y the present value of output. The table indicates that a result of such a ‡at rate policy is that the present discounted value of all future tax revenue falls; for example, in the case of Latvia the decline is from 5.791 to 2.395. However the model does allow implementation of the second best outcome with the same revenue as in 2000 by using in addition the VAT tax, if there are no restrictions on the signs of tax rates. With sw = se= 0;equations (34) and (44) imply that a necessary
condition for optimality is 1
p
1 + v = 1 . Given that this condition holds
and using equation (33), the sum of consumption and personal income tax revenues is vC t+ pwtutHt = v(1 p)w tltHt (1 + v) + pw tutHt = v(1 ) lt ut + ut wtHt
In case of Latvia, when moving from the tax system of 2000 to this second best tax regime, all along the transition path the term[(lt= ) ut]is positive.
This means that government revenue is maximized if v is set as high as possible, and employment is subsidized, p < 0. The government can raise
P V R = 5:791 as in the Latvian 2000 tax system, although not realistically, with c = 0:205, v = 8:1453, p = 6:2705 and the rest of taxes set equal
to zero.
5.2
Actual Utility Gain from Tax Reform
Table 8 summarizes the results of the marginal growth rate increases changes and the more signi…cant consumption-equivalent utility gains for the actual 2000 to 2007 tax changes in each of the Baltic countries, including transition dynamics. The utility gains are around 2%; with = 1:54%, 2:29%, and
Table 6: The Second Best Outcome Latvia g r l u z K=H C=Y K=Y V =Y 0.0285 0.054 0.362 0.255 0.384 0.342 0.634 1.251 1.251 Estonia g r l u z K=H C=Y K=Y V =Y 0.0277 0.053 0.370 0.252 0.378 0.629 0.565 1.816 1.816 Lithuania g r l u z K=H C=Y K=Y V =Y 0.0295 0.056 0.362 0.254 0.384 0.371 0.623 1.326 1.326
Table 7: Second Best Optimal Changes in Utility, Growth and Revenue Second Best Optimum
Latvia Estonia Lithuania
% 13.747 11.182 16.270 g 0.0085 0.0077 0.0095 P V R 2000 5.791 6.686 6.088 new 2.395 3.090 2.401 P V R -3.397 -3.596 -3.687 2000 0.205 0.203 0.205 new 0.205 0.203 0.205 P V T =P V Y 2000 0.269 0.213 0.289 new 0 0 0 P V R=P V Y 2000 0.474 0.416 0.494 new 0.205 0.203 0.205
2:64%for Latvia, Estonia and Lithuania. Estonia and Lithuania each reduced the personal income tax rate while Latvia did not, which may explain the bigger gains in these two countries. And Lithuania, with the highest gain, in addition reduced the corporate tax rate, while Estonia did not. Reform bene…ts of each tax is explored next in Section 5.3.
Note that the importance of including the transition dynamics is that without including them the ranking of the gains from reform changes some-what, although the magnitude of the gains only changes by about 10%. If the e¤ect of the transition dynamics is not included, the utility gain ^ is from going straight to the 2007 steady state, from the 2000 steady state; the results in this case would be that ^ = 1:693 for Latvia, 2:619% for Estonia and 2:366% for Lithuania. Estonia now would end up with the biggest gain. This change in rankings occurs because the transition dynamics cause Latvia and Estonia to have a lower gain, and Lithuania to have a bigger gain. As Appendix A.3 further details, the transition dynamics for Lithuania are dif-ferent because the capital stock in the 2007 steady state after the tax reform is lower than in the 2000 steady state, while for Latvia and Estonia the post-reform capital stock is higher. And in short, increasing the capital stock requires lower consumption on the transition, while decreasing the capital stock leads to higher consumption on the transition.
Table 8: Actual Reform Changes in Utility, Growth and Revenue 2000-2007 Actual Tax Changes
Latvia Estonia Lithuania
% 1.536 2.286 2.635 g 0.0006 0.0011 0.0008 P V R 2000 5.791 6.686 6.088 2007 5.551 6.232 5.782 P V R -0.240 -0.454 -0.306 2000 0.205 0.203 0.205 2007 0.205 0.203 0.205 P V T =P V Y 2000 0.269 0.213 0.289 2007 0.250 0.188 0.267 P V R=P V Y 2000 0.474 0.416 0.494 2007 0.455 0.391 0.472
In terms of tax revenue, and assuming here that the government share of output remains at ; Table 8 also shows that the P V R and the ratios of P V T =P V Y and P V R=P V Y of each country dropped modestly after the reform. Other equilibrium values for each of the countries are given in Table 9, which compare to the baseline in Table 2.
Table 9: 2007 Baltic Tax System Latvia g r l u z K=H C=Y K=Y V =Y 0.021 0.042 0.482 0.213 0.305 0.421 0.593 1.679 1.516 Estonia g r l u z K=H C=Y K=Y V =Y 0.021 0.043 0.472 0.216 0.311 0.751 0.524 2.252 2.252 Lithuania g r l u z K=H C=Y K=Y V =Y 0.021 0.042 0.492 0.208 0.300 0.418 0.593 1.674 1.583
5.3
Experimental Tax Reform
There are better ways in which tax rates could have been changed compared to the actual tax reforms, while keeping discounted tax revenues constant at the same lower level as was found post-reform (with P V R at 5.551, 6.232, and 5.782 for Latvia, Estonia and Lithuania). A simple way to show this is to consider decreasing just one tax so as to generate the entire revenue decrease of 2007, starting from the 2000 baseline, and to compare this result across all of the taxes, and for each country. Table 10 gives the new compen-sated utility gains from such experiments, with transition dynamics always included. Since some initial tax rates are zero or close to zero, almost half of the new rates end up being negative, which is not realistic. But still this experiment shows the welfare ranking of each tax, and it can be seen that the ranking is the same for all three economies. The highest gain is from lower-ing the personal income tax or social security contributions, followed by the VAT; the corporate income tax generates the lowest welfare gain (except for the 0 e¤ect of the non-distortionary dividend tax). This is consistent with
Lithuania and Estonia having higher gains from the 2000-2007 changes than did Latvia, in that Latvia did not decrease the personal income tax while the other two nations did.5
Table 10: Revenue Equivalent Changes of Each Tax
Latvia Estonia Lithuania
Tax Rate g % Tax Rate g % Tax Rate g %
p 0.2157 0.0208 2.0777 0.2065 0.0212 2.8098 0.2891 0.0211 2.9844 sw 0.0484 0.0208 2.0777 -0.0723 0.0212 2.8098 -0.0505 0.0211 2.9844 se 0.2241 0.0208 2.0777 0.2404 0.0212 2.8098 0.2252 0.0211 2.9844 v 0.1482 0.0205 1.2883 0.1290 0.0208 1.8218 0.1394 0.0206 1.7954 c -0.1238 0.0202 0.2309 -0.0763 0.0207 0.4913 0.1711 0.0206 0.5972 d -0.6701 0.0200 0 -0.3324 0.0200 0 -0.5928 0.0200 0 g -0.6496 0.0209 0.4580 -0.0007 0.0210 0.5558 -0.2671 0.0208 0.7153 s 0.0603 0.0205 0.3800 0.0774 0.0208 0.5143 0.3074 0.0206 0.6256
Table 11 shows that using higher but equal ‡at tax rates on personal and corporate income, with all other taxes set to zero as in the optimum of Proposition 1 and with the same revenue as is found for 2007, also leads to bigger welfare gains than the actual reforms for all countries. The gains are 2:214; 2:556 and 3:032 for Latvia, Estonia and Lithuania, as compared to 1:536,2:286 and 2:635 in Table 8 for the three countries under the actual reforms, for a simple average of 24% higher gains in the Baltics.
And the ‡at tax gains are bigger than the gains seen in all of the previous experiments in Table 10 for Latvia and Lithuania. For Estonia, the …rst three tax reductions in the personal and social security taxes yield a gain of2:81% in Table 10 which is better than the 2:56% gain from the ‡at tax policy in Table 11. In sum, the experiments show that equal ‡at rate taxes are very attractive, but also that just balancing out the system better in terms of reducing the composite labor tax can be the best reform.
5We do not report revenue equivalent changes in the depreciation rate . First, in the
case of Estonia, variations in the depreciation rate do not a¤ect tax revenues because c=
0. Second, in the case of Latvia a value of cannot be found that generatesP V R= 5:551
without leading to an explosive path ofka
t. For Lithuania, = 0:6203%when = 0:0190,
Table 11: Revenue Equivalent Tax Changes with Flat Tax
c = p
Latvia Estonia Lithuania
c = p 0.447 0.394 0.456 % 2.214 2.556 3.032 g 0.0012 0.0017 0.0016 P V R 2000 5.791 6.686 6.088 new 5.551 6.232 5.782 P V R -0.240 -0.454 -0.306 2000 0.205 0.203 0.205 new 0.205 0.203 0.205 P V T =P V Y 2000 0.269 0.213 0.289 new 0.242 0.191 0.251 P V R=P V Y 2000 0.474 0.416 0.494 new 0.447 0.394 0.456
6
Open Economy Case
The results of the tax reform analysis also hold in the open economy case, which is the case assumed in Funke and Strulik (2006). Now allowing the Baltics to borrow capital on the international market, thenBt in consumer’s
budget constraint is de…ned as net foreign assets, rather than government bonds. EliminatingBt from the government budget constraint, it is assumed
that the government runs a balanced budget every period. Consumer and …rm problems are the same as in the case of a closed economy model, and consequently the same …rst order conditions together with the budget con-straints still describe the equilibrium solution. However, in addition it is assumed that the world interest rate is constant and equal to r = 0:041 as in the baseline calibration. These assumptions imply zero net trade before the tax reform, and it is assumed that initially the consumer has zero foreign assets, so that B0 = 0.
Table 12 states the new steady state values corresponding to the 2007 tax rates; the table also reports net exports Xt=Yt and net foreign assets Bt=Yt normalized by output. Given a constant interest rate, the growth rate
the steady state, all three countries run a trade de…cit of 2-3% of output. The welfare gain from the tax changes for Latvia, Estonia and Lithuania, respectively are = 0:054%, = 0:095% and = 0:391%, which are lower compared to the closed economy model (Table 8), but of the same ranking. And only Lithuania experiences a gain from the 2000-2007 tax reform while Latvia and Estonia experience losses.
Transitional dynamics for the open economy model are similar and given in Figures (6)-(8) of Appendix A.3. Note that these …gures indicate that div-idends are negative in period 0, which can be viewed as unrealistic. However, avoiding this result by allowing for new equity issue gives the same solution for the …rm problem given that d = g; which is true in all but one case of
2000 and 2007 tax law for the Baltic countries (Table 1).To see this, consider that the …rm …nances its investment through retained earnings and distrib-utes the rest in dividends. Since the period 0 investment demand exceeds the retained earnings supply of capital, the resulting dividends are negative. Ex-tending the economy to allow the …rm to issue new equity, negative dividends can be avoided. In this case, equation (16) becomes
(1 c) t+ sIt+ c Kta+qt+1(Et+1 Et) = Dt+It:
Combining it with the arbitrage condition (11), leads to the equation of motion for the value of the …rm
Vt+1 =Vt 1 +
rt+ d g rEt
1 g
!
[(1 c) t (1 s)It+ c Kta]: (49)
The maximization of …rm’s value implies the minimization of the cost of capital 1 +rt+(
d g)rE t
1 g with a consequent dividend payout rater E
t =Dt=Vt.
With the same tax rate for dividends and capital gains, the dividend payout rate rE
t does not matter, in that equations (21) and (49), and the equilibria,
are the same.
Table 13 reports the necessary changes in tax rates and resulting welfare gains that correspond to the same experiments as in Table 10. The welfare ranking of taxes is the same as in the closed economy model; the magnitudes of the utility gains are smaller, and are negative for the corporate income tax.
Table 12: Open Economy Steady State Values for Tax System in 2007 Latvia
g r l u z K=H C=Y K=Y V =Y X=Y B=Y
0.020 0.041 0.491 0.209 0.299 0.419 0.614 1.691 1.526 -0.022 1.029 Estonia
g r l u z K=H C=Y K=Y V =Y X=Y B=Y
0.020 0.041 0.489 0.211 0.301 0.747 0.557 2.282 2.282 -0.034 1.597 Lithuania
g r l u z K=H C=Y K=Y V =Y X=Y B=Y
0.020 0.041 0.504 0.204 0.292 0.416 0.620 1.692 1.599 -0.028 1.323
Table 13: Open Economy Revenue Equivalent Tax Changes
Latvia Estonia Lithuania
Tax Rate % Tax Rate % Tax Rate %
p 0.2183 0.094 0.2137 0.121 0.2789 0.182 sw 0.0516 0.094 -0.0625 0.121 -0.0655 0.182 se 0.2282 0.094 0.2518 0.121 0.2079 0.182 v 0.1521 0.056 0.1382 0.074 0.1323 0.106 c -0.1954 -0.443 -0.1255 -1.899 0.0944 -2.446 d -0.5419 0 -0.1842 0 -0.6585 0 s 0.0958 -1.625 0.1287 -2.371 0.3731 -2.809
7
Discussion
The tax reform results are limited to the set of assumed taxes. For example, Stokey and Rebelo (1995) allow human capital production to be taxed, which allows for a higher impact of tax rates on growth. And extending the Section 2 model to allow for both equity and debt …nance allows for the dividend tax to be distortionary as in Kim (1998), where labor taxes also directly e¤ect the real interest rate. But also important, in …nding the e¤ect of reforms, is what is the initial set of tax rates.
For example, in contrast to Section 5’s results, Devereux and Love (1994) …nd that the consumption tax dominates the personal income tax, which in turn dominates the corporate income tax, with this ranking holding for both growth rates and utility. Yet what emerges is that not that the models are inherently at odds. Rather such a di¤erence can occur because of di¤erent initial distributions of the tax rates. In support of how the ranking of reforms depends on the initial tax system, Table 14 replicates the Devereux and Love (1994) ranking under one set of initial tax rates but replicates the ranking of Sections 5 and 6 under a di¤erent initial set of tax rates.
Using a hypothetical initial set of tax rates (rather than the baseline calibration), Table 14 sets the government consumption of taxes to zero, so that = 0, and all tax revenues raised are returned lump sum to the consumer. While in the baseline calibration is calibrated according to the data, here it is chosen to be = 0 , which would be the value that was optimally chosen if this were endogenous since it is assumed that government expenditure has no bene…ts. First, initial taxes are also all set to zero, in the …rst experiment, so that with = 0 the economy is at its (…rst-best) optimum; second, initial taxes on personal income and consumption goods are set at 0:25;so that in this case the economy is not at its optimum, with components of the composite labor tax being over-taxed.
The rest of parameters are set as in baseline calibration for Latvia. The left-hand side of Table 14 shows the growth and utility changes from start-ing from 0 initial tax rates and then raising a set amount of tax revenue (P V T = 0:25)from just a single tax increase, for each of four di¤erent taxes. This shows that raising the revenue using the VAT is best, followed closely
by raising the personal income tax rate, while raising the revenue with the corporate tax leads to a much bigger loss of utility; this is the same rank-ing as in Devereux and Love (1994). But now consider the right-hand side columns of the Table 14. With the initial tax rates for both personal income and the VAT now assumed to be equal to25%, instead of0, and all other tax rates equal zero, the initial tax revenue isP V T = 4:79:The same experiment is run of increasing tax revenue by the same amount of P V T = 0:25; from
P V T = 4:79toP V T = 5:04;with just one tax. With composite labor taxes over-taxed through already high taxes on personal income and consumption, this results in a re-ordering of the utility ranking to that of Sections 5 and 6: raising the additional revenue through the corporate tax rate is now much better for utility than raising the revenue with the personal income tax, while the VAT is marginally worse than the corporate income tax.
Table 14: Raising Revenue from Di¤erent Intial Tax Distributions Tax Revenue: 0 !0:25 Tax Revenue: 4:79 !5:04
Tax Rate g % Tax Rate g %
Initial New Initial New
p 0 0.0271 0.0280 -0.0338 0.25 0.2755 0.0193 -1.7305 v 0 0.0258 0.0281 -0.0289 0.25 0.2748 0.0196 -0.9746 c 0 0.0856 0.0281 -0.1676 0 0.0742 0.0196 -0.9737 d 0 0.5124 0.0285 0 0 0.5618 0.0199 0
8
Conclusions
The model includes an explicit corporate sector within a Lucas (1988) human capital economy, with transition dynamics as in Lucas (1990), and with a second-best optimum of ‡at taxes on corporate and labor income resulting when government spending is constrained to be a fraction of output. Moving to the ‡at tax optimum from the 2000 tax rate law, welfare improvements were 11 to 16% of consumption. The utility gain from the actual tax reforms from 2000 to 2007, within the closed economy, was 1.5 to 2.6% with Lithuania having the highest gain. The same ranking of gains from actual law changes
was also found under open economy assumptions, although only Lithuania showed a positive gain.
Experiments kept the same revenue loss as was found in the actual 2000-2007 reforms, while lowering only one tax rate to yield that revenue loss. This showed that the personal income tax and the social security tax de-crease always gave the biggest utility gain, under both closed and open econ-omy assumptions. Another experiment within the closed econecon-omy, of again achieving the same revenue as in 2007 law, showed that establishing equal ‡at tax rate on personal and corporate income with zero tax rates on all other taxes, gave larger utility gains for all three countries than did the ac-tual 2000-2007 reforms. And this equal ‡at tax policy gave larger utility gains than using any single tax decrease for both Latvia and Lithuania, and gains for Estonia that were almost as high as those achieved by decreasing only the personal income tax rate.
Given the initial set of tax rates in the Baltics and the assumption that government spending is a constant fraction of output, altogether the results suggest that an imbalance of taxes that fall on labor relative to taxes that fall on capital causes welfare to be lower than it needs to be. The social security taxes would di¤er in e¤ect from the personal income tax if bene…ts of pension were modeled, which would be a useful albeit di¢ cult extension. Similarly the general public bene…ts of government expenditure are not modelled here although for example public capital is an important source of infrastructure and growth in many economies. For example, if such expenditures a¤ect the return on physical capital di¤erently from the return on human capital, then these expenditures would be expected to a¤ect how the balance of the tax system, between labor and capital taxes, determines welfare.
Technically, the paper uses Judd’s (1992) non-linear simulation method to simulate dynamics. Its simpler human capital investment function from Lucas (1988) allows for more tractable analytic results as compared to Dev-ereux and Love (1994). And the paper contains more tax experiments than is typical in order to bring out the sensitivity of the results.6
Inclusion of the in‡ation tax would further increase the labor type taxes since the in‡ation tax is similar in e¤ect to a labor tax when modeled with
a goods-leisure margin. Thus with a positive in‡ation rate, the results for the Baltics would be predicted to show that the capital taxes should be even more relied upon than is found in the paper. Similarly, modelling the evasion of taxes would go in the direction of making balanced labor and capital taxes desirable although this depends upon how evasion is modeled. Evasion often acts as an arbitraging device whereby the higher taxed income is made arti…cially into the lower taxed type of income. In countries with relatively low corporate tax rates, the personal income can be turned into corporate income by having employees of companies made into consultants that operate their own business, even though they continue to do the same job in all but name.
These extensions would appear to strengthen the intuition that large im-balances between the e¤ective, or "composite", capital and labor tax rates may not create the best tax system. This leaves the analysis with government expenditure as a constant fraction of output as one answer for why adoption of zero capital tax rates, as in the Ramsey solution with exogenous govern-ment spending, may not be widespread in practice. And it demonstrates that the Baltic countries, and other similarly con…gured countries, might be better o¤ with more balanced e¤ective labor versus capital tax rates.
References
Atkinson, A. and Stiglitz, J. (1980). Lectures on public economics, McGraw-Hill, London.
Barro, R. (1990). Government spending in a simple model of endogenous growth, Journal of Political Economy 98: S103 –S125.
Devereux, M. and Love, D. (1994). The e¤ects of factor income taxation in a two-sector model of endogenous growth, Canadian Journal of Eco-nomics 27: 509 –536.
Funke, M. and Strulik, H. (2006). Taxation, growth and welfare: Dynamic e¤ects of Estonia’s 2000 Income Tax Act, Finnish Economic Papers 19(1): 25 –38.
IMF (1998). Republic of estonia: Selected issues and statistical appendix,
Sta¤ Country Report 98/12, IMF.
IMF (1999a). Republic of latvia: Selected issues and statistical appendix,
Sta¤ Country Report 99/99, IMF.
IMF (1999b). Republic of lithuania: Selected issues and statistical appendix,
Sta¤ Country Report 99/96, IMF.
IMF (2000a). Republic of estonia: Statistical appendix,Sta¤ Country Report 00/102, IMF.
IMF (2000b). Republic of latvia: Selected issues and statistical appendix,
Sta¤ Country Report 00/100, IMF.
IMF (2001). Republic of lithuania: Statistical appendix and tax summary,
Sta¤ Country Report 01/40, IMF.
Jones, L. E., Manuelli, R. E. and Siu, H. E. (2005). Fluctuations in convex models of endogenous growth II: Business cycle properties, Review of Economic Dynamics 8(4): 805–828.
Judd, K. L. (1992). Projection methods for solving aggregate growth models,
Journal of Economic Theory 58(2): 410–452.
Kim, S. (1998). Growth e¤ect of taxes in an endogenous growth model: to what extent do taxes a¤ect economic growth?, Journal of Economic Dynamics and Control 23: 125 –158.
Ljungqvist, L. and Sargent, T. (2000). Recursive Macroeconomic Theory, The MIT Press, Cambridge, Mass.
Lucas, Jr., R. E. (1990). Supply-side economics: An analytical review,Oxford Economic Papers (42): 293–316.
Lucas, R.E., J. (1988). On the mechanics of economic development, Journal of Monetary Economics 22: 3 –42.
McGrattan, E. and Prescott, E. (2005). Taxes, regulations, and the value of US and UK corporations, Review of Economic Studies72: 767 –796. McGrattan, E. R. and Prescott, E. C. (2000). Is the stock market
overval-ued?,Federal Reserve Bank of Minneapolis Quarterly Review24(4): 20– 40.
Mendoza, E., Razin, A. and Tesar, L. (1994). E¤ective tax rates in macro-economics: Cross-country estimates of tax rates on factor incomes and consumption, WP 4864, NBER.
Mitchell, D. J. (2007). The global ‡at tax revolution, Cato policy report, Cato Institute, Washington DC.
Obstfeld, M. and Rogo¤, K. (1996). Foundations of International Macroeco-nomics, MIT Press, Cambridge, MA.
Stokey, N. and Rebelo, S. (1995). Growth e¤ects of ‡at-rate taxes, Journal of Political Economy 103(3): 519 –550.
Turnovsky, S. J. (1995). Methods of Macroeconomic Dynamics, The MIT Press, Cambridge.
Turnovsky, S. J. (2000). Fiscal policy, elastic labor supply, and endogenous growth, Journal of Monetary Economics 45(1): 185–210.
A
Appendix.
A.1
Statutory Tax Rate Structure Description
The major taxes included in the model are value added tax, and personal and corporate income direct taxes. Capital gains and dividend taxes are part of the income tax law as statutory rates. In the growth literature that deals with the e¤ect of distortionary taxation on growth, the calibrated tax rates typically are not those speci…ed by tax laws, but rather they are estimated. For example, Mendoza, Razin and Tesar (1994) calculates the e¤ective tax rate as the ratio of tax revenues of the consolidated government to the tax
base as calculated from national accounts; this is a type of average tax rate that the representative agent faces. The use of statutory taxes here is justi…ed by fact that the tax rates in the Baltic countries are ‡at rate taxes that do not depend on the income level or the status of the enterprise. In addition, the tax bases of all taxes were widened over time so as to eliminate most of the exemptions. Deductions that allow for a decrease in taxable income are mainly of a lump-sum nature.
The Baltic countries have opted for a reduction in the income taxes and, especially, in corporate income taxes. The corporate income tax fell to 15% both in Latvia and Lithuania, while in Estonia tax rates on all sources of income was lowered to 22%. Additionally, tax on dividends was reduced to 15% and personal income tax to 27% in Lithuania. Other changes include the elimination of the investment subsidy in Lithuania with taxable income now being decreased by the value of the capital depreciation, with depreciation rates varying from 5% to 33%. In the calibration of the model the deprecia-tion rate is set at 20%. Social security contribudeprecia-tions paid by the employee is 3% and by the employer 27%, additionally the employer pays 3% for health insurance and 1% for accidents; it is similar in Latvia.
In Latvia, in the case of personal income tax, taxable income is decreased by a nontaxable minimum, by deductions for each dependent person and by expenditures for health care and education up to a certain amount. These deductions do not a¤ect the marginal tax rates that matter for optimality conditions. Their only consequence is to decrease the total tax revenues raised by the government. Use of an average tax rate on the basis of total taxes may therefore be misleading in terms of the e¤ect on the economic margins and on growth. The marginal tax rates appear to be more closely modeled in the Baltic countries by the statutory rates.
In all Baltic states the base rate for the VAT is 18%. Although excise tax can be thought of as part of consumption tax, the rate of consumption tax in the model is set equal to the VAT rate. We justify not accounting for excise taxes by arguing that often there are other reasons to levy an excise tax, for example because goods subject to excise taxes exert externalities that are not captured by the model. And because educational services are excluded from the VAT, this provides additional justi…cation for treating human capital