VisTrails: Enabling Interactive Multiple-View Visualizations
Louis Bavoil1 Steven P. C allahan 1 Patricia J. C rossno 3 Juliana Freire 2
C arlos E. S c h e id e g g e r1 Claudio T. S ilv a 1,2 Huy T. V o 1 1 Scientific Computing and Imaging Institute, University of Utah
2 School of Computing, University of Utah
3 S an dia National Laboratories
Figure 1: VisTrails Visualization Spreadsheet. This ensemble shows the surface salinity variation at the mouth of the Columbia River over the period of a day. The green regions represent the fresh-water discharge of the river into the ocean. A single vistrail specification is used to construct this ensemble. Each cell corresponds to an instance of this specification executed using a different timestamp value.
Abstract
VisTrails is a new system that enables interactive multiple-view vi sualizations by simplifying the creation and maintenance of visu alization pipelines, and by optimizing their execution. It provides a general infrastructure that can be combined with existing visu alization systems and libraries. A key component of VisTrails is the visualization trail (vistrail), a formal specification of a pipeline. Unlike existing dataflow-based systems, in VisTrails there is a clear separation between the specification of a pipeline and its execution instances. This separation enables powerful scripting capabilities and provides a scalable mechanism for generating a large number of visualizations. VisTrails also leverages the vistrail specification to identify and avoid redundant operations. This optimization is espe cially useful while exploring multiple visualizations. When varia tions of the same pipeline need to be executed, substantial speedups can be obtained by caching the results of overlapping subsequences of the pipelines. In this paper, we describe the design and imple mentation of VisTrails, and show its effectiveness in different ap plication scenarios.
CR Categories: H.5.2 [User Interfaces]: Graphical user inter faces (GUI); I.3.4 [Graphics Utilities]; I.3.8 [Applications]; H.2.8 [Database Applications]: Scientific databases
Keywords: interrogative visualization, dataflow, caching, coordi nated views
IEEE Visualization 2005
O ctober 23-28, Minneapolis, MN, USA 0-7803-9462-3/05/$20.00 © 2005 IEEE.
1 In tro d uctio n
In recent years, with the explosion in the volume of scientific data, we have observed a paradigm shift in how scientists use visualiza tion. Projects such as CORIE, an environmental observation and forecasting system for the Columbia River, generate and publish on the Web thousands of new images daily which depict river cir culation forecasts and hindcasts, as well as real-time sensor data.1 The growing demand for visualization has led to the development of new and freely available systems [14, 20, 24], which due to increased computational power, wide availability of inexpensive Graphics Processing Units (GPUs), and more efficient visualization algorithms, allow users to generate and interactively explore com plex visualizations. Although these new systems represent a signif icant improvement in raw efficiency compared to first-generation tools [11, 27], they have important limitations. In particular, they lack the infrastructure to properly manage the pipelines, and they do not exploit optimization opportunities during pipeline execution. As a result, the creation, maintenance, and exploration of visualiza tion data products are major bottlenecks in the scientific process, limiting the scientists’ ability to fully exploit their data.
Exploring data through visualization requires scientists to as semble dataflows that apply sequences of operations over a set of data products. Often, insight comes from comparing the results of a variety of visualizations [23]. For example, Figure 1 shows a set of CORIE images used to study the salinity variation at the mouth of the Columbia river. Unfortunately, today the process to create these complex ensembles is cumbersome and time-consuming. Although individual dataflows can be constructed using point-and-click inter faces in systems such as IBM Data Explorer (DX) [11], Advanced Visual Systems AVS [27], SCIRun [20] and ParaView [14], execut ing variations of a given pipeline with different parameters requires users to manually modify the parameters through the user interface.
This mechanism is clearly not scalable for generating more than a few visualizations. Besides, as the parameters are modified, the previous values are forgotten. This places the burden on the scien tist to first construct the visualizations and then to remember what values led to a particular image.
Another source of complexity in this process comes from the visualization operations themselves. These operations are often computationally and memory-intensive. As a result, visualization pipelines may comprise long sequences of expensive steps with large temporary results, limiting a user's ability to interactively explore their data. This problem is compounded in a multi-view scenario. Although current systems use dataflows to represent pipelines, they do not fully exploit key features of the dataflow model. Notably, they may recompute the same results over and over again if so defined in the dataflow.
VisTrails enables interactive multiple-view visualizations by simplifying the creation and maintenance of visualization pipelines, and by optimizing their execution. Our design goals included: • creating an infrastructure that maintains the provenance of a large
number of visualization data products;
• providing a general framework for efficiently executing a large number of potentially complex visualization pipelines;
• providing a user interface that simplifies multiple-view compara tive visualization.
Instead of creating yet another visualization system, our goal was to build an extensible and flexible infrastructure that can lever age (and be combined with) existing systems (e.g., [11,14,20,27]). Here, we describe our initial prototype that was built on top of Kit- ware's Visualization Toolkit (VTK) [24].
In our system, the visualization trail (or vistrail) is a formal specification of a pipeline. It provides not only a record of the provenance for the generated image (or images), but it can also be automatically executed. Unlike existing dataflow-based systems, in VisTrails there is a clear separation between the specification of a pipeline and its execution instances. This separation enables powerful scripting capabilities and provides a scalable mechanism for generating a large number of visualizations - the specification serves as a template and users can execute it using different pa rameters. For example, Figure 1 illustrates a multi-view visualiza tion built using a single vistrail specification executed over distinct timestamp values. VisTrails also leverages the vistrail specifica tion to identify and avoid redundant operations. This optimiza tion is especially useful for multiple-view visualizations, where vistrails may contain overlapping subsequences (e.g., when vari ations of the same trail are executed). By reusing results computed for overlapping subsequences of different pipelines, VisTrails pro vides improved interactivity. We represent the vistrails specifica tions using XML. As we discuss in Section 3.1, this has many ben efits. In particular, it allows users to query the specifications and their instances; and it greatly simplifies the sharing of visualization pipelines.
In Section 2 we review the related work. In Section 3, we de scribe the design and implementation of VisTrails. In Section 4, we illustrate the benefits and improved performance achieved by VisTrails in three different application scenarios. We close in Sec tion 5, where we outline directions for future work.
2 Related Work
Several systems are available for creating and executing visualiza tion pipelines [11, 14, 20, 24, 27]. Most of these systems use a dataflow model, where a visualization is produced by assembling visualization pipelines out of basic modules. They typically pro vide easy-to-use interfaces to create the pipelines. However, as discussed above, these systems lack the infrastructure to properly
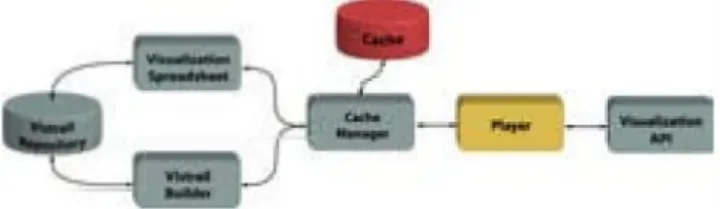
Figure 2: VisTrails Architecture. Users create and edit visualization pipelines using the Vistrail Builder user interface. The vistrail specifications are saved in the Vistrail Repository. Users may also interact with saved vistrails by im porting them into the Visualization Spreadsheet. Each cell in the spreadsheet represents a view that corresponds to a vistrail instance; users can modify the parameters of a vistrail as well as synchronize parameters across different cells. Vistrail executions are controlled by the Vistrail Cache Manager, which keeps track of operations that are invoked and their respective parameters. Only new combinations of operations and parameters are requested from the
Vistrail Player, which executes the operations.
manage a large number of pipelines; and often apply naive execu tion models that do not exploit optimization opportunities.
A formal model for capturing the visualization exploration pro cess was proposed by Jankun-Kelly et al. [13]. The vistrail model shares many of the features and benefits of this model, including: the ability to record visualization sessions at a higher-level than simple logs; the use of an XML dialect to represent a pipeline, which enables easy sharing of results and process information; and the maintenance of visualization provenance. However, there are important differences between our approaches. Whereas the focus of Jankun-Kelly et al. was to design a model for the visualiza tion process, the model is just one component of VisTrails (albeit a very important one). We instead focus on how to effectively use the model to both optimize pipeline execution and to simplify the creation of large visualization ensembles. Currently, in VisTrails, session history can be reconstructed from information stored in a set of vistrail instances.
In the recent literature, several works have addressed different aspects of the management of visualization processes, from main taining detailed provenance of data exploration processes [15] to grid-enabling visualization systems [3]. These works are comple mentary and the ideas can be integrated into VisTrails. Kreuseler
et al. [15] proposed a history mechanism for exploratory data min ing, but their ideas are also applicable to exploratory visualization. They use a tree structure to represent the change history, and de scribe how undo and redo operations can be calculated in this tree structure. This mechanism provides a detailed provenance of the exploratory process. We intend to add a more expressive history mechanism to VisTrails in future work. Since we store vistrail spec ifications in an XML format, an XML-specific versioning scheme such as the time-stamp-based approach proposed by Buneman et al [4] is an attractive alternative.
Brodlie et al. [3] describe sgViz, a system that extends IRIS Ex plorer.2 Their system allows the distributed execution of a visual ization pipeline over a set of Grid resources. An important contri bution is a layered architecture that allows different “bindings” for a given pipeline specification in each layer. With this architecture, different visualization systems can be easily integrated (in the log ical layer) and different execution strategies can be implemented which bind individual operations to places in the grid (in the phys ical layer). Similar to sgViz, VisTrails can be used as a middle ware over different visualization systems and it also uses an XML dialect to represent visualization pipelines. SgViz’s dialect differs from ours in one significant aspect: the vistrail model clearly sep arates the visualization modules from the flow of operations (the topology of the dataflow network). By separating the connections from the modules we can more easily support different execution models, as well as new control constructs. In the current system,
type V istra il =
v is tr a il [ @id[ String ], name [ String ], Module*, Connect*, annotation [ String ]?] type Module =
module [ @id[ String ], name [ String ], function [ @name, @returnType, param*]+, cacheable [ boolean ]? ]
type Connect =
connect [ @id[ String ], (FilterInput|ObjectInput)*] type F ilterInput =
filte rIn p u t [ @id[ String ], name [ String ], function [ String ],
iport [ Integer ], oport [ Integer ]] type ObjectInput =
objectInput [ @id[ String ], name [ String ]]
Figure 3: Excerpt of the XML schema for vistrails. This schema captures all information required to re-executea vistrail. The connect elements represent data dependencies among modules, which are key to automatic caching. The use of XML allows the reuse of standard XML technology, including validating parsers and query languages. It also simplifies the sharing of visualization pipelines.
our goal was to optimize the sequential execution of a pipeline (or set of pipelines) by avoiding unnecessary recomputations. Parallel execution and distribution of vistrail operations on the Grid are is sues we intend to pursue in future work. It is worthy of note that our representation of the trails as a tabled logic program (see Sec tion 3.2) lends itself naturally to automatic parallelization [9].
VisTrails provides an infrastructure that enables the effective use of several visualization techniques which aid users to explore and understand the underlying information. In particular, it supports the three primary techniques described by Roberts [22]: Multiform vi sualization, the ability to display the same information in different ways, can be achieved by appropriately setting parameters or modi fying a trail (e.g., the top row of Figure 8 shows the Visible-Human dataset rendered using isosurfaces whereas the bottom row uses vol ume rendering); abstract views, which apply the same visualization algorithm using different simplification criteria, can be constructed by refining and modifying a trail specification; and direct manipu lation, which allows objects to be directly interrogated, scaled and positioned, can be achieved both through the Vistrail Builder and through the Vistrail Spreadsheet, and in the latter, different views can be coordinated (see Section 3.4).
The use of spreadsheets for displaying multiple images was pro posed in previous works. Levoy’s Spreadsheet for Images (SI) [16] is an alternative to the flow-chart-style layout employed by many earlier systems using the dataflow model. SI devotes its screen real estate to viewing data by using a tabular layout and hiding the specification of operations in interactively programmable cell formulas. The 2D nature of the spreadsheet encourages the appli cation of multiple operations to multiple data sets through row or column-based operations. Chi [5] applies the spreadsheet paradigm to information visualization in his Spreadsheet for Information Vi sualization (SIV). Linking between cells is done at multiple levels, ranging from object interactions at the geometric level to arithmetic operations at the pixel level. The difficulty with both SI and SIV is that they fail to capture the history of the exploration process, since the spreadsheet only represents the latest state in the system.
The Vistrail Spreadsheet supports concurrent exploration of mul tiple visualizations. The interface is similar to the one proposed by Jankun-Kelly and Ma [12] and it provides a natural way to explore a multi-dimensional parameter space. The separation between pa rameters and the actual network makes the vistrail model especially suitable to be used in such an interface. Users can change any of the parameters present in a vistrail and create new vistrail instances; and they can also synchronize different views over a set of vistrail parameters - changes to this parameter set are reflected in related vistrails shown in different cells of the spreadsheet. In addition, other corresponding visualization mechanisms are possible using the spreadsheet, such as reflection or nested views.
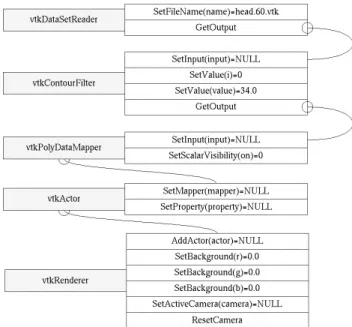
Figure 4: A sample vistrail. This snapshot of the Vistrail Builder consists of a sequence of VTK steps that read a file, compute an isosurface and render the resulting image. Users create vistrails using the point-and-click interface of the Vistrail Builder — they can add modules, and connect the different modules and ports.
The management of scientific data and processes has attracted a lot of attention in the recent literature (see e.g., [17,25]). Although our effort was motivated by visualization, the VisTrails framework is extensible and can also be used for general scientific workflows.
3 System Ar c h it e c t u r eand Im plem entation The high-level architecture of VisTrails is shown in Figure 2. The different components of the system are described in detail below.
3.1 Vistrail Data Model
A vistrail specification consists of a sequence of operations used to generate a visualization. It records the visualization provenance and it can also be used to automatically re-generate the images. A vistrail is stored as an XML document. Figure 3 shows an ex cerpt of the XML schema [26] for a vistrail.3 A v is tr a il element contains of a set of modules, connections between these modules, and an optional annotation element. Each module may contain one or more functions. A function has a returnType and a set of pa rameters consisting of attribute-value pairs. The optional boolean attribute cacheable indicates whether the module is eligible for caching (see Section 3.2). An actual vistrail instance is depicted in Figure 4. Each node in the graph corresponds to a module ele ment in the schema; and an edge between two nodes corresponds to a connect element. The connections capture the data dependencies among the different modules. The data generated by a module is output through its oport and can be connected to the iport of a dif ferent module. As we discuss below, these dependencies are used by the Cache Manager to avoid redundant computations, as well as to ensure that, when changes are made to a vistrail, only the steps affected by the change are re-executed.
The XML representation for vistrails allows the reuse of standard XML tools and technologies. In particular, we use Xerces [29] to
3For simplicity, here we use the type syntax of the XML Query Algebra which is less verbose and more readable than XML Schema.
EXEC-VISTRAIL (vistrail) 1 ms ^ SINKS (vistrail) 2 fo r m e ms: 3 d o EXEC-SUBNETW0RK-UP-T0(m) EXEC-SUBNETW0RK-UP-T0(m) 1 sn ^ SUBNETW0RK-UP-T0(m) 2 id ^ UNIQUE-lD(sn) 3 entry ^ L00KUP-CACHE (id) 4 if entry = NULL 5 th e n entries ^ 6 ms ^ CACHEABLE-M0DULES-LEADING-T0(m) 7 f o r m e ms 8 d o ne ^ EXEC-SUBNETW0RK-Up-T0(m) 9 ADD-T0-LlST(entries, ne) 10 nn ^ TRANSF0RM-NETW0RK (sn, ms, entries) 11 entry ^ PLAYER(nn) 12 ADD-T0-CACHE(id, result) 13 r e t u r n entry
Figure 5: Pseudocode for the vistrail execution algorithm with cache manage ment. When a module is to be executed, the VCM first checks its cache. If an entry is found for the module (with requested parameters), the cached result is returned. Otherwise, VCM invokes the Vistrail Player (line 11) which executes the appropriate API call and returns the results to the VCM.
parse and validate the vistrail specification; and XML query lan guages (e.g., XPath [30] and XQuery [2]) to query vistrail specifi cations and instances. Using an XML query language, a user can query a set of saved vistrails to locate a suitable one for the current task; query saved vistrail instances to locate anomalies documented in annotations of previously generated visualizations; locate data products and visualizations based on the operations applied in a pipeline; cluster vistrails based on different criteria; etc. For exam ple, the XQuery query below lists all vistrails (together with their names, annotations and functions) that use an isosurface computa tion and that have been found to contain anomalies:
for $vt in document(“vt-repository.xml”)/vistrail,
$module in $vt/module/[contains(./name,”vtkContourFilter”)] where $vt[contains(./annotation,“anomal”)]
return <anom aly> {$vt/name} {$vt/annotation} { $module/function } </anom aly>
Another important benefit of using an open, self-describing, specification is the ability to share (and publish) vistrails. For exam ple, an image can be published together with its associated vistrail, allowing others to easily reproduce the results.
The module element in the vistrail schema is general and captures a wide range of applications, from simple scripts to VTK modules and Web services [28]. Note that for applications that do not fit this structure, it is easy to add new kinds of module elements - as long as they fit the dataflow model and appropriate functions are pro vided to execute these modules (see Section 3.3). This makes our VisTrails extensible, and in particular, also suitable for executing general scientific workflows [17].
3.2 The Vistrail Cache Manager
The Vistrail Cache Manager (VCM) schedules the execution of modules in vistrails. As vistrail steps are executed, the VCM stores their results, i.e., a signature for the module (which includes its name and parameter values) together with a handle to the output re sults. When the VCM identifies previously computed subnetworks in a vistrail, it locally transforms a possibly expensive computation into a constant-time cache lookup. To maximize the utility of the cache, the cached results are shared among vistrails. This allows
UNIQUE-ID (subnetwork)
1 if IS-AT0MIC (subnetwork)
2 th e n r e t u r n UNIQUE-ID-FR0M-AT0M(subnetwork) 3 else module-ids^ {}
4 fo r modulee M0DULES (subnetwork)
5 d o id ^ UNIQUE-ID-FR0M-AT0M(module)
6 ADD-T0-LlST(module-ids, id)
7 S0RT (module-ids)
8 conn-ids ^ {}
9 fo r conne C0NNECTI0NS(subnetwork) 10 d o omodule ^ 0UTPUT-P0RT-ID(conn)
11 ufrom ^ lNDEX-0F-lD(module-ids,omodule)
12 imodule ^ INPUT-P0RT-ID(conn) 13 uto ^ lNDEX-0F-lD(module-ids,omodule)
14 id ^ UNIQUE-lD-FR0M-C0NN(ufrom, uto)
15 ADD-T0-LlST(conn-ids, id)
16 S0RT(conn-ids) 17 r e t u r n (module-ids, conn-ids)
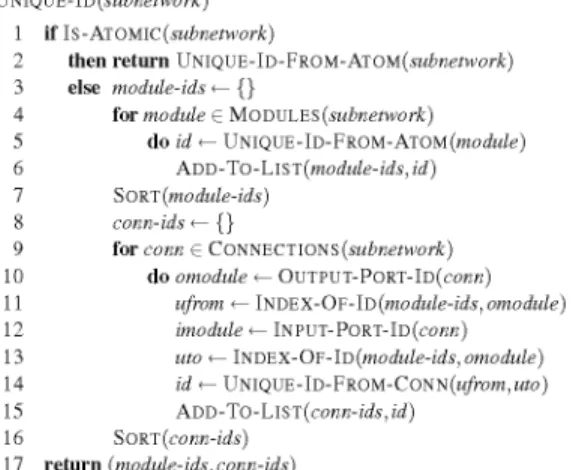
Figure 6: Generation of unique keys for subnetworks. The two sorts (lines 7 and 16) make sure that reordering in the module and connection specifica tions do not affect the unique ID. The procedures Unique-Id-Fr0m-At0m and UNIQUE-IF-FR0M-C0NN only use information that is necessary to distinguish between dataflows to create the IDs. Lines 10-14 make sure that the connec tions IDs are computed from the unique module IDs, and not from the specific IDs given in the vistrail. This guarantees that all networks with the same mod ules and connectivity get the same ID.
the transparent elimination of redundant computation in overlap ping sequences of different vistrails. Figure 7 illustrates the actions of the cache manager for two vistrails.
The VCM takes as input a vistrail instance (an XML file). To en sure that only new sub-sequences are executed, the cache manager analyzes the vistrail specification to identify data dependencies be tween cacheable modules - the dependency information is captured by the connect element in the specification (see Figure 3). Note that we distinguish between cacheable and non-cacheable modules. For some applications, it may not make sense to cache results from all of the modules. When new modules are added to VisTrails, an addi tional flag may be passed to indicate caching eligibility. For exam ple, for VTK classes such as vtkProperty, which have no output, the entire object is passed to another class.
The dependency computation is done concurrently with the vis- trail execution. The pseudocode for the execution procedure is given in Figure 5. When a vistrail is invoked (e.g., it is loaded in a cell of the Visualization Spreadsheet), a depth-first search (DFS) is started from the sinks of the vistrail graph, traversing the graph up stream (in the opposite direction of the connections). Each step of the DFS collects a subnetwork that is bounded by cacheable mod ules. The algorithm then calls itself on these modules to ensure their results are in the cache. If values are already present in the cache, their results are immediately returned. When the recursive calls return, the entries list will contain a set of objects from the cache. The function TRANSF0RM-NETW0RK replaces the entire subnetwork that ends at a cacheable module with a special module that looks up the result in the cache. This result will always be in the cache, since TRANSF0RM-NETW0RK is always called after the appropriate E x e c -S u b n e tw0RK-Up-T0 calls are issued. This al gorithm finds all the needed dependencies and only computes the needed modules. (This can be proven by structural induction on the topological sort of the network.).
An important issue is how to identify entries in the cache. We associate each entry with a key that encodes all the information necessary to compute the associated cached result. If we store too much information (like node identifiers particular to a certain vis- trail), we will unnecessarily restrict data sharing and substantially reduce the utility of the cache. 0 n the other hand, if we fail to store information that influences the computation result, the cache
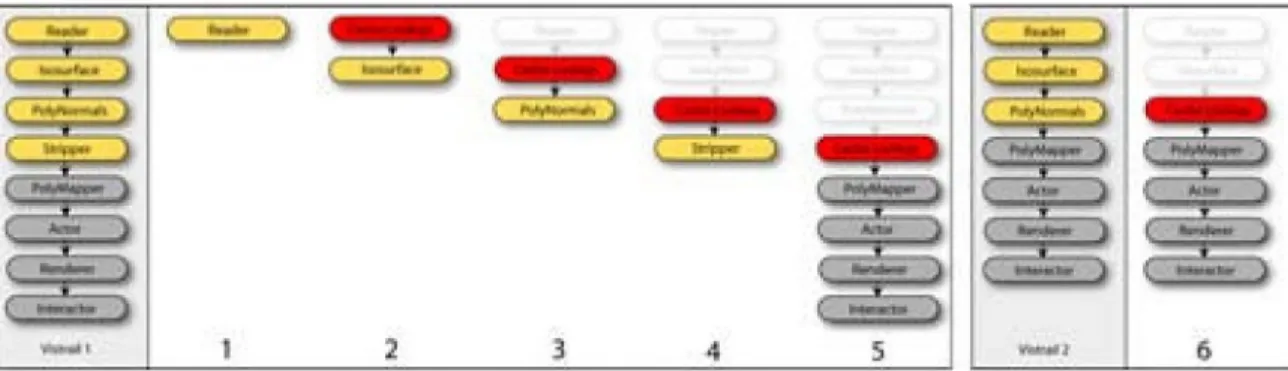
Figure 7: In order to execute Vistrail 1, the cache manager first determines the data dependencies among its modules. It then computes a series of subnetworks that generate the intermediate results for this pipeline (steps 1-5). Each intermediate result is associated with a unique identifier in the cache. Gray nodes represent non-cacheable modules; yellow nodes indicate cacheable modules; and red nodes indicate vistrail modules that are replaced with cache lookups. Ghosted modules are not present in the subnetworks, but they contribute to the construction of subnetwork cache keys. When Vistrail 2 is scheduled for execution (step 6), the results for the Reader-Isosurface subnetwork previously computed for Vistrail 1 (in step 4) are reused. Thus, Vistrail 2 requires no expensive computations.
lookup may return incorrect results. We use a hashing scheme that strips unnecessary information from objects and generates unique keys for subnetworks. The pseudocode for the key generation algo rithm is shown in Figure 6. Note that this scheme also ensures that when changes are applied to a vistrail, only steps that are affected by the changes are re-executed.
The unique ID is structural in a very specific sense: all sub networks sharing the same modules, parameters and connectivity will have the same ID. It encodes all the structural information re quired to identify redundant operations. Note that there may be structurally different subnetworks that produce the same result. We do not attempt to identify these for two reasons. First, this requires knowledge of the internals of the modules. Second, and most im portantly, if we assume that the modules are sufficiently general, the problem becomes undecidable [7]. In fact, treating modules as black boxes is essential to the extensibility of VisTrails. The only requirement is that each module must be stateless: its be havior must be fully captured by its name, input parameters, and description of the upstream modules. (This is precisely what the Unique-Id algorithm captures). We believe such an assumption is reasonable: mutable state inside modules destroys any guarantees of reproducibility, which are essential for scientific tasks.
The dataflow-oriented execution model of a vistrail can be nat urally represented as a Datalog program [19]. In our prototype, vistrails are translated into equivalent Datalog programs which are evaluated by the XSB Prolog/deductive database system [21]. The algorithms described in Figures 5 and 6 were implemented in Pro log; and we use XSB’s foreign language interface to invoke the Vistrail Player.
3.3 Vistrail Player
The Vistrail Player (VP) receives as input an XML file for a vis- trail instance and executes it using the underlying visualization API. Currently, the VP supports VTK classes. It is a very simple inter preter. First, it directly translates the vistrail modules into VTK classes and sets their connections. Then, it sets the correct parame ters for the modules according to the parameter values in the vistrail instance. Finally, the resulting network is executed by calling up date methods on the sink nodes. The semantics of each particular execution are defined by the underlying API.
The VP is unaware of caching. To accommodate caching in the player, we added anew vtkDataobjectPipe class to VTK that pipes data from the cache to the rest of the network. The VCM is re sponsible for replacing a complex subnetwork that has been pre viously executed with an appropriate vtkDataobjectPipe (the red Cache Lookup modules in Figure 7). After a vistrail instance is ex ecuted, its outputs are stored in new cache entries.
The VP needs the ability to create and execute arbitrary VTK
modules from a vistrail. This requires mapping VTK descriptions, such as class and method names, to the appropriate module ele ments in the vistrail schema. Instead of manually constructing a complex mapping table, we use the VTK automatic wrapping mechanism. An automated program generates all required bind ings directly from the VTK headers. This allows our system to expose the functionality of any VTK-compliant class without any additional coding, including user-contributed classes. The special vtkDataObjectPipe class itself was introduced in this fashion. 3.4 Creating and Interacting with Vistrails
The Vistrail Builder (VB) provides a graphical user interface for creating and editing vistrails. It writes (and also reads) vistrails in the same XML format as the rest of the system. It shares the famil iar modules-and-connections paradigm with dataflow systems. In order to generate the visual representation of the modules, it reads the same data structure generated by the VP VTK wrapping process (Section 3.3). Like the VP, the VB requires no change to support additional modules.
The VB is implemented in lefty , as an extension to dotty, a graph editor that is part of the graphviz software package [8]. We made several modifications to both le fty and dotty, such as adding the ability to read and write XML. Figure 4 shows a vistrail built using the VB.
To allow users to compare the results of multiple vistrails, we built a Visualization Spreadsheet (VS). The VS provides the user a set of separate visualization windows arranged in a tabular view. This layout makes efficient use of screen space, and the row/column groupings can conceptually help the user explore the visualization parameter space. The cells may execute different vistrails and they may also use different parameters for the same vistrail specification (see Figure 8). To ensure efficient execution, all views share the same cache. Users can also synchronize different views through the vistrails’ parameters. For example, a set of cells in the VS can be set to share the same camera, while varying the other vistrail parameters. The user interface actions have been kept as simple as possible. For instance, to change a parameter, the user selects the desired views and clicks on “Set Parameters”. Then, they can double-click on a function in the tree view, and set the parameters of the function in the dialog window.
The contents of a spreadsheet can be saved as an XML file that has sections for describing the GUI layout as well as the vistrail in stances in each cell - the instances saved in a spreadsheet conform with the vistrail schema (Section 3.1). The spreadsheet was imple mented using vtkQt.4 Because it uses Qt, the VS runs on multiple architectures. We have tested it on Mac, Linux and Windows.
Figure 8: Vistrail Spreadsheet. Parameters for a vistrail loaded in a spreadsheet cell can be interactively modified by clicking on the cell. Cameras as well as other vistrail parameters for different cells can be synchronized. This spreadsheet shows different visualizations of the Visible-Human dataset using different algorithms. The top row shows the rendering of two iso values, whereas in the second row, images are created using volume rendering. The cameras for the cells in the rightmost column in the spreadsheet above are synchronized.
4 Case Stu d ies
VisTrails is useful for a variety of visualization applications. It can be used as the means to explore the parameters in a visualization, repeat visualizations across different data, and to compare different visualization techniques. We have selected a few case studies which show different applications of VisTrails and the advantages to using the system over traditional approaches.
same parameters on another salinity data set. This allows the user to easily compare the results of a forecast at multiple time steps with the actual measured data for the same timesteps. Previously, this task would have been accomplished by manually adjusting param eters and saving images for each data set, which would then have been montaged using Microsoft Powerpoint.
4.2 Scalar Visualization 4.1 Time-Varying Visualization
The CORIE project described in Section 1 generates enormous amounts of measurement and simulation data each day. Visualiz ing this data is critical to understand the environmental issues that the project targets. Due to the complexity and size of the data to be visualized, approaches for 3D visualization have not been auto mated like the 2D plots and images available from their Web site. And even for the 2D plots, the automation is done by handcoding scripts - new scripts need to be created any time a new visualization is required. Current workflows for 3D visualizations of salinity in volve loading a data file from the filesystem that includes the time, temperature, and salinity for a number of time steps. This data is used on top of the existing geometry (i.e., the river bathymetry) to find an isosurface of interest, then animated using a subset of the time steps. Today, this task is completely manual and is repeated any time a new data set is visualized. VisTrails provides the neces sary infrastructure to automate this process to a great extent.
We created a reader for the CORIE data and incorporated it as a vistrail module. The Vistrail Builder is used to create a vistrail that reads the CORIE data and applies transparent isosurfaces to the data. This vistrail is then loaded into the Visualization Spreadsheet where the isosurface parameters are easily manipulated until the de sired image is achieved. As the user finds useful visualizations, the results are copied into the next window and the user continues to adjust parameters on one or more windows. In the example shown in Figure 1, multiple time steps are explored in the spreadsheet win dows. Once suitable parameters are found, the user has the option of creating another row of windows in the spreadsheet and using the
Visualizing scalar data that is generated from CT and MR devices has been the subject of much research in the volume visualization community. Two techniques that are common for visualizing this type of data are isosurfacing and direct volume rendering. Many existing tools provide interfaces to easily adjust the contour value needed to create an isosurface or to adjust the transfer function for volume rendering. However, to visualize multiple views of a dataset simultaneously, a user is required to save the images to separate files and view them together using an image processing tool. This prevents the user from directly manipulating the images, since they are static and need to be re-generated if parameters change.
With VisTrails, a user can easily visualize multiple views of the same dataset. By taking advantage of the caching capabilities in VisTrails, in many scenarios the exploration of multiple visualiza tions requires little more computation than visualizing a single im age. Furthermore, the user has the ability to directly compare the results of different parameters or visualization methods. For exam ple, Figure 8 shows multiple views of a head scan using isosurfac- ing and volume rendering. A user could also reuse the results of previous computations simply by querying the VisTrail Repository. An example of this would be a user who is given a new scalar data set to visualize. Instead of using traditional tools to visualize the data from scratch, the scientist has the option to query previous vi sualizations to find vistrails that perform a similar task. After find ing the desired vistrail in the Vistrail Repository, the user can easily visualize the new data using the same pipeline by simply modify ing the data reader in the vistrail. Besides alleviating the amount of repetitious tasks the user has to perform, VisTrails also promotes knowledge sharing.
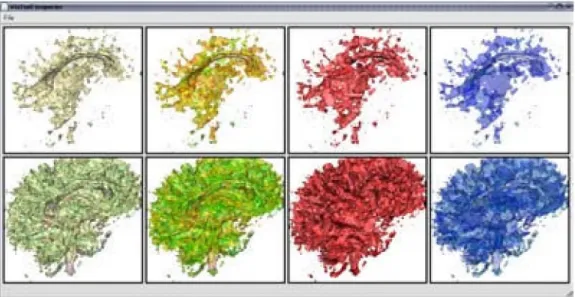
Figure 9: VisTrails Spreadsheet showing the results of multiple visualizations of diffusion tensor data. The horizontal rows explore different colormapping schemes, while the vertical columns use different isosurfaces.
4.3 Diffusion Tensor Visualization
A final example of an application for the VisTrails system is in visu alizing diffusion tensor data. A common task in visualization is to present the user with multiple, sometimes repetitive, visual queues that attempt to quantitatively describe an aspect of the data. 0ne derived quantity of diffusion tensor data is anisotropy, which may help a scientist isolate areas of interest. In our example, we are vi sualizing the right half of a brain and use the anisotropy to encode information about the structure of the brain. Finding useful visual izations that show the data together with the derived quantity can be a difficult task.
Figure 9 shows the results of several visualizations of the brain using isosurfaces that are colormapped with anisotropy. To better visualize this data, we used several univariate colormaps to find one that best describes the data. Thus for a given isosurface, vistrails were modified to include univariate colormaps that vary in hue, sat uration, and value. 0nce a variety of visualizations were created, we replicated these results using another isosurface and compared the results with the original. These operations take advantage of the caching capabilities of VisTrails because the isosurface is com puted only once (for the first vistrail that is executed) and it is reused by all other cells - only the colormaps change across cells. This is done completely automatically even when using multiple differ ent pipelines. Without VisTrails, this task would require opening several windows in a visualization tool and either recomputing the same isosurfaces for each of them or manually creating one pipeline that shares certain components. VisTrails provides the user with a fast and automated technique for comparatively building visualiza tions and saving workflows for future reuse.
4.4 Performance Issues
An important consideration in any interactive visualization system is performance, in particular responsiveness to changes triggered by direct manipulation of images. Since visualization pipelines can be long and complex, achieving interactive speeds is a challenging problem, and becomes even more challenging in a multiple-view system. There are two broad classes of operations in a visualiza tion pipeline: operations that perform data filtering (or prepara tion) and operations that perform real-time rendering. The VCM optimizes the data filtering operations. The performance gains ob tained by caching are heavily dependent on the set of vistrails used in a given session. For instance, for both the brain and visible hu
man case studies, where there is substantial overlap, caching leads to speedups that vary between 2 and 2.5 times. For the C0RIE case study, on the other hand, there is no overlap among the vistrails. In this case, the caching mechanism actually incurs overheads. How ever, the overheads are very small - under 1 percent.
By representing vistrails in XML, we incur a slight overhead for parsing. However, even a large vistrail is insignificant in compari son to the size of the data visualized. Therefore, the performance cost of parsing the XML is negligible in the overall visualization.
Changes to class design and algorithms have the potential to im prove the efficiency of the VCM. In particular, some techniques re quire substantial preprocessing steps to enable faster update times,
e.g., the out-of-core isosurface technique of Chiang et al. [6]. In order to leverage these techniques with the conventional VTK pipeline, it is necessary to explicitly enforce the availability of the required index structures for subsequent operations - and this re quires programming. In contrast, the VCM achieves the same be havior in a transparent (and automatic) fashion.
Increasing the number of synchronized views has direct effect on the rendering frame rate. The reason is obvious: all views share a single GPU and the overall frame rates depend highly on the com bined complexity of the models being shown. In practice, if the frame rate is too slow to interact with a given group of views, we can disable synchronization and interact with a single view until the desired viewpoint and/or values are determined. At that time, we turn synchronization back on. A comprehensive solution to this problem requires the availability of time-critical dynamic level-of- detail rendering algorithms for each of the types of data supported by the system. The development of these renderers is an active area of research [18].
5 Discu ssio n and Future Work
VisTrails streamlines the creation and execution of complicated vi sualization pipelines. It provides infrastructure that gives users a dramatically improved and simplified process to analyze and visu alize large ensembles of complex visualizations. Using a vistrail, users are able to resume their explorations where they left off; to easily apply identical operations to a new data set without having to redo a long sequence of operations; to share their findings with colleagues; to test new codes by comparing visualizations of the re sults generated by different versions of a simulation. The amount of data a user can explore depends on the time it takes until the
analysis results can be viewed. By caching intermediate results and sharing computations, VisTrails greatly reduces the response time, allowing users to efficiently explore large volumes of data.
The separation of the pipeline specification from its instances has several benefits. The correspondence between parameter values and the resulting visualizations is naturally maintained in the system; and by combining this with a mechanism that controls the versions of the pipeline specifications (e.g., [4]), a complete history of the pipelines can be maintained - a detailed (and persistent) record of the provenance of visualizations. This separation also enables pow erful scripting capabilities. By viewing a pipeline specification as a template and allowing users to specify sets of inputs for a given pipeline, VisTrails provides a scalable mechanism for generating a large number of visualizations.
Pipeline specifications can be analyzed and optimized. VisTrails identifies and avoids redundant computation in or across pipelines (Section 3.2). This feature is especially useful for exploring multi ple visualizations in a multi-view environment, where sharing com putations and reusing results are key for achieving interactivity. As we discuss in Section 4, this optimization leads to substantial performance improvements, enabling interactive exploration of a large number of visualizations. As any caching system, VisTrails needs to apply some cache replacement policy. Since entries in the cache have different memory footprints and modules may have widely different execution times, simple techniques such as LRU are clearly suboptimal. We are currently investigating specialized policies that are more suitable for our problem.
Another direction we plan to follow in future work is to Grid- enable vistrails, allowing them to be executed in a distributed fash ion, over different processing nodes in the Grid. This will require more sophisticated evaluation algorithms (akin to adaptive query processing techniques, such as [1]) that are able to adapt to vari ability in network delays and resource unavailability.
A vistrail instance stores information about provenance of de rived images. This information includes the name and location of input (raw) data files. To ensure reproducibility of trail executions, our system can keep copies of the raw data. Although we use a database to store the meta-data (i.e., the trail specification and in stances), the raw data is stored in the file system. One potential problem with this simple approach is that the raw data files can be moved, deleted, or modified. More sophisticated mechanisms can be used to maintain the raw data [10,25]. For example, theRHESSI Experimental Data Center [25] uses a mapping scheme to locate and retrieve data items, and it ensures data consistency by only al lowing raw data to be accessed through the meta-data available in the database.
The beta version of VisTrails (including the GUIs) runs on multi ple platforms. It has been tested on Linux, Mac and Windows. Over the next year, we intend to start a beta testing program in prepara tion for a future public release.
Acknowledgments. VisTrails was originally motivated by the CORIE project. Antonio Baptista has provided us valuable input for the system design as well as several CORIE data sets for our experiments. We thank Gordon Kindlmann for the brain data set and the Visible Human Project for the head. This work was sup ported by the Department of Energy under the VIEWS program and the Mathematics, Information, and Computer Science Office, the National Science Foundation under grants IIS-0513692, CCF- 0401498, EIA-0323604, CNS-0541560, and 0ISE-0405402, and a University of Utah Seed Grant. Sandia National Laboratories is a multi-program laboratory operated by Sandia Corporation, a Lockheed Martin Company, for the United States Department of Energy’s National Nuclear Security Administration under Contract DE-AC04-94AL85000.
[1] R. Avnur and J. M. Hellerstein. Eddies: Continuously adaptive query
processing. In A C M SIG M O D , pages 261-272, 2000.
[2] S. Boag, D. Chamberlin, M. Fernandez, D. Florescu, J. Robie, J. Simeon, and M. Stefanescu. XQuery 1.0: An XML query language. W3C Working Draft, June 2001.
[3] K. Brodlie, D. Duce, J. Gallop, M. Sagar, J. Walton, and J. Wood.
Visualization in grid computing environments. In IE E E Visualization,
pages 155-162, 2004.
[4] P. Buneman, S. Khanna, K. Tajima, and W. C. Tan. Archiving scien
tific data. A C M Transactions on D atabase System s, 29(1):2-42, 2004.
[5] E. H. Chi, P. Barry, J. Riedl, , and J. Konstan. Principles for informa tion visualization spreadsheets. IE E E Com puter G raphics a n d A p p li cations, 18(4):30-38, 1998.
[6] Y.-J. Chiang, C. T. Silva, and W. J. Schroeder. Interactive out-of-core
isosurface extraction. In IE E E Visualization, pages 167-174, 1998.
[7] M. D. Davis, R. Sigal, and E. Weyuker. Computability, Complexity,
and Languages. Academic Press, 1994.
[8] J. Ellson, E. R. Gansner, L. Koutsofios, S. North, and G. Woodhull.
Graphviz - open source graph drawing tools. In Graph Drawing, pages
483-485, 2001.
[9] J. Freire, R. Hu, T. Swift, and D. S. Warren. Exploiting parallelism in
tabled evaluations. In PLILP, pages 115-132, 1995.
[10] J. Frew and R. Bose. Earth system science workbench: A data man
agement infrastructure for earth science products. In SSDBM, pages
180-189, 2001.
[11] IBM. Opendx. http://www.research.ibm.com/dx.
[12] T. Jankun-Kelly and K. Ma. Visualization exploration and encapsula
tion via a spreadsheet-like interface. IE E E Transactions on Visualiza
tion and Com puter Graphics, 7(3):275-287, 2001.
[13] T. Jankun-Kelly, K. Ma, and M. Gertz. A model for the visualization exploration process. In IEE E Visualization, 2002.
[14] Kitware. Paraview. http://www.paraview.org.
[15] M. Kreuseler, T. Nocke, and H. Schumann. A history mechanism for
visual data mining. In IEE E Inform ation Visualization Sym posium ,
pages 49-56, 2004.
[16] M. Levoy. Spreadsheet for images. In SIG G RAPH , pages 139-146,
1994.
[17] B. Ludascher, I. Altintas, C. Berkley, D. Higgins, E. Jaeger-Frank, M. Jones, E. Lee, J. Tao, and Y. Zhao. Scientific workflow manage
ment and the kepler system. Concurrency a n d C om putation: Practice
& Experience, Special Issue on Scientific Workflows, 2005.
[18] D. Luebke et al. Level o f D etail f o r 3D Graphics. Morgan-Kaufmann
Publishers, 2002.
[19] D. Maier and D. S. Warren. Com puting With Logic: Logic Program
m ing With Prolog. Addison-Wesley, 1988.
[20] S. G. Parker and C. R. Johnson. SCIRun: a scientific programming
environment for computational steering. In Supercom puting, 1995.
[21] P. Rao, K. Sagonas, T. Swift, D. Warren, and J. Freire. Xsb - a system
for efficiently computing well founded semantics. In LPNM R, 1997.
[22] J. C. Roberts. Waltz - exploratory visualization tool for volume data,
using multiform abstract displays. In SPIE, volume 3298, pages 112
122, 1998.
[23] J. C. Roberts. Multiple-View and Multiform Visualization. In SPIE,
pages 176-185, 2000.
[24] W. Schroeder, K. Martin, and B. Lorensen. The Visualization Toolkit
A n O bject-O riented Approach To 3D Graphics. Kitware, 2003. [25] E. Stolte, C. von Praun, G. Alonso, and T. R. Gross. Scientific data
repositories: Designing for a moving target. In A C M SIG M O D , pages
349-360, 2003.
[26] H. Thompson, D. Beech, M. Maloney, and N. Mendelsohn. XML Schema Part 1: Structures. W3C Working Draft, Feb. 2000. [27] C. Upson et al. The application visualization system: A computational
environment for scientific visualization. IE E E Com puter Graphics
and A pplications, 9(4):30-42, 1989.
[28] W3C. Web services activity. http://www.w3.org/2002/ws. [29] Xerces Java parser 1.4.3. http://xml.apache.org/xerces-j. [30] XML path language (XPath) 2.0. http://www.w3.org/TR/xpath20. Re f e r e n c e s