Guided Automatic Binary
Parallelisation
Ruoyu (Kevin) Zhou
St John’s College
This dissertation is submitted in July, 2017 for the degree of Doctor of Philosophy in Computer Science
Abstract
For decades, the software industry has amassed a vast repository of pre-compiled libraries and executables which are still valuable and actively in use. However, for a significant fraction of these binaries, most of the source code is absent or is written in old languages, making it practically impossible to recompile them for new generations of hardware. As the number of cores in chip multi-processors (CMPs) continue to scale, the performance of this legacy software becomes increasingly sub-optimal. Rewriting new optimised and parallel software would be a time-consuming and expensive task. Without source code, ex-isting automatic performance enhancing and parallelisation techniques are not applicable for legacy software or parts of new applications linked with legacy libraries.
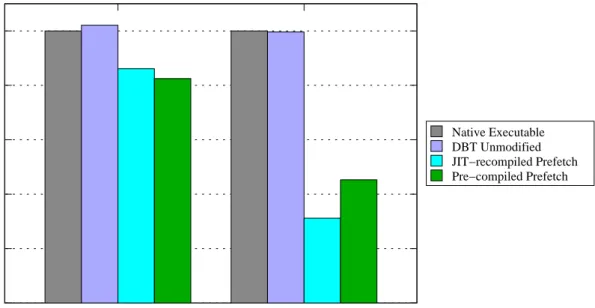
In this dissertation, three tools are presented to address the challenge of optimising legacy binaries. The first, GBR (Guided Binary Recompilation), is a tool that recompiles stripped application binaries without the need for the source code or relocation infor-mation. GBR performs static binary analysis to determine how recompilation should be undertaken, and produces a domain-specific hint program. This hint program is loaded and interpreted by the GBR dynamic runtime, which is built on top of the open-source dynamic binary translator, DynamoRIO. In this manner, complicated recompilation of the target binary is carried out to achieve optimised execution on a real system. The problem of limited dataflow and type information is addressed through cooperation be-tween the hint program and JIT optimisation. The utility of GBR is demonstrated by software prefetch and vectorisation optimisations to achieve performance improvements compared to their original native execution.
The second tool is called BEEP (Binary Emulator for Estimating Parallelism), an extension to GBR for binary instrumentation. BEEP is used to identify potential thread-level parallelism through static binary analysis and binary instrumentation. BEEP per-forms preliminary static analysis on binaries and encodes all statically-undecided questions into a hint program. The hint program is interpreted by GBR so that on-demand binary instrumentation codes are inserted to answer the questions from runtime information. BEEP incorporates a few parallel cost models to evaluate identified parallelism under different parallelisation paradigms.
The third tool is named GABP (Guided Automatic Binary Parallelisation), an ex-tension to GBR for parallelisation. GABP focuses on loops from sequential application binaries and automatically extracts thread-level parallelism from them on-the-fly, under the direction of the hint program, for efficient parallel execution. It employs a range of runtime schemes, such as thread-level speculation and synchronisation, to handle runtime data dependences. GABP achieves a geometric mean of speedup of 1.91x on binaries from SPEC CPU2006 on a real x86-64 eight-core system compared to native sequential execu-tion. Performance is obtained for SPEC CPU2006 executables compiled from a variety of source languages and by different compilers.
Acknowledgements
First and foremost, I would like to thank my supervisor Dr. Timothy Jones who guided me throughout my years in Cambridge. I appreciate the opportunities and challenges he offered me, and his valuable support that made this dissertation possible. I would have never got this far without his expertise and assistance. No matter how tough the technical challenges I encountered, he is always there for discussion and encourages me to find solutions and carry on.
My sincere appreciation also goes out to:
• Edmund Grimley-Evans, my advisor at ARM, for his invaluable insight in many technical challenges I faced. During my placement at ARM, thanks to his enor-mous support, my understanding in dynamic binary translation has significantly strengthened.
• Robert Mullins, for providing constant source of encouragement and research ideas throughout my years in the Computer Lab from MPhil to PhD, especially during the weekend.
• Niall Murphy, for his assistance in the implementation of parallel execution models.
• Tom Sun, for his assistance in finding parallelism from SPEC CPU2006 and provid-ing many legacy binaries compiled by different compilers.
• Sam Ainsworth, for his assistance in providing the software prefetching optimisation algorithms and test suites.
• Dennis Zhang, for his assistance in resolving a few significant technical challenges.
• Negar Miralaei, who tragically died shortly before finishing her dissertation, for her kind support and encouragement during the hard times.
• Everyone in Computer Architecture Group, for discussions and exchange at scrum meetings every two days.
• St John’s College for funding my tuition fee during my study and research in Cam-bridge, for providing the best scenery, environment, food and accommodation in Cambridge.
• ARM Ltd for funding my tuition fee and maintenance during my study and research in Cambridge.
• My wife and parents, for always being been so loving, caring and supportive during my research.
Contents
1 Introduction 13
1.1 Binary Recompilation . . . 13
1.2 Automatic Parallelisation . . . 14
1.3 Contributions . . . 15
1.4 Structure of this Dissertation . . . 17
2 Background 19 2.1 Dynamic Binary Translation . . . 19
2.1.1 Translation Process . . . 20
2.1.2 Just-In-Time Recompilation . . . 21
2.1.3 Linking and Indirect Branch Handling . . . 23
2.1.4 Trace Optimisation . . . 24
2.1.5 Dynamic Binary Instrumentation . . . 24
2.2 Static Binary Analysis . . . 26
2.2.1 Binary Abstraction . . . 27 2.2.2 Dependence Analysis . . . 29 2.3 Automatic Parallelisation . . . 34 2.3.1 Independent Multi-threading . . . 34 2.3.2 Cyclic Multi-threading . . . 35 2.3.3 Pipelined Multi-threading . . . 37 2.3.4 Polyhedral Multi-threading . . . 37 2.3.5 Speculative Multi-threading . . . 38
2.3.5.1 Thread Level Speculation . . . 39
2.3.5.2 Transactional Memory . . . 40
2.3.6 Profile Guided Multi-threading . . . 42
2.4 Summary . . . 43
3 Recompiling Binaries As Instructed 45 3.1 System Overview . . . 45
3.2 Design Choices . . . 47
3.2.1 Dynamic Binary Translation . . . 47
3.2.2 Static Binary Analysis . . . 48
3.2.3 Hint Instruction Interface . . . 48
3.3 Guided Binary Recompilation . . . 49
3.3.1 Guided IR Modification . . . 50
3.3.1.1 Case Study: JIT Prefetching Recompilation . . . 50
3.3.2 Guided Binary Instrumentation . . . 55
3.3.3.1 Case Study: Binary Vectorisation . . . 58
3.4 Related Work . . . 59
3.5 Summary . . . 60
4 Uncovering Parallelism In Binaries 63 4.1 Demand-driven Instrumentation . . . 63
4.1.1 Binary Emulator For Estimating Parallelism . . . 64
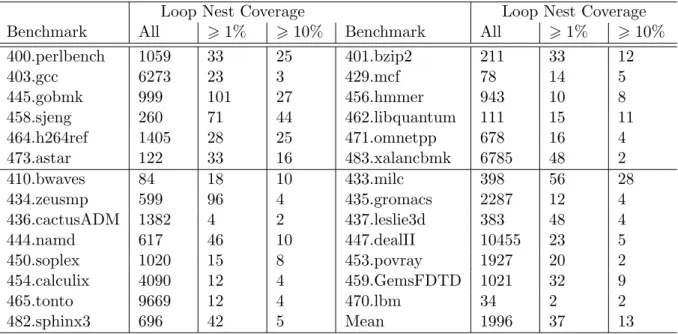
4.1.2 Benchmarks . . . 66
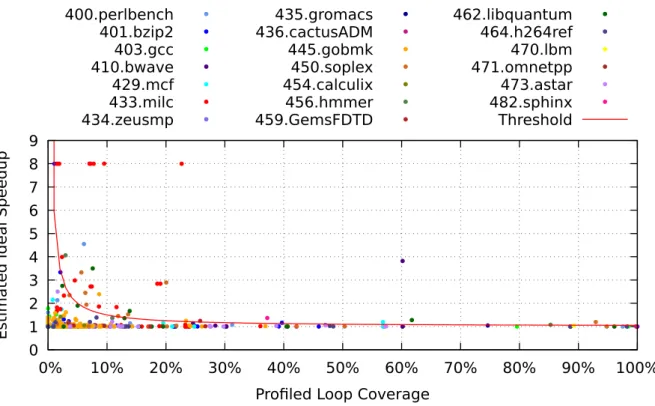
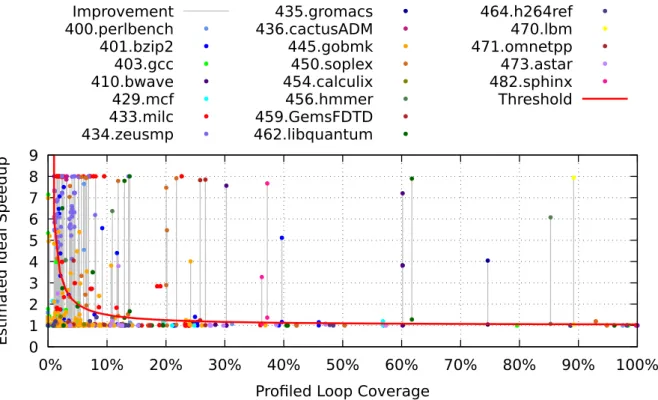
4.1.3 Loop Coverage Profiling . . . 66
4.1.4 Dynamic Data Dependence Profiling . . . 68
4.2 Ideal Parallel Execution Models . . . 70
4.2.1 DOACROSS Dataflow Model . . . 70
4.2.2 Induction/Reduction Optimisation . . . 72
4.2.3 Code Motion Model . . . 74
4.3 Realistic Parallel Execution Model . . . 78
4.3.1 Synchronisation Model . . . 79
4.3.1.1 Ambiguous Static Binary Analysis . . . 80
4.3.1.2 Thread Communication Latency . . . 83
4.3.2 Thread-level Speculation Model . . . 83
4.4 Related Work . . . 86
4.5 Summary . . . 87
5 Automatic Binary Parallelisation Framework 89 5.1 System Overview . . . 90
5.2 Static Hint Generation . . . 93
5.2.1 Loop Recognition . . . 93
5.2.2 Dependence and Alias Analysis . . . 94
5.2.3 Loop Characterisation and Selection . . . 98
5.2.4 Hint Generation . . . 99
5.3 Thread Management . . . 99
5.3.1 Threading States . . . 100
5.3.2 Thread Privatisation . . . 104
5.3.2.1 Thread Local Storage . . . 104
5.3.2.2 Register and Stack Privatisation . . . 105
5.3.2.3 Heap Privatisation . . . 106
5.4 DOALL Loop Parallelisation . . . 107
5.4.1 Block Parallelisation . . . 108
5.4.2 Cyclic Parallelisation . . . 108
5.5 Resolving Runtime Data Dependencies . . . 109
5.5.1 Just-In-Time Software Transactional Memory . . . 109
5.5.1.1 Read and Write Buffer . . . 110
5.5.1.2 Hint-Guided JIT Speculation . . . 110
5.5.1.3 Speculative Signal Handlers . . . 113
5.5.2 Speculative Value Prediction . . . 114
5.5.2.1 Guided Speculative Value Prediction . . . 115
5.5.2.2 Speculation or Synchronisation . . . 115
5.5.2.3 Versioned Signal and Wait . . . 116
5.6.1 Hint Generation Strategy . . . 118
5.6.2 Correctness and Verification . . . 119
5.6.2.1 Static Consistency Verification . . . 119
5.6.2.2 Dynamic Runtime Validation . . . 119
5.7 Related Work . . . 120 5.8 Summary . . . 121 6 System Evaluation 123 6.1 Experimental Setup . . . 123 6.2 Performance Evaluation . . . 125 6.2.1 Overhead Analysis . . . 126
6.2.2 Machine and System Variance . . . 128
6.2.3 Cyclic vs Block Parallelisation . . . 131
6.3 Irregular Loop Evaluation . . . 133
6.4 Performance Comparison and Related Work . . . 136
6.4.1 Comparison with Kotha on PolyBench . . . 136
6.4.2 Comparison with gcc autopar . . . 137
6.5 Summary . . . 138
7 Conclusion and Future Work 139 7.1 Contribution . . . 139
7.1.1 Guided Binary Recompilation . . . 139
7.1.2 Binary Emulator for Estimating Parallelism . . . 140
7.1.3 Guided Automatic Binary Parallelisation . . . 140
7.2 Future Work . . . 141
7.2.1 Standardisation . . . 141
7.2.2 Static Binary Analysis . . . 141
7.2.3 Adaptive Runtime System . . . 142
Bibliography 143 A Installation and Running Instructions 155 A.1 GBR Installation . . . 155
A.2 How to Run . . . 156
A.3 Standard Flow for Automatic Parallelisation . . . 156
Chapter 1
Introduction
The relationship between the computer architecture and software industries was described by Herb Sutter as “Andy giveth, and Bill taketh away”[1]. Before the early 2000s, the computer architecture industry delivered reliable and continuous processor performance enhancements through increased clock speeds and micro-architectural improvements in uniprocessors. No matter how fast processors got, software consistently has consumed the extra performance gain by adding more functionality. However, since the early 2000s, the computer architecture industry failed to continue to provide further improvement for uniprocessors. It is faced with diminishing returns in single-core performance at the cost of a significant increase in power, thermal dissipation and design complexity. As a result, computer architects have shifted development efforts tochip multicore processors (CMP) that place multiple cores in the same chip. These multicore processors can improve system throughput and improve performance for multiple processes and parallel applications.
However, the migration to CMP has presented a huge performance discontinuity for single-threaded software: latencies of single-threaded applications become even worse. Due to the power dissipation ceiling for multicore processors [2], cores are made simpler to meet the average power requirement. Each core is clocked at a lower frequency if all cores are switched on. What’s worse, the average memory bandwidth for each core is also less than for an equivalent uniprocessor. As a result, the sequential performance on a single core in a CMP is undoubtedly lower than a uniprocessor with the same power budget.
Efficient utilisation of CMPs is becoming the dominating challenge for compiler re-search. For decades, software industries have stacked a vast repository of sequential programs and libraries that were single-threaded. Some of them are still valuable and ac-tively in use. Most of their source code is either absent or protected, making it impossible to recompile on new generations of hardware. Even with the availability of source code, it would be much more expensive and time-consuming for programmers to write entirely new parallel programs.
1.1
Binary Recompilation
Every year new generations of hardware have constantly been released to the market. Currently, commodity desktop and server class processors from 8 to 16 cores are the norm. As more software is labelled “legacy” due to the advancement of hardware, it is important not to overlook the fact that sequential performance of more legacy software
becomes increasingly sub-optimal.
One effective approach to improve legacy sequential software performance is to modify legacy machine code to adapt to newer generations of hardware and achieve better perfor-mance. Modifications of the machine code are also called binary recompilation. It refers to the process of transforming original binary instructions into more efficient forms while achieving the same program behaviour. Binary recompilation can be performed statically or dynamically through binary translation.
Static binary translation typically lifts the binary bytecode to an intermediate form using decompilation techniques. From the intermediate representation, it performs trans-formation and then compiles to a newer version of the binary. However, the machine code for legacy software is typically stripped and obfuscated. The lack of symbolic information, the mixture of data and code and the existence of indirect branches prevents an accurate static analysis. Therefore for complicated binaries, static binary recompilers typically fail to recover sufficient semantic information to apply optimisation while maintaining the same program output. On the other hand, dynamic binary translation modifies and executes the binary at the granularity of a basic block at a time. Each basic block is modified and immediately executed at runtime. Therefore, dynamic translation is more flexible and robust compared to static translation. However, dynamic approaches suffer runtime translation overhead. Modifications are also limited to a block at a time due to the lack of global understanding of the whole program.
A combination of static and dynamic binary translation together builds on each other’s strengths. A static analysis of the binary can resolve the lack of global understanding of programs in dynamic translation. In turn, dynamic translation can access runtime information to alleviate the ambiguity. It also generates efficient just-in-time code to adapt to the underlying hardware components and achieves better performance.
In this dissertation, the first research hypothesis is that a combination of static binary analysis and dynamic binary translation can bring efficient binary recompilation and achieve better performance compared to the native execution of the original binary. To test the hypothesis, an open binary recompilation framework called GBR (Guided Binary Recompilation) is implemented. GBR performs static binary analysis to determine how recompilation should be undertaken, and produces a domain-specific hint program. This hint program is loaded and interpreted by the GBR dynamic binary translator. The problem of ambiguous static analysis is addressed through the cooperation between static hint program generation and just-in-time optimisation in dynamic binary translation. In this manner, complicated recompilation of the target binary is carried out to achieve optimised execution on a real system.
1.2
Automatic Parallelisation
The capability of comprehensive binary recompilation from GBR enables optimisation op-portunities for automatic parallelisation of legacy software binaries. Parallelisation refers to the process of identifying (or creating) independence among program statements and scheduling them for concurrent execution across multiple cores to achieve performance. Typically, parallelisation of a sequential program is performed manually by modifying the original source code. Over the past decades, many manual parallel language APIs, directives and libraries have been developed, such as pthread[3], MPI [4], OpenMP [5] and Intel TBB[6].
Despite all this support, re-writing existing sequential programs to be parallel is diffi-cult, even for skilled programmers. John Hennessy called parallelisation “a problem thats as hard as any that computer science has faced” [7]. Moreover, determining how to paral-lelise sequential applications optimally is a much more challenging task [8]. Programmers need to understand numerous details about the parallel algorithms, underlying hardware and spend tremendous efforts in verification and debugging. There are also new potential bugs introduced by parallelism, such as race conditions that are never there in a sequential program.
To relieve programmers from manual parallelisation, Automatic Parallelisation tech-niques have been introduced within tools such as compilers. Automatic parallelisation extracts parallelism from sequential programs and translates them into parallel versions. Rather than investing time and effort in parallel programming, programmers can leave the tool to do the parallelisation and pay more attention to developing more innovative applications. Recent automatic parallelisation approaches (HELIX [9], DSWP [10], SUIF [11], Pluto [12], Polly [13]) have demonstrated performance improvements over general purpose or scientific sequential programs. However, all of the techniques require the orig-inal source code for analysis. For legacy machine executables or libraries whose source code is protected or absent, automatic parallelisation techniques are not applicable.
The second research hypothesis is that existing automatic parallelisation transforma-tions which were developed for compilers’ intermediate representatransforma-tions can be also applied to application binaries through binary recompilation with the constraints of limited sym-bolic information without source code. Overall program speedup can be achieved through automatic binary parallelisation on a real system, compared to the native sequential ex-ecution of the binaries. To test the hypothesis, firstly the potential of thread-level paral-lelism is identified through static binary analysis and binary instrumentation in the GBR. The binary instrumentation framework is called BEEP, (Binary Emulator for Estimating Parallelism) that drives dynamic parallel cost models to estimate executable speedup. Secondly, once it proves enough parallelism, the automatic parallelisation transformation is implemented in GABP (Guided Automatic Binary Parallelisation). It combines the techniques from automatic parallelisation and binary recompilation and overcomes the limited data and control flow information using static analysis, profiling and just-in-time compilation.
1.3
Contributions
This dissertation aims to address the problem of CMP utilisation for legacy software bi-naries by optimising performance through dynamic binary recompilation and specifically recompiling binaries to enable automatic parallelisation. It is related to techniques in mature fields of research such as binary analysis, binary translation, runtime code opti-misation and automatic parallelisation. Many systems with different goals and designs have utilised these technologies, including compilers, emulators, simulators, virtual ma-chines, dynamic optimisers, and dynamic translators. However, recompiling binaries for parallelisation remains a fundamental blank space that has not been addressed by other systems.
Therefore, the original contributions of this dissertation are as follows:
approach for binary recompilation. It performs static binary analysis and generates domain-specific hint programs to automate the fine-grained modification process of dynamic binary translation. Compared to other binary translation framework, it combines the strength of both static binary analysis, dynamic binary translation and just-in-time compilation and overcomes the weaknesses of each. The prime novelty can be summarised as:
– It proposes a standardised interface that conveys information from static binary analysis to dynamic binary translation.
– It simplifies and decomposes the binary recompilation problem by treating the static hint generation as a compilation process and the dynamic binary translator as a virtual machine to interpret the static hint program.
The proposed guided binary recompilation can achieve speedup on a real system compared to native execution of the original binary. The utility of GBR is demon-strated by adding software prefetch instructions to binary applications and vectoris-ing parts of them to achieve performance improvements.
• Guided Binary Instrumentation for Parallelism Analysis: This
disserta-tion proposes a framework that is used to identify potential thread-level parallelism through the hybrid of static binary analysis and guided binary instrumentation. Compared to other limit studies in parallelism, the prime novelty can be summarised as:
– It performs preliminary static analysis on binaries and generates questions that are encoded in static hints. The questions are then answered by the dynamic binary translator. It is calledDemand-driven Instrumentation.
– It implements parallel execution models that combine the information delivered from static binary analysis and the runtime information and evaluates the potential parallelism based on existing parallelisation paradigms.
• Guided Automatic Binary Parallelisation: The dissertation proposes an
au-tomatic binary paralleliser that selects loops from sequential application binaries and automatically extracts thread-level parallelism from them on-the-fly, under the direction of the hint program, for efficient parallel execution. From the results, it can achieve performance speedup on a real system for SPEC CPU2006 benchmark executables. The prime novelty can be summarised as:
– It minimises threading overhead by using static binary analysis to guide just-in-time compilation in the dynamic binary translator.
– It minimises thread privatisation overhead by generating multiple different thread-private copies of loop code from the same original binary loop code.
– It implements a novel software transactional memory called JITSTM whose en-tire code is dynamically generated. The JITSTM is used to support thread-level-speculation-based parallelisation.
– It implements a hybrid of parallelisation schemes that handle data dependen-cies under the control of the hint program from the static binary analysis and profiling information. The hint program controls the dynamic code generation
that enforces runtime dependencies using thread-level speculation, synchroni-sation or value prediction.
1.4
Structure of this Dissertation
The structure of the dissertation is arranged as follows:
• Chapter 2: An overview of related background knowledge on dynamic binary trans-lation, static binary analysis and automatic parallelisation techniques.
• Chapter 3: Describes the first contribution: guided binary recompilation. Details of the guided binary recompilation are presented. The chapter also lists two case studies of automatic software prefetching and vectorisation to demonstrate the ef-fectiveness of GBR
• Chapter 4: Describes the second contribution. The chapter gives a comprehensive limit study in extracting various forms of parallelism from executables compiled from major benchmarks. The study also suggests feasible approaches for further parallelisation implementation in chapter 5.
• Chapter 5: Describes the third contribution. The chapter gives a description of the fundamental mechanisms of the GABP framework.
• Chapter 6: An evaluation of the performance by applying automatic parallelisation on a real system.
Chapter 2
Background
The chapter presents related knowledge and design choices made to build a binary re-compilation and parallelisation infrastructure. To recompile and parallelise a complicated executable, we need a system with three substantial sets of features. Firstly, the system needs to correctly analyse the given executable. It should identify possible regions that could be scheduled for recompilation. Secondly, the system needs to recompile the exe-cutable to the desired and optimised form. It should respect the original dependencies to preserve the same observable program behaviour. Thirdly, the system can extract task-level parallelism from the original binary to be scheduled for parallel execution. From the given three types of features, I discuss the related work from three fields in the following order: dynamic binary translation,static binary analysis and automatic parallelisation.
2.1
Dynamic Binary Translation
The foundation of recompiling and modifying binaries is the binary translation. Binary translation refers to converting source machine code compiled for a platform (source architecture) to another platform (target architecture). The translated target machine code could be in the same instruction set as the source machine code, which provides opportunities for optimisation, debugging and testing features. As binary translation can be performed across different instruction sets, it resolves compatibility issues and enables source application to be executed on incompatible machines.
Binary translation can be either performed statically or dynamically for the target platform. However, the static translation is never a complete solution [14]. Typically, binary executables are compiled on von Neumann machines1. There exist a large number
of ambiguities due to the specification of the hardware architecture, where indirect control flows, mixed layout of data and code sections, dynamic linking and self-modification features are common. With the ambiguities, static translation fails to retrieve enough information for correct translation for complicated executables.
The lack of the symbolic and control information can be partially compensated by extra debugging, profiling and linking meta-data. Some static binary translators such as Peephole Superoptimizers [15], Etch [16], DIABLO [17], ATOM [18] use the extra information to compensate for the impact of the loss of information and ambiguities. However, the extra information is not available for typical legacy binaries. Hence, the
applicability of static binary translators is limited. Static translators are rarely used by mainstream binary translation users.
On the other hand, dynamic binary translation (DBT) overcomes the lack of infor-mation problem. DBT translates the binary as the application is running natively. DBT is similar to binary emulation, where it interprets each source instruction using different instructions on the target machine. Emulation is relatively slow because the emulation process is typically an expansion of code. The emulated resource of each instruction is de-allocated after finishing the instruction. DBT optimises the emulation by buffering the emulated instructions in another allocated memory region (code cache) so that the interpreted code might be revisited again without duplicated interpretation.
There is a substantial body of DBT work for system virtualisation, such as VMware [19] or Virtual PC [20]. Here we only focus on user-mode binary translation on a sin-gle application. User-based DBT systems operate directly on program binaries with no need to access the source code of the guest application. It allows users to analyse and manipulate legacy code, proprietary code and streaming code in a straightforward and robust manner. Users may execute the whole program under the control of DBT systems or attach DBT to already running processes.
The flexibility of DBT enables many opportunities for program analysis, binary modi-fication and performance optimisation. In this project, I use DBT as an efficient platform to implement a Just-In-Time binary recompiler that aims for performance. Therefore, only performance-oriented DBT features are discussed more in detail.
2.1.1
Translation Process
In general, dynamic binary translators follow three different types, based on their styles of execution:
• Interpretation style: the original binary is viewed as data. Each original host
instruction is a callback to a piece of code that achieves the same functionality on the target machine.
• Probe style: the original binary is patched in-place by overwriting the original
instructions with jumps or interrupts to the new code.
• Just-In-Time style: It translates each basic block before execution. The block is
translated and buffered in the code cache. It then runs directly on modified code in the code cache.
The Interpretation-based DBT is widely used in fast binary emulators. Despite its re-use optimisations, it is still slow as interpreting each instruction results in code expansion. Probe-based DBTs can only be used when translating on the same compatible hardware. The translation is limited when modifying CISC instructions with variable lengths.
Therefore we focus on DBTs that follow the JIT style. A JIT DBT reads the runtime instruction stream one block at a time, translates each block of code and copies the translated code into a code cache. The translation process runs in units of basic blocks. A basic block is defined as a sequence of instructions that ends with a single control transfer instruction (jump, call, etc.). Once a block is copied to the code cache, the DBT executes the translated block natively on the target architecture.
The following code shows the main execution loop of dynamic binary translation of JIT style.
Basic Block A jump B
Basic Block B jump C
Basic Block C
Indirect jump D,E
Basic Block D
Basic Block E
Original Application
Translation
Translated A Dispatch(B) Translated B Dispatch(C) Translated C Dispatch(X) Translated D Translated E
Code Cache
Translated Indice DispatchFigure 2.1: Dynamic Binary Translation while (true) { dispatch: if (!(translated_pc = find_translation(pc)) translated_pc = translate(pc); execute: pc = execute(translated_pc); }
The last control transfer instruction of the block is replaced with a branch to the DBT dispatch procedure. The dispatch refers to the process of determining the next block to translate or execute in DBT. As shown in the above code, the dispatch procedure includes a search to find out whether the next incoming block has been translated. If the block is already translated, the control is redirected to the translated code in the code cache. And it only invokes translation when the incoming block is not found from its code cache. As new blocks of the target application are translated, the code cache is incrementally populated until eventually, the application runs entirely within the cached copy. Therefore DBTs typically suffer significant code cache warmup overheads if basic blocks are executed infrequently by the underlying application.
2.1.2
Just-In-Time Recompilation
When the DBT translates and copies a basic block to its code caches, it may perform modifications on the block for its purposes. The modified block is buffered and
immedi-Original basic block Translated basic block (Pseudo Code) add r0, r1 cmp [r0], r2 jle target struct cpu { uint64_t r0; uint64_t r1; uint64_t r2; ... }; s.r0=s.r0+s.r1 if (*(s.r0))<=s.r2) goto translate(target)
Figure 2.2: Binary translation by CPU virtualisation
ately executed in the code cache. We call the process Just-In-Time Recompilation. If the host and target machines share the same ISA, the fastest approach is to simply copy the original byte codes if they do not require modification. However, we still need to recognise and modify the last control transfer instruction of a block from its byte code to maintain control of the translation process. If explicit modifications are required, the block byte code is decoded into a list of internal, low-level intermediate representations (IR). The instructions in IR form facilitate platform-independent and easier modifications. After transformation, the IR is encoded back to byte codes. This method achieves the least translation overhead and therefore it is adopted by several high-performance DBTs such as DynamoRIO [21], the PIN tool[22] and MAMBO [23].
However, performing individual modification on each block is sub-optimal. When performing dynamic changes, the DBT is short-sighted and lacks a global view of the whole application. It typically steals a fraction of machine resources and inlines the modified code in the original basic block. Since it shares the same machine context as the original application, it is very expensive to request more registers to perform large-scale modifications. If more resources for modifications are required, the DBT typically performs a full context switch from the application.
If the DBT is not aiming for performance, there exists an alternative approach for modifications. Instead of stealing machine resources, it simulates the original machine states by allocating a dynamic structure of CPU register files and system registers. All operands from original instructions are translated to accessing the simulated CPU archi-tecture. The process is a form of virtualisation. It is widely used for translations across different architectures and heavy-weight binary analysis tools such as Valgrind[24] and QEMU [25].
Similarly, it converts all basic block byte codes into IRs while adding one extra level of indirection through the virtualised structure. For example, Figure 2.2 shows that a basic block from original machine code is translated based on the simulated structure struct cpu (in pseudo code). Each register access of r0 and r1 transforms into accessing the corresponding element from the structure. By correctly simulating the semantics of each instruction, the correct state of the machine context is maintained. As all machine contents are simulated in memory, the registers on target machines become available for executing newly recompiled code. With more freedoms in using target machine registers, the virtualised approach can be used for more comprehensive binary modifications. After
Basic Block A jump B Basic Block B
jump C Basic Block C
Indirect jump D,E
Basic Block D Basic Block E
Original Application Translation
Translated A jump tB Translated B jump tC Translated C jump R Translated D Translated E Code Cache Translated Indice Dispatch Indirect Lookup Miss Hit
Figure 2.3: Fragment linking and indirect branch lookup
translation, the DBT performs optimisations using state-of-the-art compiler optimisation techniques, such as constant propagation, common subexpression elimination, etc. The final IR is compiled to byte codes on the target machine.
However, storing machine contexts in memory adds an extra indirection on top of the original semantics of the program, making it difficult to recognise opportunities for opti-misation. There are also techniques [26] that map elements from the simulated structure to the original target machine registers for further performance improvement. Despite the optimisation efforts, virtualisation is still much slower than the native execution of the original binary. DBT that follows the virtualisation approach (e.g., QEMU) is around ten times slower than the light weight DBT such as DynamioRIO [27].
2.1.3
Linking and Indirect Branch Handling
As the translation process is an expensive task, it is vital to reuse the code as much as possible. If the target of a block is already translated and buffered, and it is targeted to another translated block via a direct branch, the two blocks can be directly linked together. The linking is implemented by directly overwriting the ending branches with new targets pointing to another translated code. Therefore, the DBT is a type of self-modifying application, due to its replacement of branch targets in during the link procedure.
However, indirect branches cannot be linked in the same way as direct branches be-cause their targets may vary. Usually, a DBT performs a search from the translation table to determine the translated target of the dynamic instance of the indirect branch. If the indirect branch is in a frequently executed routine (e.g., in a loop), the overhead for lookup might be even more expensive. One optimisation is to inline the hash table lookup into the original instruction stream [28] without performing context switches. As there
are different types of indirect branches such as indirect jump, function calls and returns, several hash table could be implemented to reduce collision rates of the hash table lookup.
2.1.4
Trace Optimisation
Even with inlined indirect branch lookup routine, a single indirect branch is expanded into tens of dynamic instructions for hash table lookup. The overhead for finding the address of the next translated block for indirect branches is still significant [29]. A possible optimisation is tospeculate on frequently taken targets of indirect branches. For example in Figure 2.5, basic block Chas an indirect branch targeting to either blockDorE. If the block D is more likely to be taken, the code of D is appended to the previous block C. And one extra runtime validation is inserted to check whether the actual branch target is the same as predicted. If the prediction is wrong, it falls back to normal indirect branch lookup.
Branches from multiple basic blocks are removed and the remaining code is stitched together, forming the concept oftraces orsuperblocks. Figure 2.5 illustrates the formation of traces. Direct branches such as A-B, B-C are removed, and basic block A,B and C are rearranged into a superblock. For indirect branch C-D,E, we speculate that the more frequent branch target is D and therefore we append the block D into the trace. There is an extra check to validate whether the actual target stays on the trace. If mis-speculated, it would fall back to normal indirect branch lookup routines.
Predicting the target of next indirect branch is called speculative chaining of basic blocks [31]. The concept of speculating on branch targets at runtime is reminiscent of the branch prediction in processors. Many well-known DBTs perform different chaining strategies: Dynamo [32] uses lightweight runtime profiling information to identify frequent targets for indirect branches. Pin [22] attempts to reduce overhead by jumping to a candidate destination block that begins with a compare to determine whether it is the correct destination, and on failure branches to the next candidate.
In addition to indirect branch optimisation, traces can also provide better code layout by removing direct branches and inlining of function calls. With trace optimisation, DBT could achieve better performance beyond the native execution for some applications [32, 33].
2.1.5
Dynamic Binary Instrumentation
With the JIT organisation of modify-copy-execution in dynamic binary translation, it is relatively easy to insert callbacks during the translation stage. By inserting trampoline calls to pre-compiled analysis code, we can examine runtime contexts and study dynamic behaviours of binaries. This process refers to dynamic binary instrumentation (DBI). For example in Figure 2.6, the functionmemory monitoris a pre-compiled code snippet which is not from the original application. The function call is inserted and invoked before the actual memory access [rax]. The dynamic memory address is recorded and analysed in the function memory monitor.
The inserted code for DBI such as memory monitor should follow the transparent principle. A transparent DBI requires three major conditions. Firstly, the changes made by inserted instrumentation code should not be observed by the original application. From the example, the transparency is achieved by inserting additional spill/recover code to maintain the live machine states. Secondly, various runtime attributes collected from
Basic Block A jump B
Basic Block B jump C
Basic Block C Indirect jump D,E
Basic Block D
Basic Block E
Original Application Translation
Translated A Translated B Translated C Translated D Translated E Trace Cache Translated Indice Dispatch Indirect Lookup Miss Hit Jump to D? No Code Cache
Figure 2.4: Building traces from basic blocks
A B C D E F G A B D E G C F G
Code Cache Trace Cache
Original basic block Modified basic block
add rax, rbx
cmp [rax], rcx
jle target
add rax, rbx
spill caller-save-regs
lea rdi, [rax]
call memory_monitor
restore caller-save-regs
cmp [rax], rcx
jle target
Figure 2.6: Example: modification to enable instrumentation of the memory access
[rax], assuming the original binary uses the same calling convention as the instru-mentation code.
instrumentation code should represent the exact runtime state when running without instrumented code. It requires the execution of the extra instrumentation code to meet the requirement of I/O or real-time conditions. Thirdly, code or libraries used in the instrumentation code should be re-entrant and isolated from the original application. For example, suppose there existsmalloc functions from the original application, the inserted instrumentation code should not use the same malloc function when instrumentating memory accesses of the malloc function.
With transparent instrumentation, it is feasible to perform dynamic binary analysis to gain insight of applications at various points in execution. It highlights one of the fun-damental differences between static binary analysis and dynamic binary analysis. Rather than considering what may occur in the static analysis, dynamic binary analysis operates on runtime events during the execution with no ambiguity. However, the results of the dynamic analysis are dependent on the input of the executable. Different combinations of inputs are required for more comprehensive dynamic analysis.
Transparent DBI have made it possible to develop some advanced dynamic binary analysis tools, for example, profiling and coverage analysis [34]; memory analysis [35, 36]; security analysis [37] and data race checking[38].
2.2
Static Binary Analysis
The second field of related work is static binary analysis, which is a subset of static program analysis. Static program analysis is a process of reasoning about the property of a program without actual running the program. It considers all possible different combination of inputs in contrast to dynamic program analysis. Typically static program analysis is performed with source code as inputs, while static binary analysis directly analyses binary objects. Both can abstract their inputs to the same data structure: the program dependence graph (PDG) [39]. They typically apply the same analysis algorithm from the PDG.
There are many usages for static binary analysis such as debugging, verification, re-verse engineering, security analysis, etc. This dissertation only focuses on analysis tech-niques specifically for automatic recompilation and parallelisation. In this section, I will discuss generic techniques to process binary executables, construct a PDG and the anal-ysis of control and data flows in the PDG.
2.2.1
Binary Abstraction
.init ELF header Segment header .text .rodata .data .bss(A) Input: executable binary file
main func3 func2 func1 main func1 func2 func3 mov dword [rbp-0x10], 0x0 jmp $0x40061f mov eax, [rbp-0xc] cmp eax, [rbp-0x18] jge $0x40061b mov [rbp-0x4], eax mov rax, [rbp-0x20] mov edx, [rbp-0x4] mov [rax], edx
mov eax, [rbp-0x10] cmp eax, [rbp-0x14] jl $0x4005f0 add dword [rbp-0x10], 0x1 main func1 func2 func3 func2 func3 func3 func3
(C) Global Call Graphs (B) Binary partition
(E) Control Flow Graph for each procedure func1
main func2 func3 IND1 IND2
(D) Procedures
Figure 2.7: Abstraction and parsing of binary executables
Typically, an application executable is arranged in a container format, specified by an executable header at the beginning. The header is typically operating system specific (e.g. PE in Windows, ELF in Linux, Macho in MacOS) that conforms to the Application Binary Interface (ABI) of the operating system. The header specifies the structure of the generated machine code. A typical executable can be divided into sections such as the .text(executable code),.data(static variables), .rodata (static constants) and other sections according to its ABI.
The binary header may be accompanied with symbol tables that help the compiler linker to determine entry points for procedures in the executable. As shown in Figure 2.7, input executable byte streams can be parsed into regions that represent procedures according to the specification of the binary header. After parsing, the byte array for each procedure is disassembled. Basic blocks are recognised and linked based on their branches and connectivities from the disassembly. The connected basic blocks constitute a control flow graph (CFG) for the procedure. Even for most legacy stripped binaries, the symbol table might not be available. Implicit procedure boundaries can still be recovered by
x86 jump table ARM jump table jmp *[0x400758+rax] data case_addr1 data case_addr2 data case_addr3 data case_addr4 ldr pc, [pc+r0] const case_addr1 const case_addr2 const case_addr3 const case_addr4
Table 2.1: Example of instruction and data mixture: jump tables
firstly building a CFG for the whole section and then identifying isolated clusters from the CFG.
However, there are many substantial barriers that prevent an accurate binary analysis. Firstly, the mixture of instructions and data present huge challenges for disassembling the executables, especially for CISC binaries. The original compiler for the executable may encode instructions and data together for many different purposes. Some binaries are deliberately obfuscated by mixing code and data, making it difficult to analyse. Some are intended to enable more advanced architecture features such as instruction-cache align-ment, branch slot optimisation, etc. For example, code generators may insert extra NOP operations to improve alignment for branch instructions. Some are used for implementing specific language constructs or avoiding the branch range limit in the architecture. A typical example is the jump table compiled from switch statements shown in Table 2.1, where pointers to different case statements are encoded a plain array. From binaries, determining the pattern, size and boundary for a jump table is a difficult task.
Secondly, recovering the complete CFG is difficult and error-prone due to indirect branches in binaries. An indirect jump may have multiple jump targets based on previous dynamic calculated values. If the indirect target is calculated from input data or function arguments, it is even not possible to accurately determine the target statically. Indirect jumps are very common in executables compiled from object-oriented languages such as C++. There are structures with virtual function calls encoded as indirect calls. The target of the virtual function could only be determined if the virtual function table vftableof the underlying class is located. There are also popular uses of function pointers and jump tables in languages such as C. The meta-information of the language constructs are typically removed as they are no longer needed for native execution. For legacy binary executables, they might also be obfuscated deliberately by their original venders for security purposes or space limitations. The obfuscation typically increases the uses of indirect branches. For example, Figure 2.8 shows a normal function call is obfuscated into indirect calls on the stack.
Thirdly, analysing the data flow on top of the problematic CFG is more tedious and error-prone. Modern architectures such as x86 typically have hundreds of different in-structions, with new extensions added at each processor revision. Each instruction may have complex semantics, making it difficult to obtain data flow with millions of these instructions. Some hardware features may result in more ambiguity in generated bina-ries, such as indirect memory accesses, conditional instructions, software exceptions, etc. Indirect memory accesses present a huge challenge for analysing data dependencies from memory accesses in executables. There are existing analysis algorithms such as Alias Analysis [40] or Value Set Analysis [41] that perform over-approximation to the set of
Binary without Obfuscation Binary with Obfuscation
call function push function_addr
sub rsp, 0x20
...
jmp *[rsp+0x20]
Figure 2.8: Example: the call to functionis obfuscated through stack operations
values that the instruction may access.
All the mentioned factors constitute in the loss of information compared to the in-formation that can be retrieved from source level. Therefore, the scope and accuracy of resulting static analysis would be affected. Granted, heuristics and architectural conven-tions can partially solve some of these problems. Static binary analysis fails to achieve moderate accuracy for generic executables.
2.2.2
Dependence Analysis
In order to transform the original binary with the same expected output, the static analysis is primarily a problem of studying dependencies between instructions. A dependency refers to a set of order constraints to correctly execute an instruction in the program. The enforcement of all dependencies guarantees the observation of the same program behaviour. It is possible to derive many different execution orders by respecting the same dependencies in a program. The orders are proved to be strongly equivalent to each other [42].
The specification of dependencies is arranged in data structures such as dependence graphs. Consecutive dependencies on the same storage entity (memory addresses etc.) make up the flow of information. Typically, the flow analysis of a program consists of studies in control flow and data flow. The results of control and data flow analysis are used for constructing the whole program dependence graph (PDG).
Control Dependencies
Ideally, the control flow analysis of the executable is performed on the control flow graph (CFG) of the executable, whose nodes are individual instructions. For simplicity, se-quences of instructions ended with only one control transfer instruction are wrapped in a basic block. All instructions in a block are assumed to be executed in order in an in-order machine. With the simple control nature in basic blocks, control flow graphs (CFG) can be simplified, where each node in the CFG represents a basic block, and each edge in the CFG stands for a control transfer.
A complete CFG for the whole executable is typically hierarchical. It is arranged into two levels of directed graphs as shown in Figure 2.7. The first level is called Call Graph, which represents calling relationships between subroutines in the executable. Each node accounts for a subroutine, and each edge (f,g) indicates that procedurefcalls procedure g. Thus, cycles in the directed call graph represent recursive procedure call chains. The second level denotes the CFG for each subroutine whose nodes are basic blocks. The whole CFG for each procedure represents a node in the first-level call graph.
A nodeNis said to have acontrol dependence on a preceding nodeMif the outcome of
M determines whether N should be executed. However, edges in a CFG do not explicitly reflect the control dependent relations from any two blocks from the CFG. Cytron et al. [43] gave a formal definition of control dependencies using dominator analysis.
For a CFG with an entry node E, suppose there are two nodes M, N from the CFG, we say node M dominates node N when all paths from node E to node N must also go through node A. Theimmediate dominator of Nrefers that there is only one distinct node
M that dominates N and there is no other node in the graph that also dominates N. By combining domination relations for all nodes in a CFG, a dominator tree could be built, where children of a node are those nodes it immediately dominates. The dominator tree can be used for quickly querying the dominating relations between any two blocks from a CFG.
Thedominance frontier of a nodeMrefers to a set of nodesN, whereNis not dominated by M, but N’s predecessor is dominated by M. It is a set of nodes that M’s dominance terminates. The dominance frontier is typically used in compilers to convert statements into static single assignment form. For some cases, a post-dominance relation is defined as the reverse of dominance analysis, where it traverses from one of the exit nodes to the entry node in the CFG. From Cytron et al., the formal definition of control dependencies can be defined as: Let X and Y be two nodes in a control-flow graph. Y is control dependent on X iff X is in the post-dominance frontier of Y. The control dependence relation is not symmetric, reflexive, nor transitive.
Data Dependencies
A program consists of many instructions where each instruction processes multiple sources into one or multiple destinations. The flow of data is created when multiple instructions reuse data from the same storage location. A data dependence defines the direction of the flow between storages.
For two instructions i and j in the program that access the same a storage location
M, different types of data dependence are created from j toi:
1. Read-After-Write(RAW), ifi writes toM andj reads from M. It is called the flow or true dependence since the data flows fromitoj through the storage location M. 2. Write-After-Read(WAR), if i reads from M and j writes to M. It is called anti or name dependence. This kind of dependency is normally caused by reuse of storage locations, and they can be removed by renaming (privatisation) or using other storage locations.
3. Write-After-Write(WAW), output dependence: if bothiand j write toM. It is also called the output dependence and they can be also removed by renaming.
Figure 2.9 shows an example of the different kinds of data dependencies from static binary analysis. At binary level, A data flow edge is formed when two instructions access the same register, stack or memory locations. The combination of all data dependence edges in a procedure constitute a data dependence graph (DDG), where each edge is one of the RAW, WAR and WAW types.
Retrieving accurate DDGs from binaries is a challenging task. It has been a body of intense research for decades [44] in compiler optimisations. The conventional approach
Loop 46 in 401.bzip2:mainSort 204 movsxd rcx, edx 205 add rcx, r14
206 movzx esi, byte ptr [rcx] 207 shr ax, 8 208 mov rbx, qword ptr [rsp + 0x70] 209 sub rcx, 1 210 shl esi, 8 211 or eax, esi 212 movzx esi, ax 213 lea rdi, [rbx + rsi*4] 214 mov ebx, dword ptr [rdi] 215 lea esi, [rbx - 1]
216 mov rbx, qword ptr [rsp + 0x58] 217 mov dword ptr [rdi], esi 218 movsxd rsi, esi
219 mov dword ptr [rbx + rsi*4], edx 220 sub edx, 1
221 cmp edx, -1
222 jne 0x40273e -> 206
223 xor eax, eax
Write A Read A Read A Write A Read A Write A Read A Write A Iteration i Iteration i+1
Read after Write (RAW) Write after Read (WAR) Write after Write (WAW) Cross-Iteration
(a) Illustration of four kinds of data dependencies loop_46 209 206 210 211 207 212 220 219 221 213 215 208 214 217 216 218
(b) Data Dependence Graph Figure 2.9: Example of a small loop from an executable from the SPEC2006 401.bzip2 benchmark
to perform data-flow analysis is to set up dataflow equations for each node of the CFG and solve them by repeatedly calculating the output from the input locally at each node until it converges. The dataflow equation of a node specifies a transfer function and join function between the input and outputs of its predecessors in the CFG.
OUTn =Transfer(INn) (2.1)
INn =Join(∪p∈predOUTp) (2.2)
However, due to the widespread existence of memory indirection (pointers), it is impos-sible to statically determine the exact read and write locations for some instructions[45]. For instructions with indirect accesses, transfer and join functions are inherently ambigu-ous. Hence they affect the accuracy of data flow analysis. Alias analysis is the process to prove whether two indirect (pointer) accesses that are reading the same location. For the last three decades, many algorithms and approaches [46, 47, 48, 49, 50, 51] have been developed to boost the accuracy of alias analysis.
However, many comprehensive alias analysis suffers diminishing returns if more sophis-ticated analysis algorihm is used. The existence of pointer arithmetic and casting makes it an NP-hard problem [52]. Moreover, there are many parts of the code that is directly referencing to input data, which are statically undecidable on dependencies. Even with decidable data dependencies, for programs with dynamically changing access patterns, the static analysis could not conclude a close-form dependence relation. Consequently, the result of static data dependence analysis is typically a conservative approximation. The conservative analysis would potentially turn off many transformation and optimisation opportunities.
Loop Dependencies
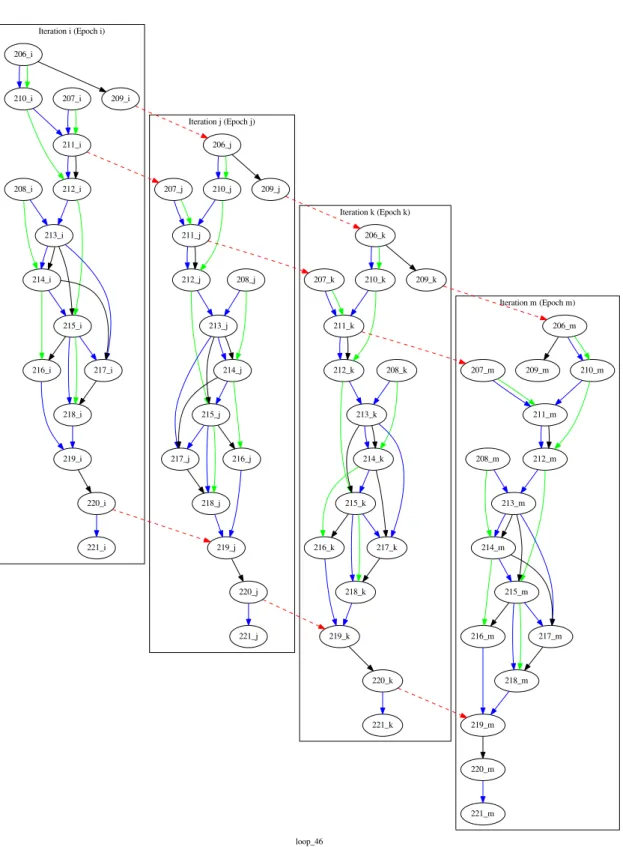
Specifically for loops, dependencies can be further categorised. Dependencies generated by instructions from different iterations in a loop are called intra-iteration or cross-iteration dependencies. Dependencies occur between instructions in the same iteration are called inter-iteration dependencies. For example, Figure 2.10 shows the updated dependence graph by unrolling the loop from Figure 2.9 into dynamic instances. Loop related depen-dencies are essential to enable fundamental transformations in automatic parallelisation on loops. More details in recognising loop dependencies will be discussed in the next section.
loop_46 Iteration i (Epoch i) Iteration j (Epoch j) Iteration k (Epoch k) Iteration m (Epoch m) 206_i 210_i 209_i 211_i 212_i 207_i 207_j 213_i 215_i 208_i 214_i 217_i 216_i 218_i 219_i 220_i 221_i 219_j 206_j 210_j 209_j 211_j 220_j 212_j 207_k 213_j 215_j 208_j 214_j 217_j 216_j 218_j 221_j 219_k 206_k 210_k 209_k 211_k 220_k 212_k 207_m 213_k 215_k 208_k 214_k 217_k 216_k 218_k 221_k 219_m 206_m 210_m 209_m 211_m 220_m 212_m 213_m 215_m 208_m 214_m 217_m 216_m 218_m 221_m
Figure 2.10: Dependence Graph of dynamic instances of instructions by unrolling the loop from Figure 2.9 into dynamic instances
2.3
Automatic Parallelisation
The third field of related work is automatic parallelisation. Parallelisation refers to con-verting sequential, single-threaded executions into the multi-threaded executions on a parallel platform. The process of parallelisation can be manual, interactive or fully auto-matic. Despite that manual or interactive parallelisation of a program is challenging and time-consuming, automatic parallelisation is the most ambitious task of the three. Its objective is to remove the burden of programmers on understanding and expressing the parallelism which exists in the algorithm.
Automatic parallelisation research for parallel hardware has a long history since the introduction of parallel programming. Conventional automatic parallelisation techniques rely on results of static program analysis to recognise parallelism, and transform the identified sequential code into a parallel form. The correctness is realised by enforcing data and control dependencies collected from static analysis or profiling information. As applications spent most of the executing time in loops, most techniques focus on loop-level parallelism.
Despite the enormous effort in research, a generally applicable solution for automatic parallelisation is still elusive. The most difficulty resides in the automation of the process without any manual intervention. Compared to manual parallelisation, current generic au-tomatic approaches lack the ability to parallelise a program based on its algorithm or data structures. They have to follow fixed loop models based on the nature of data and control flow of the loop. Based on the way of decomposing parallelism, three primary loop par-allelisation models have been developed: DOALL[53], DOACROSS[54] and DOPIPE[55]. These models are also called independent, cyclic and pipelined multi-threading respec-tively.
2.3.1
Independent Multi-threading
A loop is called DOALL, independent or embarrassingly parallel if each iteration in the loop can be executed independently without interfering with other iterations. DOALL loop iterations can be concurrently scheduled to threads with no order requirement. No synchronisation is required, and consequentially it yields a proportional speedup.
DOALL loops are the simplest loop form and they are typically observed from sci-entific, media and image based applications. Even for manual parallelisation, competent programmers tend only to parallelise this form of loop since it is easy to implement with-out writing synchronisation code and the performance gain is almost proportional. Due to its simplicity, there are also a few automatic parallelisation compilers such as Polaris [56], SUIF [11] that focus on DOALL and DOALL-like loops.
From the static analysis, a DOALL loop can be recognised if we can either statically or dynamically prove there are no other cross-iteration dependencies except the induction variable. However, it is very difficult to prove the independencies across iterations, for a complicated loop with indirect memory accesses, function calls and other sophisticated control flows. With limited power of static analysis, the coverage of statically-proved DOALL loops is typically low. There is a range of dynamic approaches such as the LRPD test [57] that parallelise undecided loops to be DOALL loops speculatively and optimistically. More details will be discussed in Section 2.3.5.1.
To extend the scope of DOALL loops, a broader concept for DOALL is used by many automatic parallelisation compilers. Figure 2.11 illustrates a typical DOALL loop
DOALL loops DOALL loops with reduction variables
1 for (i=0; i<n; i++) 2 {
3 a[i] = work(i); 4 }
1 int result, val; 2 int sum = 0; 3 for (i=0; i<n; i++) 4 { 5 result = work(i); 6 val = evaluate(result); 7 sum += val; 8 }
Figure 2.11: Example of DOALL loops if the function work and evaluate are proved independent.
and a DOALL loop with clear induction and reduction variable with simple reduction operations. The rest of accesses are independent between each iteration. It allows the removal of WAR and WAW cross-iteration dependencies using privatisation techniques [58]. Reduction variables on a few simple reduction operations (plus, subtract, etc.) can also be handled using thread-private reductions.
Operations allowed in the broad-DOALL loops can be summarised as a function with the iteration index as its argument. In other words, a thread can regenerate all relevant iteration context based on the given value of induction variable instead of relying on the previous versions of variables. The transformation is the reverse of strength reduction in compiler optimisations. With this property, the iteration space of DOALL loops can be split and scheduled freely to different execution units without synchronisation.
2.3.2
Cyclic Multi-threading
Even with the broader definition of DOALL loops, the scope of DOALL loops is still limited. With the existence of many cross-iteration dependencies, a more generic loop model for automatic parallelisation called DOACROSS [54] or cyclic multi-threading was developed. The DOACROSS model assigns loop iterations to fixed number of threads in a round-robin style. All cross-iteration dependencies are enforced by forwarding values between threads through synchronisation. For each cross-iteration dependence pair, each thread waits and retrieves the input from the previous thread, performs calculations, and signal the updated value to the next thread. The minimum required number of instructions to complete the wait, calculate and signal is treated as a sequential segment. Parallelism can be achieved by overlapping the execution of the rest of independent code. For example, Figure 2.12 shows the flow of DOACROSS operations. Cross-iteration dependencies between from block D to block C is resolved by forwarding output data through thread synchronisation. Performance can be achieved by overlapping the execu-tion of the rest of loop body (block E, A, B) in parallel. The proportion of the size of the sequential segment over the whole loop iteration size reflects the sequential fraction of the loop.
DOACROSS is universally applicable and scalable. Any generic loop can be trans-formed into the form of one or more sequential segments followed by parallel segments, as long as the data dependence graph is obtained. However, DOACROSS loop models
A1 B1 C1 D1 E1 A2 B2 C2 D2 E2 A3 B3 C3 D3 E3 Iteration i Iteration i+1 Iteration i+2 SEQUENTIAL A1 B1 A2 B2 A3 B3 C1 D1 C2 D2 C3 D3 E1 E2 E3 Thread 1 Thread 2 Thread 3
A3 B4 A4 A5 B5 C4 D4 C5 D5 E4 E5 DOPIPE A1 B1 C1 D1 E1 A2 B2 C2 D2 E2 A3 B3 C3 D3 E3 A4 B4 C4 D4 E4 A5 B5 C5 D5 E5
Thread 1 Thread 2 Thread 3
Sequential Segment DOACROSS Main ... Intra-Iteration
Dependences Cross-Iteration Dependences
Original Iteration B3 SCC C3 Input D3 Ouput
Figure 2.12: DOACROSS and DOPIPE parallelisation
have a few disadvantages. Firstly, if the size of sequential segments is too large compared to the whole iteration size, the loop is not beneficial for parallelisation since most of the operations have to be serialised. Secondly, DOACROSS is highly sensitive to inter-thread communications. For each iteration, it has to execute one or more sequential segments that require at least two synchronisation operations. The critical data flow path is placed through synchronisation, so that a single fluctuation in thread communication would af-fect the execution of all subsequent waiting threads. High communication cost would easily amortise the benefits provided from overlapping of parallel fractions. In the past when inter-thread communication was expensive (hundreds of cycles), DOACROSS could not find suitable loops that demonstrate good performance.
In recent years, the emergence of the single-chip multicore processors has drastically reduced the communication costs, inspiring HELIX [59] to extend the DOACROSS model to achieve performance for more general loops. Compared to DOACROSS, HELIX min-imises the size and number of sequential segments using comprehensive static analysis. It also reorders sequential segments to achieve better overlapping. To further reduce the cost of thread synchronisation, it uses hyperthreading to pre-fetch thread communication sig-nals. HELIX demonstrated an average 2.25×speedup for SPEC2000 benchmarks [60] on a
six-core commercial processor, which is one of the most efficient automatic parallelisation techniques appeared to date in the area. As the cost of thread synchronisation continues to shrink due to advances in parallel hardware and process technology, DOACROSS style parallelisation will achieve performance on more loops in practice.
2.3.3
Pipelined Multi-threading
Another universal parallelisation paradigm is the DOPIPE or pipelined multi-threading. Rather than placing each iteration cyclically on each core, DOPIPE splits the loop body into several stages. Each thread is only responsible for executing dynamic instances from a single stage. Figure 2.12 (right) shows the loop iteration is split into three stages,
AB,CD andE. And all three stages are scheduled to three different threads respectively. Compared to DOACROSS, DOPIPE arranges the original thread communication path
D → C to the same thread and exposes the original inter-iteration dependencies to communicate across threads.
Decoupled software pipelining (DSWP) [10] is a state-of-the-art DOPIPE technique. To apply the orthogonal transformation, DSWP performs extensive static analysis and builds a dependence graph for the static form of loop iterations. It then splits the graph into stages and schedules them into multiple execution units. Since the slowest stage de-termines the overall performance, it is essential to ensure load-balancing between threads for optimal performance. DSWP demonstrated an average of 1.81 × speedup on eight cores for SPEC2000 benchmarks. There are also a few extensions [61, 62] that combine other forms of parallelism into their paradigm.
The principle of DOPIPE is to reduce the inter-iteration (cross) dependencies by apply-ing an orthogonal transformation between the original intra-iteration and inter-iteration dependencies. If the resulting transformed code turns out to have more inter-iteration dependencies across thread contexts, it is then not beneficial to apply the pipelining trans-formation. For many complicated loops from generic applications, DWSP technique finds it difficult to split effective partitions and achieve a balanced load for threads. Moreover, the scalability of the stage partition is also limited. There are typically not many stages that can be effectively partitioned. It is typically difficult for DSWP to scale beyond four threads [61].
2.3.4
Polyhedral Multi-threading
Both DOACROSS and DOPIPE are universally applicable to all kinds of loops. For DOACROSS, it splits workloads by following the boundaries of the original iterations, while DOPIPE performs an orthogonal transformation and partitions tasks into stages. They both suffer the excessive synchronisation cost if there are more dependencies that cross the boundary of partitions. Between the two approaches, DOACROSS is more sensitive to the number of cross-boundary dependencies while DOPIPE is more vulnerable to load balancing.
It is possible to perform a transformation in a specific direction in-between the cross-iteration and intra-cross-iteration space, so that the transformed code would have the minimum number of synchronisations across the boundary of partitions. However, transformation to another iteration space is not easy for general loops if the access patterns of a loop cannot be summarised in a close form. Instead, people focused on a very narrow spectrum of loops called affine loops. Affine loops are multi-dimensional loops that have uniform loop
DOAROCSS DOPIPE Polyhetral Original Intra-Iteration O ri gi nal I nt er -I te ra ti on Transformation Direction
DDG: Original Outer Loop i j 1 5 9 13 2 6 10 14 3 7 11 15 4 8 12 16 Polyhedral Transformation p = 2i-j q=j 1 2 5 3 6 9 7 10 13 14 11 8 4 15 12 16 N Iteration Number
Figure 2.13: Parallelism exposed by polyhedral transformation
induction variables and can only have memory accesses whose address must be indexed by a polynomial representation of loop induction variables. No complex control flow is allowed in the loop. Affine loops are commonly seen from signal or image processing applications that operate on matrix data structures. The following code shows an example of an affine loop. 1 for (int i=0; i<M; i++) { 2 for (int j=0; j<N; j++) { 3 A[c1*i+c2][c3*j+c4] = B[c5*i+c6][c7*j+c8]; 4 } 5 }
With uniform loop induction variables and polynomial memory accesses, data dependence relation could be analysed precisely in the space of iteration dimension (i, j). The data de-pendence mesh is characterised asdependence polyhedron. The dependence polyhedron on coordinates (i, j) can beaffine transformed into another space (p, q) so that dependencies in the new coordinate system are minimised.
The polyhedral scheduling approach provides a framework that unifies DOALL, DOPIPE and DOACROSS. PLUTO [12] and LLVM Polly [13] are compilers that enable polyhedral parallelisation. Despite the effort to extend the model to be more applicable [63], poly-hedral models could hardly find any optimisation on generic applications with irregular loops. As a result, polyhedral parallelism is not considered in this dissertation.
2.3.5
Speculative Multi-threading
All the DOALL, DOACROSS and DOPIPE loop models are based on the assumption that static analysis would provide accurate information of data dependencies. However,
as discussed in Section 2.2.2, it is difficult to obtain accurate data dependence relations, especially from loops with many complex control flows and indirect memory accesses. Historically automatic parallelisation techniques [56, 11] reject ambiguous loops for par-allelisation. HELIX[59] and DSWP [10] shrink the dependence ambiguity by employing more aggressive and expensive data dependence and alias analysis [49]. It is also shown that with improved accuracy of static analysis, the consequent performance is improved [10]. However, from the level of HELIX static analysis, it has seen diminishing returns as more compute intensive static analysis is employed [64].
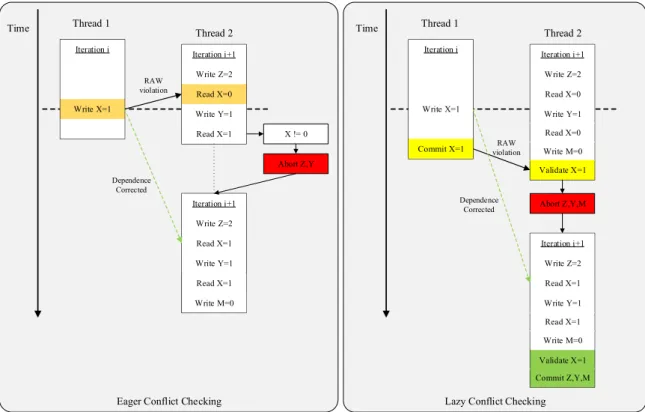
2.3.5.1 Thread Level Speculation
In contrast to seeking the extreme of accurate static analysis, an alternative approach is to use thread-level speculation (TLS) or speculative multithreading. The concept of speculation is well adopted in the architecture design for instruction level parallelism, such as speculative execution in superscalar architectures. Similarly, TLS is a run-time technique to allow tasks to be executed concurrently by o