The CAFA challenge reports improved protein function prediction
and new functional annotations for hundreds of genes through
experimental screens
Naihui Zhou1,2, Yuxiang Jiang3, Timothy R Bergquist4, Alexandra J Lee5, Balint Z Kacsoh6,7, Alex W Crocker8, Kimberley A Lewis8, George Georghiou9, Huy N Nguyen1,10, Md Nafiz Hamid1,2, Larry Davis2, Tunca Dogan12,13, Volkan Atalay14, Ahmet S Rifaioglu14,16, Alperen Dalkiran17, Rengul Cetin-Atalay18, Chengxin Zhang19, Rebecca L
Hurto20, Peter L Freddolino21,22, Yang Zhang23,24, Prajwal Bhat25, Fran Supek26,27, Jos´e M Fern´andez28,29, Branislava Gemovic30, Vladimir R Perovic31, Radoslav S Davidovi´c30, Neven Sumonja30, Nevena Veljkovic30,
Ehsaneddin Asgari32,33, Mohammad RK Mofrad34, Giuseppe Profiti35,36, Castrense Savojardo37, Pier Luigi Martelli37, Rita Casadio37, Florian Boecker38, Indika Kahanda39, Natalie Thurlby40, Alice C McHardy41,42, Alexandre Renaux43,44, Rabie Saidi45, Julian Gough46, Alex A Freitas47, Magdalena Antczak48, Fabio Fabris47,
Mark N Wass49, Jie Hou50,51, Jianlin Cheng51, Jie Hou50,51, Zheng Wang52, Alfonso E Romero53, Alberto Paccanaro54, Haixuan Yang55, Tatyana Goldberg56, Chenguang Zhao57, Liisa Holm58, Petri T¨or¨onen58, Alan J Medlar58, Elaine Zosa58, Itamar Borukhov59, Ilya Novikov60, Angela Wilkins61, Olivier Lichtarge61, Po-Han Chi62,
Wei-Cheng Tseng63, Michal Linial64, Peter W Rose65, Christophe Dessimoz66,67, Vedrana Vidulin68, Saso Dzeroski69,70, Ian Sillitoe71, Sayoni Das72, Jonathan Gill Lees73,74, David T Jones75,76, Cen Wan75,76, Domenico
Cozzetto75,76, Rui Fa75,76, Mateo Torres53, Alex Wiarwick Vesztrocy77,78, Jose Manuel Rodriguez79, Michael L Tress80, Marco Frasca81, Marco Notaro81, Giuliano Grossi81, Alessandro Petrini81, Matteo Re81, Giorgio Valentini81, Marco Mesiti81, Daniel B Roche82, Jonas Reeb83, David W Ritchie84, Sabeur Aridhi84, Seyed Ziaeddin Alborzi85,86, Marie-Dominique Devignes85,87, Da Chen Emily Koo88, Richard Bonneau89,90, Vladimir Gligorijevi´c91,
Meet Barot92, Hai Fang93, Stefano Toppo94, Enrico Lavezzo94, Marco Falda95, Michele Berselli94, Silvio CE Tosatto96,97, Marco Carraro98, Damiano Piovesan99, Hafeez Ur Rehman100, Qizhong Mao101,102, Shanshan Zhang103, Slobodan Vucetic104, Gage S Black105,106, Dane Jo105,106, Dallas J Larsen105,106, Ashton R Omdahl105,106, Luke W Sagers105,106, Erica Suh105,106, Jonathan B Dayton105,106, Liam J McGuffin107, Danielle A Brackenridge107, Patricia C Babbitt108,109, Jeffrey M Yunes110,111, Paolo Fontana112, Feng Zhang113,114, Shanfeng Zhu115, Ronghui
You115, Zihan Zhang115, Suyang Dai116, Shuwei Yao117, Weidong Tian113,114, Renzhi Cao118, Caleb Chandler118, Miguel Amezola118, Devon Johnson118, Jia-Ming Chang119, Wen-Hung Liao119, Yi-Wei Liu119, Stefano Pascarelli120, Yotam Frank121, Robert Hoehndorf122, Maxat Kulmanov123, Imane Boudellioua124,125, Gianfranco Politano126, Stefano Di Carlo126, Alfredo Benso126, Kai Hakala127,128, Filip Ginter127,129, Farrokh Mehryary127,128, Suwisa Kaewphan130,131, Jari Bj¨orne132,133, Hans Moen134, Martti E E Tolvanen135, Tapio Salakoski132,133, Daisuke
Kihara136,137, Aashish Jain138, Tomislav ˇSmuc139, Adrian Altenhoff140,141, Asa Ben-Hur142, Burkhard Rost143,144, Steven E Brenner145, Christine A Orengo72, Constance J Jeffery146, Giovanni Bosco147, Deborah A Hogan8, Maria J Martin9, Claire O’Donovan9, Sean D Mooney4, Casey S Greene148,149, Predrag Radivojac150, and Iddo Friedberg1,2
1Veterinary Microbiology and Preventive Medicine, Iowa State University
2Program in Bioinformatics and Computational Biology, Iowa State University, Ames, IA,USA 3Indiana University Bloomington, Bloomington, Indiana, USA
4Department of Biomedical Informatics and Medical Education, University of Washington, Seattle, WA, USA 5Department of Systems Pharmacology and Translational Therapeutics, University of Pennsylvania, Philadelphia, PA, USA
6Department of Molecular and Systems Biology, Geisel School of Medicine at Dartmouth 7Department of Molecular and Systems Biology, Hanover, NH,USA
8Department of Microbiology and Immunology, Geisel School of Medicine at Dartmouth, Hanover, NH, USA 9European Molecular Biology Laboratory, European Bioinformatics Institute (EMBL-EBI), Hinxton, United Kingdom
11Program in Bioinformatics and Computational Biology, Ames, IA, USA 12Graduate School of Informatics, Middle East Technical University (METU) 13European Molecular Biology Laboratory, European Bioinformatics Institute (EMBL-EBI)
14Department of Computer Engineering, Middle East Technical University (METU)
16Department of Computer Engineering, Iskenderun Technical University, Hatay, Turkey, Ankara,Turkey 17Department of Computer Engineering, Middle East Technical University (METU), Ankara, Turkey
18CanSyL, Graduate School of Informatics, Middle East Technical University (METU), Ankara, Select a State or Province, Turkey
19Department of Computational Medicine and Bioinformatics, University of Michigan, Ann Arbor, MI, USA 20Department of Biological Chemistry, University of Michigan, Ann Arbor, MI, USA
21Department of Biological Chemistry, University of Michigan
22Department of Computational Medicine and Bioinformatics, University of Michigan, Ann Arbor, MI,USA 23Department of Computational Medicine and Bioinformatics, University of Michigan
24Department of Biological Chemistry, University of Michigan, Ann Arbor, MI,USA 25Achira Labs, Bangalore, India
26Institute for Research in Biomedicine (IRB Barcelona)
27Instituci´o Catalana de Recerca i Estudis Avan¸cats (ICREA), Barcelona,Spain 28INB Coordination Unit, Life Sciences Department, Barcelona Supercomputing Center
29(former) INB GN2, Structural and Computational Biology Programme, Spanish National Cancer Research Centre, Barcelona, Catalonia,Spain
30Laboratory for Bioinformatics and Computational Chemistry, Institute of Nuclear Sciences VINCA, University of Belgrade, Belgrade, Serbia
31Laboratory for Bionformatics and Computational Chemistry, Institute of Nuclear Sciences VINCA, University of Belgrade, Belgrade, Serbia
32Molecular Cell Biomechanics Laboratory, Departments of Bioengineering, University of California Berkeley 33Computational Biology of Infection Research, Helmholtz Centre for Infection Research, Berkeley, CA, USA
34Departments of Bioengineering and Mechanical Engineering, Berkeley, CA, USA
35Bologna Biocomputing Group, Department of Pharmacy and Biotechnology, University of Bologna, Italy 36National Research Council, IBIOM, Bologna,Italy
37Bologna Biocomputing Group, Department of Pharmacy and Biotechnology, University of Bologna, Italy, Bologna, Italy 38University of Bonn: INRES Crop Bioinformatics, Bonn, North Rhine-Westphalia, Germany
39Gianforte School of Computing, Montana State University, Bozeman, Montana, USA 40University of Bristol, Computer Science, Bristol, Bristol, United Kingdom 41Computational Biology of Infection Research, Helmholtz Centre for Infection Research
42RESIST, DFG Cluster of Excellence 2155, Brunswick,Germany
43Interuniversity Institute of Bioinformatics in Brussels, Universite libre de Bruxelles - Vrije Universiteit Brussel 44Machine Learning Group, Artificial Intelligence lab, Vrije Universiteit Brussel, Brussels,Belgium 45European Molecular Biology Laboratory, European Bioinformatics Institute (EMBL-EBI), Cambridge, UK
46MRC Laboratory of Molecular Biology, Cambridge, United Kingdom 47University of Kent, School of Computing, Canterbury, United Kingdom 48School of Biosciences, University of Kent, Canterbury, United Kingdom 49School of Biosciences, University of Kent, Canterbury, Kent, United Kingdom
50University of Missouri, Computer Science, Columbia, Missouri, USA
51Department of Electrical Engineering and Computer Science, University of Missouri, Columbia, Missouri, USA 52University of Miami, Coral Gables, Florida, USA
53Centre for Systems and Synthetic Biology, Department of Computer Science, Royal Holloway, University of London, Egham, Surrey, United Kingdom
54Centre for Systems and Synthetic Biology, Department of Computer Science, Royal Holloway, University of London, Egham, United Kingdom
55School of Mathematics, Statistics and Applied Mathematics. National University of Ireland, Galway , Galway, Ireland 56Department of Informatics, Bioinformatics & Computational Biology, Technical University of Munich, Germany, Munich,
Germany
57School of Computing Sciences and Computer Engineering, University of Southern Mississippi, Hattiesburg, Mississippi, USA
58Institute of Biotechnology, University of Helsinki, Helsinki, Finland 59Compugen Ltd., Holon, Israel
60Baylor College of Medicine, Department of Biochemistry and Molecular Biology, Houston, TX, USA 61Baylor College of Medicine, Department of Molecular and Human Genetics, Houston, TX, USA
62National TsingHua University, Hsinchu, Taiwan
63Department of Electrical Engineering in National Tsing Hua University, Hsinchu City, Taiwan 64The Hebrew University of Jerusalem , Jerusalem, Israel
65University of California San Diego, San Diego Supercomputer Center, La Jolla, California, USA 66Department of Computational Biology and Center for Integrative Genomics, University of Lausanne, Switzerland 67Department of Genetics, Evolution & Environment, and Department of Computer Science, University College London,
UK, Lausanne, Switzerland
68Department of Knowledge Technologies, Jozef Stefan Institute, Ljubljana, Slovenia 69Jozef Stefan Institute
70Jozef Stefan International Postgraduate School, Ljubljana,Slovenia
71Research Dept.of Structural and Molecular Biology, University College London, London, England 72Research Dept.of Structural and Molecular Biology, University College London, London, United Kingdom
73Research Dept.of Structural and Molecular Biology, University College London 74Oxford Brookes University, Department of Health and Life Sciences, Oxford,UK
75University College London, Department of Computer Science
76The Francis Crick Institute, Biomedical Data Science Laboratory, London,United Kingdom
77Department of Genetics, Evolution and Environment, University College London, Gower Street, London, WC1E 6BT, United Kingdom
78SIB Swiss Institute of Bioinformatics, 1015 Lausanne, Switzerland, London,United Kingdom
79Cardiovascular Proteomics Laboratory, Centro Nacional de Investigaciones Cardiovasculares Carlos III (CNIC), Madrid, Spain
80Bioinformatics Unit, Spanish National Cancer Research Centre (CNIO), Madrid, Spain 81Universit`a degli Studi di Milano - Computer Science Dept. - AnacletoLab, Milan, Milan, Italy
82Institut de Biologie Computationnelle, LIRMM, CNRS-UMR 5506, Universit´e de Montpellier, Montpellier, France 83Department of Informatics, Chair of Bioinformatics and Computational Biology, Technical University of Munich,
Germany, Munich, Germany
84University of Lorraine, CNRS, Inria, LORIA, 54000 Nancy, France, Nancy, France 85University of Lorraine, CNRS, Inria, LORIA, 54000 Nancy, France
86University of Lorraine, Nancy, Lorraine,France 87Inria, Nancy,France
88Department of Biology, New York University, New York, NY, USA 89NYU Center for Data Science, New York NY 10010 90Flatiron Institute, CCB, NY NY 10010, New York, NY,USA
91Center for Computational Biology (CCB), Flatiron Institute, Simons Foundation, New York, NY, USA 92Center for Data Science, New York University, New York, NY 10011, USA, New York, NY, USA
93Wellcome Centre for Human Genetics, University of Oxford, Oxford, UK 94University of Padova, Department of Molecular Medicine, Padova, Italy
95Dept. of Biology - University of Padova, Padova, Italy 96Department of Biomedical Sciences, University of Padua
97CNR Institute of Neuroscience, Padova,Italy
98Department of Biomedical Sciences, University of Padua, Padova, Padova, Italy 99Department of Biomedical Sciences, University of Padua, Padua, Italy
100Department of Computer Science, National University of Computer and Emerging Sciences, Peshawar, Pakistan., Peshawar, Khyber Pakhtoonkhwa, Pakistan
101Temple University
102University of California, Riverside, Philadelphia, PA,USA 103Temple University, Philadelphia, PA, USA
104Temple University, Department of Computer and Information Sciences, Philadelphia, PA, USA 105Department of Biology, Brigham Young University
106Bioinformatics Research Group, Provo, UT,USA
107School of Biological Sciences, University of Reading, Reading, England, United Kingdom 108Department of Bioengineering and Therapeutic Sciences, University of California, San Francisco 109Department of Pharmaceutical Chemistry, University of California, San Francisco, San Francisco, CA,USA 110UC Berkeley - UCSF Graduate Program in Bioengineering, University of California, San Francisco, CA 94158, USA 111Department of Bioengineering and Therapeutic Sciences, University of California, San Francisco, CA 94158, USA, San
Francisco, California,USA
112Research and Innovation Center, Edmund Mach Foundation, 38010S. Michele all’Adige, Italy, San Michele all’Adige, Italy 113State Key Laboratory of Genetic Engineering and Collaborative Innovation Center for Genetics and Development, School
of Life Sciences, Fudan University
114Department of Pediatrics, Brain Tumor Center, Division of Experimental Hematology and Cancer Biology, Shanghai, Shanghai,China
115School of Computer Science and Shanghai Key Lab of Intelligent Information Processing, Fudan University, Shanghai, China
116School of Computer Science and Shanghai Key Lab of Intelligent Information Processing, Fudan University, ShangHai, China
117School of Computer Science and Shanghai Key Lab of Intelligent Information Processing, Fudan University, Shanghai, Shanghai, China
118Pacific Lutheran University, Department of Computer Science, Tacoma, WA, USA 119Department of Computer Science, National Chengchi University, Taipei, Taiwan
120Okinawa Institute of Science and Technology, Tancha, Okinawa, Japan 121Tel Aviv University, Tel Aviv, Israel
122Computer, Electrical and Mathematical Sciences & Engineering Division, Computational Bioscience Research Center, King Abdullah University of Science and Technology, Thuwal, Saudi Arabia
123King Abdullah University of Science and Technology, Computational Bioscience Research Center, Thuwal, Jeddah, Saudi Arabia
124Computational Bioscience Research Center (CBRC), King Abdullah University of Science and Technology, Thuwal, Saudi Arabia
125Computer, Electrical and Mathematical Sciences Engineering Division (CEMSE), King Abdullah University of Science and Technology, Thuwal, Saudi Arabia, Thuwal,Saudi Arabia
126Politecnico di Torino, Control and Computer Engineering Department, Torino, TO, Italy 127University of Turku, Department of Future Technologies, Turku NLP Group
128University of Turku Graduate School (UTUGS), Turku,Finland 129University of Turku, Turku,Finland
130Turku Centre for Computer Science (TUCS)
131University of Turku, Department of Future Technologies, Turku,Finland
132Department of Future Technologies, Faculty of Science and Engineering, University of Turku, FI-20014, Turku, Finland 133Turku Centre for Computer Science (TUCS), Agora, Vesilinnantie 3, FI-20500 TURKU, Turku,Finland 134University of Turku, Faculty of Science and Engineering, Department of Future Technologies, Turku, Finland
135University of Turku, Department of Future Technologies, Turku, Finland
136Department of Biological Sciences, Department of Computer Science, Purdue University, West Lafayette, IN, 47907, USA 137Department of Pediatrics, University of Cincinnati, Cincinnati, OH, 45229, USA, West Lafayette, IN, USA
138Department of Computer Science, Purdue University, West Lafayette, IN, USA 139Division of Electronics, Rudjer Boskovic Institute, Zagreb, Croatia
140Department of Computer Science, ETH Zurich 141SIB Swiss Institute of Bioinformatics, Zurich,Switzerland
142Department of Computer Science, Colorado State University, Fort Collins, CO, USA 143Department of Informatics, Technical University of Munich, Germany
144Institute for Food and Plant Sciences WZW, Technical University of Munich, Weihenstephan, Germany, Munich,Germany 145University of California, Berkeley, Berkeley, CA, USA
146Biological Sciences, University of Illinois at Chicago, Chicago, Illinois, USA
147Department of Microbiology and Immunology, Geisel School of Medicine at Dartmouth, Hanover, NH, US 148Department of Systems Pharmacology and Translational Therapeutics, Perelman School of Medicine, University of
Pennsylvania
149Childhood Cancer Data Lab, Alex’s Lemonade Stand Foundation, Philadelphia, Pennsylvania,USA 150Khoury College of Computer Sciences, Northeastern University , Boston, MA, USA
Abstract
The Critical Assessment of Functional Annotation (CAFA) is an ongoing, global, community-driven effort to evaluate and improve the computational annotation of protein function. Here we report on the results of the third CAFA challenge, CAFA3, that featured an expanded analysis over the previous CAFA rounds, both in terms of volume of data analyzed and the types of analysis performed. In a novel and major new development, computational predictions and assessment goals drove some of the experimental assays, resulting in new functional annotations for more than 1000 genes. Specifically, we performed experimental whole-genome mutation screening inCandida albicansandPseudomonas auregi-nosagenomes, which provided us with genome-wide experimental data for genes associated with biofilm formation and motility (P. aureginosaonly). We further performed targeted assays on selected genes in Drosophila melanogaster, which we suspected of being involved in long-term memory. We conclude that, while predictions of the molecular function and biological process annotations have slightly improved over time, those of the cellular component have not. Term-centric prediction of experimental annota-tions remains equally challenging; although the performance of the top methods is significantly better than expectations set by baseline methods in C. albicans and D. melanogaster, it leaves considerable room and need for improvement. We finally report that the CAFA community now involves a broad range of participants with expertise in bioinformatics, biological experimentation, biocuration, and bio-ontologies, working together to improve functional annotation, computational function prediction, and our ability to manage big data in the era of large experimental screens.
1
Introduction
1
High-throughput nucleic acid sequencing (1) and mass-spectrometry proteomics (2) have provided us with 2
a deluge of data for DNA, RNA, and proteins in diverse species. However, extracting detailed functional 3
information from such data remains one of the recalcitrant challenges in the life sciences and biomedicine. 4
Low-throughput biological experiments often provide highly informative empirical data related to various 5
functional aspects of a gene product, but these experiments are limited by time and cost. At the same time, 6
high-throughput experiments, while providing large amounts of data, often provide information that is not 7
specific enough to be useful (3). For these reasons, it is important to explore computational strategies for 8
transferring functional information from the group of functionally characterized macromolecules to others 9
that have not been studied for particular activities (4, 5, 6, 7, 8, 9). 10
To address the growing gap between high-throughput data and deep biological insight, a variety of 11
computational methods that predict protein function have been developed over the years (10, 11, 12, 13, 14, 12
15, 16, 17, 18, 19, 20, 21, 22, 23, 24). This explosion in the number of methods is accompanied by the need 13
to understand how well they perform, and what improvements are needed to satisfy the needs of the life 14
sciences community. The Critical Assessment of Functional Annotation (CAFA) is a community challenge 15
that seeks to bridge the gap between the ever-expanding pool of molecular data and the limited resources 16
available to understand protein function (25, 26, 27). 17
The first two CAFA challenges were carried out in 2010-2011 (25) and 2013-2014 (26). In CAFA1 we 18
adopted a time-delayed evaluation method, where protein sequences that lacked experimentally verified 19
annotations, ortargets, were released for prediction. After the submission deadline for predictions, a subset 20
of these targets accumulated experimental annotations over time, either as a consequence of new publications 21
about these proteins or the biocuration work updating the annotation databases. The members of this set of 22
proteins were used asbenchmarks for evaluating the participating computational methods, as the function 23
was revealed only after the prediction deadline. 24
CAFA2 expanded the challenge founded in CAFA1. The expansion included the number of ontologies 25
used for predictions, the number of target and benchmark proteins, and the introduction of new assessment 26
metrics that mitigate the problems with functional similarity calculation over concept hierarchies such as 27
Gene Ontology (28). Importantly, we provided evidence that the top-scoring methods in CAFA2 outper-28
formed the top scoring methods in CAFA1, highlighting that methods participating in CAFA improved over 29
the three year period. Much of this improvement came as a consequence of novel methodologies with some 30
effect of the expanded annotation databases (26). Both CAFA1 and CAFA2 have shown that computa-31
tional methods designed to perform function prediction outperform a conventional function transfer through 32
sequence similarity (25, 26). 33
In CAFA3 (2016-2017) we continued with all types of evaluations from the first two challenges and 34
additionally performed experimental screens to identify genes associated with specific functions. This allowed 35
us to provide unbiased evaluation of the term-centric performance based on a unique set of benchmarks 36
obtained by assaying Candida albicans, Pseudomonas aeruginosa and Drosophila melanogaster. We also 37
held a challenge following CAFA3, dubbed CAFA-π, to provide the participating teams another opportunity 38
to develop or modify prediction models. The genome-wide screens on C. albicans identified 240 genes 39
previously not known to be involved in biofilm formation, whereas the screens onP. aeruginosa identified 40
532 new genes involved in biofilm formation and 403 genes involved in motility. Finally, we used CAFA 41
predictions to select genes from D. melanogaster and assay them for long-term memory involvement. This 42
experiment allowed us to both evaluate prediction methods and identify eleven new fly genes involved in this 43
biological process (29). Here we present the outcomes of the CAFA3 challenge, as well as the accompanying 44
challenge CAFA-π, and discusses further directions for the community interested in the function of biological 45
macromolecules. 46
2
Results
47
2.1
Top methods have slightly improved since CAFA2
48
One of CAFA’s major goals is to quantify the progress in function prediction over time. We therefore 49
conducted comparative evaluation of top CAFA1, CAFA2, and CAFA3 methods according to their ability 50
to predict Gene Ontology (28) terms on a set of common benchmark proteins. This benchmark set was 51
created as an intersection of CAFA3 benchmarks (proteins that gained experimental annotation after the 52
CAFA3 prediction submission deadline), and CAFA1 and CAFA2 target proteins. Overall, this set contained 53
377 protein sequences with annotations in the Molecular Function Ontology (MFO), 717 sequences in the 54
Biological Process Ontology (BPO) and 548 sequences in the Cellular Component Ontology (CCO), which 55
allowed for a direct comparison of all methods that have participated in the challenges so far. The head-56
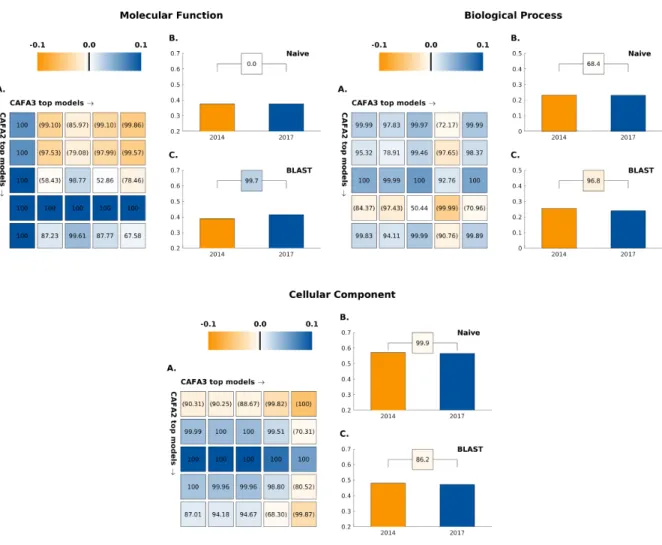
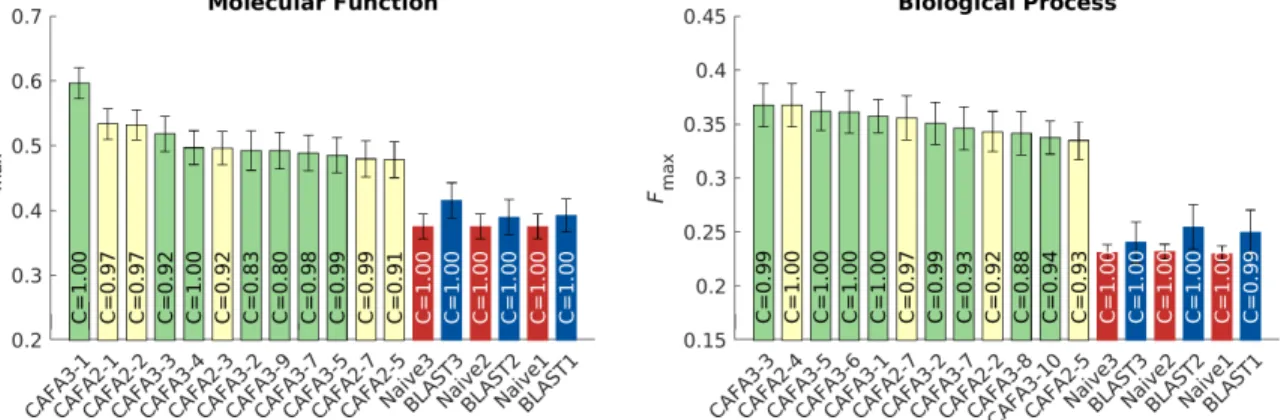
to-head comparisons in MFO, BPO, and CCO between top five CAFA3 and CAFA2 methods are shown in 57
Figure 1. CAFA3 and CAFA1 comparisons are shown in Figure S1 in the Supplemental Materials. 58
We first observe that, in effect, the performance of baseline methods (25, 26) has not improved since 59
CAFA2. The Na¨ıve method, which uses the term frequency in the existing annotation database as prediction 60
score for every input protein, has the sameFmaxperformance using both annotation database in 2014 (when
61
CAFA2 was held) and in 2017 (when CAFA3 was held), which suggests little change in term frequencies in the 62
annotation database since 2014. On the other hand, BLAST-based annotation transfer, tells a contrasting 63
tale between ontologies. In MFO, the BLAST method based on the existing annotations in 2017 is slightly 64
but significantly better than the BLAST method based on 2014 training data. In BPO and CCO, however, 65
the BLAST based on the later database has not outperformed its earlier counterpart, although the changes 66
in effect size (absolute change inFmax) in both ontologies are small.
67
When surveying all three CAFA challenges, the performance of both baseline methods has been relatively 68
stable, with some fluctuations of BLAST. Such performance of direct sequence-based function transfer is 69
surprising, given the steady growth of annotations in UniProt-GOA (30); i.e., there were 259,785 experimental 70
annotations in 2011, 341,938 in 2014 and 434,973 in 2017, but there does not seem to be a definitive trend 71
with the BLAST method, as they go up and down in Fmax across ontologies. We conclude from these
72
observations on the baseline methods that first, the ontologies are in different annotation states and should 73
not be treated as a whole. Second, methods that perform direct function transfer based on sequence similarity 74
do not necessarily benefit from a larger training dataset. Although the performance observed in our work is 75
also dependent on the benchmark set, it appears that the annotation databases remain sparsely populated to 76
effectively exploit function transfer by sequence similarity, thus justifying the need for advanced methodology 77
development for this problem. 78
[Figure 1 about here.] 79
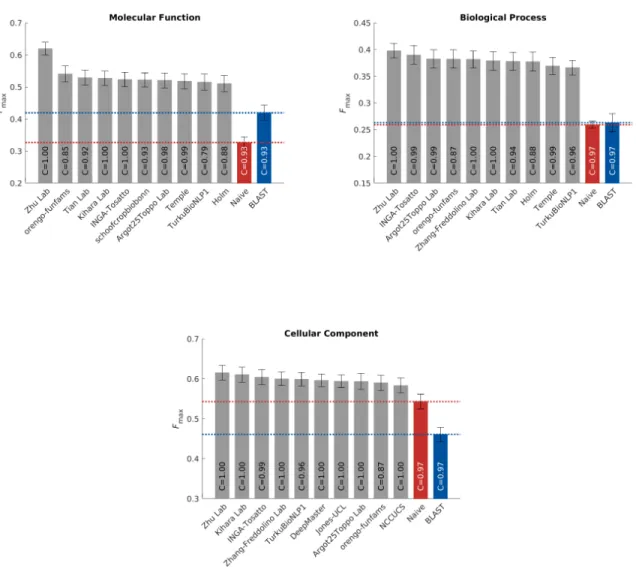
Head-to-head comparisons of the top five CAFA3 methods against top five CAFA2 methods show mixed 80
results. In MFO, the top CAFA3 method, GOLabeler (23) outperformed all CAFA2 methods by a consid-81
erable margin, as shown in Figure 2. The rest of the four CAFA3 top methods did not perform as well as 82
the top two methods of CAFA2, although only to a limited extent, with little change inFmax. Of the top 12
83
methods ranked in MFO, seven are from CAFA3, five are from CAFA2 and none are from CAFA1. Despite 84
the increase in database size, the majority of function prediction methods do not seem to have improved 85
in predicting protein function in MFO since 2014, except for one method that stood out. In BPO, the top 86
three methods in CAFA3 outperformed their CAFA2 counterparts, but with very small margins. Out of the 87
top 12 methods in BPO, eight are from CAFA3, four are from CAFA2 and none are from CAFA1. Finally, 88
in CCO, although 8 out of top 12 methods over all CAFA challenges come from CAFA3, the top method is 89
from CAFA2. The differences between the top performing methods are small, as in the case of BPO. 90
The performance of top methods in CAFA2 was significantly better than of those in CAFA1, and it is 91
interesting to note that this trend has not continued in CAFA3. This could be due to many reasons, such as 92
the quality of the benchmark sets, the overall quality of the annotation database, the quality of ontologies 93
or a relatively short period of time between challenges. 94
[Figure 2 about here.] 95
2.2
Protein-centric evaluation
96
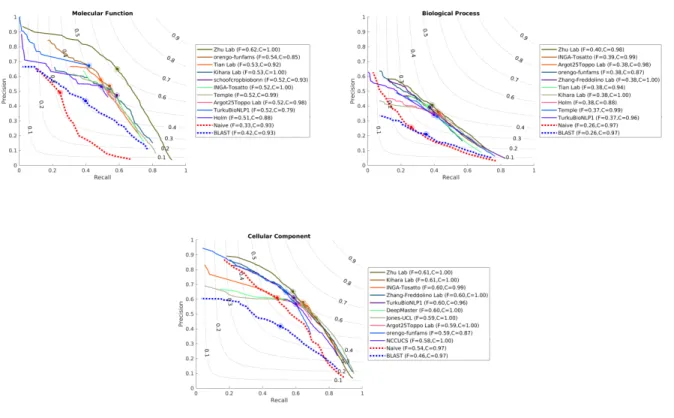
Theprotein-centric evaluation measures the accuracy of assigning GO terms to a protein. This performance 97
is shown in Figures 3, 4 and 5. 98
[Figure 3 about here.] 99
[Figure 4 about here.] 100
[Figure 5 about here.] 101
We observe that all top methods outperform the baselines with the patterns of performance consistent 102
with CAFA1 and CAFA2 findings. Predictions of MFO terms achieved the highest Fmax compared with
103
predictions in the other two ontologies. BLAST outperforms Na¨ıve in predictions in MFO, but not in BPO 104
or CCO. This is because sequence similarity based methods such as BLAST tend to perform best when 105
transferring basic biochemical annotations such as enzymatic activity. Functions in biological process, such 106
as pathways, may not be as preserved by sequence similarity, hence the poor BLAST performance in BPO. 107
The reasons behind the difference among the three ontologies include the structure and complexity of the 108
ontology as well as the state of the annotation database, as discussed previously (26, 31). It is less clear why 109
the performance in CCO is weak, although it might be hypothesized that such performance is related to the 110
structure of the ontology itself (31). 111
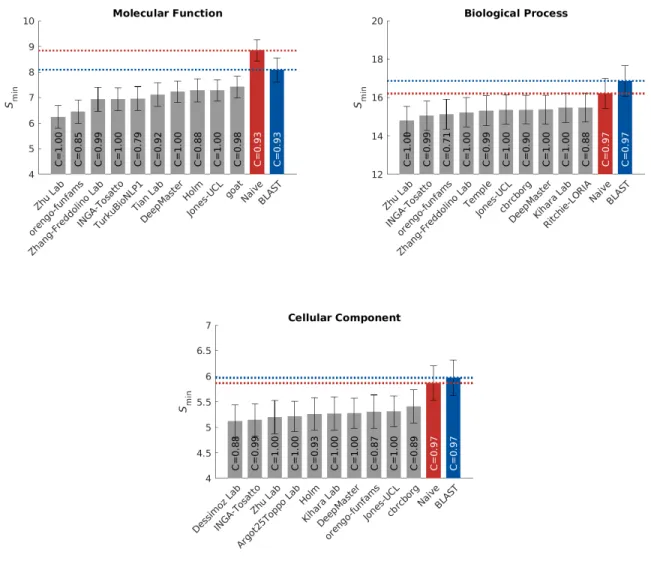
The top performing method in MFO did not have as high an advantage over others when evaluated 112
using the Smin metric. The Smin metric weights GO terms by conditional information content, since the
113
prediction of more informative terms are more desirable than less informative, more general, terms. This 114
could potentially explain the smaller gap between the top predictor and the rest of the pack inSmin. The
115
weightedFmax and normalizedSmin evaluations can be found in Figures S4 and S5.
116
2.3
Species-specific categories
117
The benchmarks in each species were evaluated individually as long as there were at least 15 proteins per 118
species. Here we present results on both eukaryotic and prokaryotic species (Figure 6). We observed that 119
different methods could perform differently on different species. As shown in Figure 14, bacterial proteins 120
make up a small portion of all benchmark sequences, so their effects on the performances of the methods 121
are often masked. Species-specific analyses are thus meaningful to researchers studying certain organisms. 122
Evaluation results on individual species including human (Figure S6),Arabidopsis thaliana (Figure S7) and 123
Escherichia coli (Figure S10) can be found in Supplemental Materials (Figures S6-S14). 124
[Figure 6 about here.] 125
2.4
Diversity of methods
126
It was suggested in the analysis of CAFA2 that ensemble methods that integrate data from different sources 127
have the potential of improving prediction accuracy (32). Multiple data sources, including sequence, struc-128
ture, expression profile and so on are all potentially predictive of the function of the protein. Therefore, 129
methods that take advantage of these rich sources as well as existing techniques from other research groups 130
might see improved performance. Indeed, the one method that stood out from the rest in CAFA3 and per-131
formed significantly better than all methods across three challenges, is a machine learning based ensemble 132
method (23). Therefore, it is important to analyze what information sources and prediction algorithms are 133
better at predicting function. Moreover, the similarity of the methods might explain the limited improvement 134
in the rest of the methods in CAFA3. 135
[Figure 7 about here.] 136
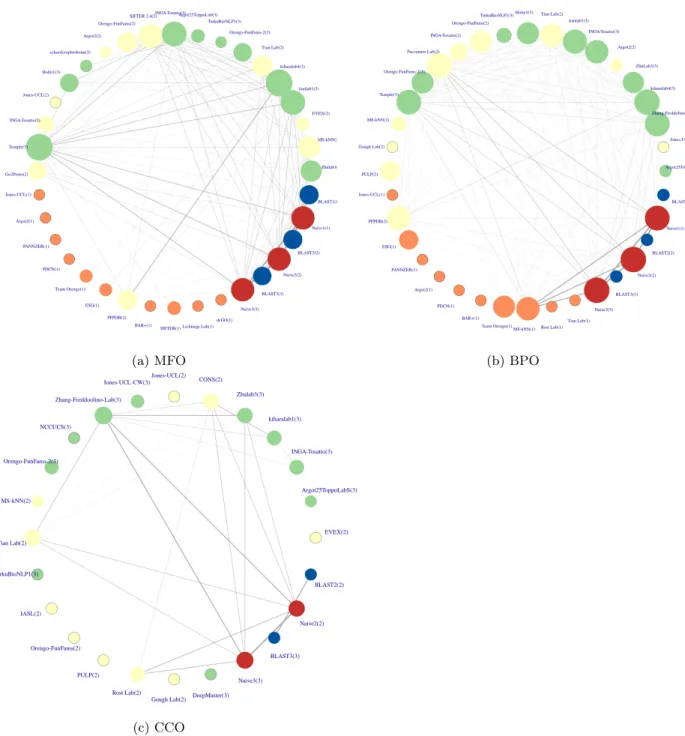
The top CAFA2 and CAFA3 methods are very similar in performance, but that could be a result of ag-137
gregating predictions of different proteins to one metric. When computing the similarity of each pair of 138
methods as the reciprocal of the Euclidean distance of prediction scores (Figure 7), we are not interested 139
whether these predictions are correct according to the benchmarks, but simply whether they are similar to 140
one another. Top CAFA2 and CAFA3 methods are more similar than with CAFA1 models. It is clear that 141
some top methods are heavily based on the Na¨ıve and BLAST baseline methods. It is interesting to note 142
that the top two best methods in BPO are not similar to any other top methods. The same pattern was 143
observed for CAFA2 methods. 144
[Figure 8 about here.] 145
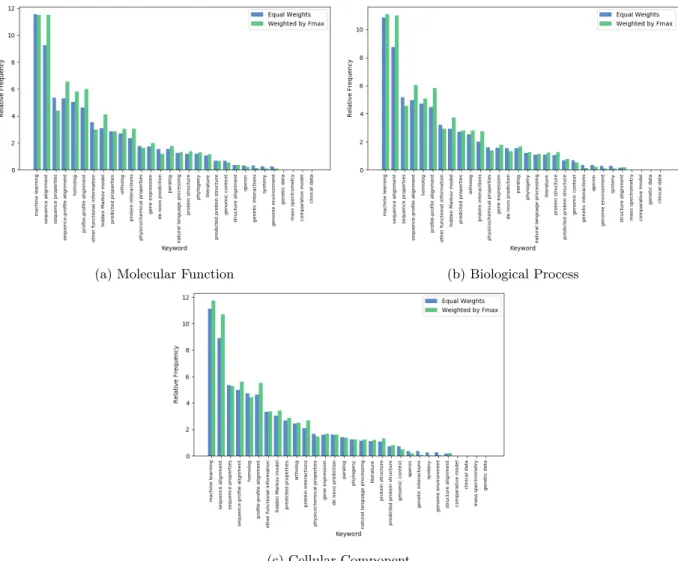
Participating teams also provided keywords that describe their approach to function prediction with their 146
submissions. A list of keywords was given to the participants, listed in Page 24 of Supplementary Materials. 147
Figure 8 shows the frequency of each keyword. In addition, we have weighted the frequency of the keywords 148
with the prediction accuracy of the specific method. Machine learning and sequence alignment remain 149
the most-used approach by scientists predicting in all three ontologies. By raw count, machine learning is 150
more popular than sequence alignment, but once adjusted by performance, they are almost identical. This 151
indicates that methods that use sequence alignments are more helpful in predicting the correct function than 152
the popularity of their use suggests. 153
2.5
Evaluation via molecular screening
154
Databases with proteins annotated by biocuration, such as UniProt knowledge base, have been the primary 155
source of benchmarks in the CAFA challenges. New to CAFA3, we also evaluated the extent to which methods 156
participating in CAFA could predict the results of genetic screens in model organisms done specifically for this 157
project. Predicting GO terms for a protein (protein-centric) and predicting which proteins are associated 158
with a given function (term-centric) are related but different computational problems: the former is a 159
multi-label classification problem with a structured output, while the latter is a binary classification task. 160
Predicting the results of a genome-wide screen for a single or a small number of functions fits the term-centric 161
formulation. To see how well all participating CAFA methods perform term-centric predictions, we mapped 162
results from the protein-centric CAFA3 methods onto these terms. In addition we held a separate CAFA 163
challenge, CAFA-πwhose purpose was to attract additional submissions from algorithms that specialize in 164
term-centric tasks. 165
We performed screens for three functions in three species, which we then used to assess protein function 166
prediction. In the bacterium Pseudomonas aeruginosa and the fungus Candida albicans we performed 167
genome-wide screens capable of uncovering genes with two functions, biofilm formation (GO:0042710) and 168
motility (for P. aeruginosa only) (GO:0001539), as described in Methods. In Drosophila melanogaster we 169
performed targeted assays, guided by previous CAFA submissions, of a selected set of genes and assessed 170
whether or not they affected long-term memory (GO:0007616). 171
We discuss the prediction results for each function below in detail. The performance, as assessed by the 172
genome-wide screens, was generally lower than in the protein-centric evaluations that were curation driven. 173
We hypothesize that it may simply be more difficult to perform term-centric prediction for broad activities 174
such as biofilm formation and motility. For P. aeruginosa, an existing compendium of gene expression 175
data was already available (33). We used the Pearson correlation over this collection of data to provide 176
a complementary baseline to the standard BLAST approach used throughout CAFA. We found that an 177
expression-based method outperformed the CAFA participants, suggesting that success on certain term-178
centric challenges will require the use of different types of data. On the other hand, the performance of the 179
methods in predicting long-term memory in the Drosophila genome was relatively accurate. 180
2.5.1 Biofilm formation 181
In March 2018, there were 3019 annotations to biofilm formation (GO:0042710) and its descendent terms 182
across all species, of which 325 used experimental evidence codes. These experimentally annotated proteins 183
included 131 from the Candida Genome Database (34) for C. albicans and 29 for P. aeruginosa, the two 184
organisms that we screened. 185
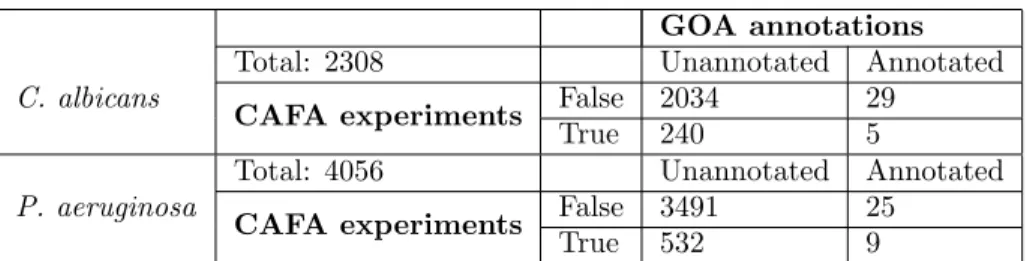
Of the 2746 genes we screened in the Candida albicans colony biofilm assay, 245 were required for the 186
formation of wrinkled colony biofilm formation (Table 1). Of these, only five were already annotated in 187
UniProt: MOB,EED1 (DEF1), andYAK1, which encode proteins involved in hyphal growth, an important 188
trait for biofilm formation (35, 36, 37, 38). Also, NUP85, a nuclear pore protein involved in early phase 189
arrest of biofilm formation (39) andVPS1, which contributes to protease secretion, filamentation, and biofilm 190
formation (40). Of the 2063 proteins that we did not find to be associated with biofilm formation, 29 were 191
annotated to the term in the GOA database. Some of the proteins in this category highlight the need for 192
additional information to GO term annotation. For example, Wor1 and the pheromone receptor are key 193
for biofilm formation in strains under conditions in which the mating pheromone is produced (41), but not 194
required in the monocultures of the commonly studied a/αmating type strain used here. 195
No method in CAFA-πor CAFA3 (not shown) exceeded an AUC of 0.60 on this term-centric challenge 196
(Figure 9) for either species. Performance for the best methods slightly exceeded a BLAST-based baselines. 197
In the past, we have found that predicting BPO terms, such as biofilm formation, resulted in poorer method 198
performance than predicting MFO terms. Many CAFA methods use sequence alignment as their primary 199
GOA annotations
C. albicans
Total: 2308 Unannotated Annotated
CAFA experiments False 2034 29
True 240 5
P. aeruginosa
Total: 4056 Unannotated Annotated
CAFA experiments False 3491 25
True 532 9
Table 1: Number of proteins in Candida albicans and Pseudomonas aeruginosa associated with function Biofilm formation (GO:0042710) in the GOA databases versus experimental results.
source of information (Section 2.4). For Pseudomonas aeruginosa a pre-built expression compendium was 200
available from prior work (33). Where the compendium was available, simple gene-expression based baselines 201
were the best performing approaches. This suggests that successful term-centric prediction of biological 202
processes may need to rely more heavily on information that is not sequence-based, and, as previously 203
reported, may require methods that use broad collections of gene expression data (42, 43). 204
[Figure 9 about here.] 205
2.5.2 Motility 206
In March 2018 there were 302,121 annotations for proteins with the GO term: cilium or flagellum-dependent 207
cell motility (GO:0001539) and its descendent terms, which included cell motility in all eukaryotic (GO:0060285), 208
bacterial (GO:0071973) and archael (GO:0097590) organisms. Of these, 187 had experimental evidence codes 209
and the most common organism to have annotations wasP. aeruginosa, on which our screen was performed 210
(Table S2). 211
As expected, mutants defective in the flagellum or its motor were defective in motility (fliC and other 212
fli andflg genes). For some of the genes that were expected, but not detected, the annotation was based 213
on experiments performed in a medium different from what was used in these assays. For example, PhoB 214
regulates motility but only when phosphate concentration is low (44). Among the genes that were scored 215
as defective in motility, some are known to have decreased motility due to over production of carbohydrate 216
matrix material (bifA) (45), or the absence of directional swimming due to absence of chemotaxis functions 217
(e.g., cheW,cheA) and others likely showed this phenotype because of a medium specific requirement such 218
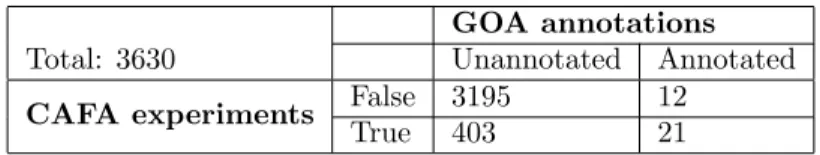
as biotin (bioA,bioC, andbioD) (46). Table 2 shows the contingency table for number of proteins that are 219
GOA annotations
Total: 3630 Unannotated Annotated
CAFA experiments False 3195 12
True 403 21
Table 2: Number of proteins inPseudomonas aeruginosa associated with function Motility (GO:0001539) in the GOA databases versus experimental results.
detected by our experiment versus GOA annotations. 220
The results from this evaluation were consistent with what we observed for biofilm formation. Many 221
of the genes annotated as being involved in biofilm formation were identified in the screen. Others that 222
were annotated as being involved in biofilm formation did not show up in the screen because the strain 223
background used here, strain PA14, uses the exoploysaccharide matrix carbohydrate Pel (47) in contrast to 224
the Psl carbohydrate used by another well characterized strain, strain PAO1 (48, 49). Thepsl genes were 225
known to be dispensable for biofilm formation in the strain PA14 background and this nuance highlights the 226
need for more information to be taken into account when making predictions. 227
The CAFA-π methods outperformed our BLAST-based baselines but failed to outperform expression-228
based baselines. Transferred methods from CAFA3 also did not outperform these baselines. It is important to 229
note this consistency across terms, reinforcing the finding that term-centric prediction of biological processes 230
is likely to require non-sequence information to be included. 231
[Figure 10 about here.] 232
2.5.3 Long-term memory inD. melanogaster 233
Prior to our experiments, there were 1901 annotations made in long-term memory, including 283 experimental 234
annotations. Drosophila melanogaster had the most annotated proteins of long-term memory with 217, while 235
human has 7, as shown in Table S3. 236
We performed RNAi experiments in Drosophila melanogaster to assess whether 29 target genes were 237
associated with long-term memory (GO:0007616); for details on target selection, see (29). None of the 238
29 genes had an existing annotation in the GOA database. Because no genome-wide screen results were 239
available, we did not release this as part of CAFA-πand instead relied only on the transfer of methods that 240
predicted “long-term memory” at least once inD. melanogaster from CAFA3. Results from this assessment 241
were more promising than our findings from the genome-wide screens in microbes (Figure 11). Certain 242
methods performed well, substantially exceeding the baselines. 243
[Figure 11 about here.] 244
2.6
Participation Growth
245
The CAFA challenge has seen growth in participation, as shown in Figure 12. To cope with the increasingly 246
large data size, CAFA3 utilized the Synapse (50) online platform for submission. Synapse allowed for easier 247
access for participants, as well as easier data collection for the organizers. The results were also released to 248
the individual teams via this online platform. During the submission process, the online platform also allows 249
for customized format checkers to ensure the quality of the submission. 250
[Figure 12 about here.] 251
3
Methods
252
3.1
Benchmark collection
253
In CAFA3, we adopted the same benchmark generation methods as CAFA1 and CAFA2, with a similar time-254
line (Figure 13). The crux of a time-delayed challenge is the annotation growth period between timet0 and
255
t1. All target proteins that have gained experimental annotation during this period are taken as benchmarks
256
in all three ontologies. “No-knowledge” (NK, no prior experimental annotations) and “Limited-knowledge” 257
(LK, partial prior experimental annotations) benchmarks were also distinguished based on whether the 258
newly-gained experimental annotation is in an ontology that already have experimental annotations or not. 259
Evaluation results in Figures 3, 4, and 5 are made using the No-knowledge benchmarks. Evaluation results 260
on the Limited-knowledge benchmarks are shown in Figure S3 in the Supplemental Materials. For more 261
information regarding NK and LK designations, please refer to the Supplemental Materials and the CAFA2 262
paper (26). 263
[Figure 13 about here.] 264
After collecting these benchmarks, we performed two major deletions from the benchmark data. Upon 265
inspecting the taxonomic distribution of the benchmarks, we noticed a large number of new experimental 266
annotations fromCandida albicans. After consulting with UniProt-GOA, we determined these annotations 267
have already existed in the Candida Genome Database long before 2018, but were only recently migrated to 268
GOA. Since these annotations were already in the public domain before the CAFA3 submission deadline, we 269
have deleted any annotation fromCandida albicans with an assigned date prior to our CAFA3 submission 270
deadline. Another major change is the deletion of any proteins with only a protein-binding (GO:0005515) 271
annotation. Protein-binding is a highly generalized function description, does not provide more specific 272
information about the actual function of a protein, and in many cases may indicate a functional, non-273
specific binding. If it is the only annotation that a protein has gained, then it is hardly an advance in our 274
understanding of that protein, therefore we deleted these annotations from our benchmark set. Annotations 275
with a depth of 3 make up almost half of all annotations in MFO before the removal (Figure S15b). After 276
the removal, the most frequent annotations became of depth 5 (Figure S15a). In BPO, the most frequent 277
annotations are of depth 5 or more, indicating a healthy increase of specific GO terms being added to our 278
annotation database. In CCO, however, most new annotations in our benchmark set are of depth 3, 4 and 279
5 (Figure S15). This difference could partially explain why the same computational methods perform very 280
differently in different ontologies, and benchmark sets. We have also calculated total information content 281
per protein for the benchmark sets shown in Figure S16. Taxonomic distributions of the proteins in our final 282
benchmark set are shown in Figure 14. 283
[Figure 14 about here.] 284
Additional analyses were performed to assess the characteristics of the benchmark set, including the overall 285
information content of the terms being annotated. 286
3.2
Protein-centric evaluation
287
Two main evaluation metrics were used in CAFA3, theFmaxand theSmin. TheFmaxbased on the
precision-288
recall curve, while theSminis based the RU-MI curve. Mathematical definitions of these metrics are shown
289
in pages 22 and 23 of Supplemental Materials. The RU-MI curve (51) takes into account the information 290
content of each GO term in addition to counting the number of true positives, false positives, etc. See 291
Supplemental Materials for their mathematical definitions. The information theory based evaluation metrics 292
counters the high-throughput low-information annotations such as protein binding, but down-weighing these 293
terms according to their information content, as the ability to predict such non-specific functions are not as 294
desirable and useful and the ability to predict more specific functions. 295
The two assessment modes from CAFA2 were also used in CAFA3. In the partial mode, predictions were 296
evaluated only on those benchmarks for which a model made at least one prediction. The full evaluation 297
mode evaluates all benchmark proteins and methods were penalized for not making predictions. Evaluation 298
results in Figures 3, 4, and 5 are made using the full evaluation mode. Evaluation results using the partial 299
mode are shown in Figure S2 in the Supplemental Materials. 300
Two baseline models were also computed for these evaluations. The Na¨ıve method assigns the term 301
frequency as the prediction score for any protein, regardless of any protein-specific properties. BLAST 302
was based on results using the Basic Local Alignment Search Tool (BLAST) software against the training 303
database (52). A term will be predicted as the highest local alignment sequence identity among all BLAST 304
hits annotated from the training database. Both of these methods were trained on the experimentally 305
annotated proteins and their sequences in Swiss-Prot (53) at timet0.
306
3.3
Microbe screens
307
To assess matrix production, we used mutants from the PA14 NR collection (54). Mutants were transferred 308
from the -80°C freezer stock using a sterile 48-pin multiprong device into 200µl LB in a 96-well plate. The 309
cultures were incubated overnight at 37°C, and their OD600 was measured to assess growth. Mutants were 310
then transferred to tryptone agar with 15g of tryptone and 15g of agar in 1L amended with Congo red 311
(Aldrich, 860956) and Coomassie brilliant blue (J.T. Baker Chemical Co., F789-3). Plates were incubated 312
at 37°C overnight followed by four day incubation at room temperature on allow the wrinkly phenotype to 313
develop. Colonies were imaged and scored on Day 5. To assess motility, mutants were revived from freezer 314
stocks as described above. After overnight growth, a sterile 48-pin multiprong transfer device with a pin 315
diameter of 1.58 mm was used to stamp the mutants from the overnight plates into the center of swim 316
agar made with M63 medium with 0.2% glucose and casamino acids and 0.3% agar). Care was taken to 317
avoid touching the bottom of the plate. Swim plates were incubated at room temperature (19-22°C) for 318
approximately 17 hours before imaging and scoring. Experimental procedures inP. aeruginosa to determine 319
proteins that are associated with the two functions in CAFA-πare shown in Figure 15. 320
[Figure 15 about here.] 321
Biofilm formation in Candida albicans was assessed in single gene mutants from the Noble (55) and 322
GRACE (56) collections. In the Noble Collection, mutants of C. albicans have had both copies of the 323
candidate gene deleted. Most of the mutants were created in biological duplicate. From this collection, 324
1274 strains corresponding to 653 unique genes were screened. The GRACE collection provided mutants 325
with one copy of each gene deleted and the other copy placed under the control of a doxycycline-repressible 326
promoter. To assay these strains, we used medium supplemented with 100µg/ml doxycycline strains, when 327
rendered them functional null mutants. We screened 2348 mutants from the GRACE collection, 255 of 328
which overlapped with mutants in the Noble collection, for 2746 total unique mutants screened in total. To 329
assess defects in biofilm formation or biofilm-related traits, we performed two assays: (1) colony morphology 330
on agar medium and (2) biofilm formation on a plastic surface (Figure 16). For both of these assays we 331
used Spider medium, which was designed to induce hyphal growth inC. albicans (57), and which promotes 332
biofilm formation (39). Strains were first replicated from frozen 96 well plates to YPD agar plates. Strains 333
were then replicated from YPD agar to YPD broth, and grown overnight at 30°C. From YPD broth, strains 334
were introduced onto Spider agar plates and into 96 well plates of Spider broth. When strains from the 335
GRACE collection were assayed, 100µg/ml doxycycline was included in the agar and broth, and aluminium 336
foil was used to protect the media from light. Spider agar plates inoculated with C. albicans mutants 337
were incubated at 37°C for two days before colony morphologies were scored. Strains in Spider Broth were 338
shaken at 225 rpm at 37°C for three days, and then assayed for biofilm formation at the air-liquid interface 339
as follows. First, broth was removed by slowly tilting plates and pulling liquid away by running a gloved 340
hand over the surface. Biofilms were stained by adding 100µl of 0.1 percent crystal violet dye in water to 341
each well of the plate. After 15 minutes, plates were gently washed in three baths of water to remove dye 342
without disturbing biofilms. To score biofilm formation for agar plates, colonies were scored by eye as either 343
smooth,intermediate, or wrinkled. A wild-type colony would score wrinkled, and mutants with intermediate 344
or smooth appearance were considered defective in colony biofilm formation. For biofilm formation on a 345
plastic surface, the presence of a ring of cell material in the well indicated normal biofilm formation, while 346
low or no ring formation mutants were considered defective. Genes whose mutations resulted defects in both 347
or either assay were considered True for biofilm function. A complete list of the mutants identified in the 348
screens is available in Table S1. 349
[Figure 16 about here.] 350
A protein is considered True in the biofilm function, if its mutant phenotype is smooth or intermediate under 351
Doxycycline. 352
3.4
Term-centric evaluation
353
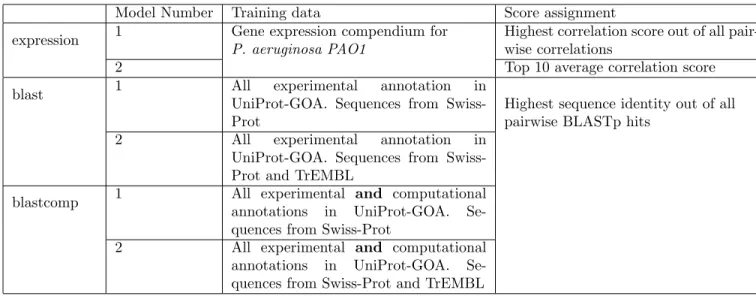
The evaluations of the CAFA-πmethods were based on the experimental results in Section 3.3. We adopted 354
both Fmax based on precision-recall curves and area under ROC curves. There are a total of six baseline
355
methods, as described in Table 3. 356
Model Number Training data Score assignment
expression 1 Gene expression compendium for
P. aeruginosa PAO1
Highest correlation score out of all pair-wise correlations
2 Top 10 average correlation score
blast 1 All experimental annotation in
UniProt-GOA. Sequences from Swiss-Prot
Highest sequence identity out of all pairwise BLASTp hits
2 All experimental annotation in
UniProt-GOA. Sequences from Swiss-Prot and TrEMBL
blastcomp 1 All experimental and computational
annotations in UniProt-GOA. Se-quences from Swiss-Prot
2 All experimental and computational
annotations in UniProt-GOA. Se-quences from Swiss-Prot and TrEMBL
4
Discussion
357
Since 2010, the CAFA community has been a home to a growing group of scientists across the globe sharing 358
the goal of improving computational function prediction. CAFA has been advancing this goal in three ways. 359
First, through independent evaluation of computational methods against the set of benchmark proteins, thus 360
providing a direct comparison of the methods’ reliability and performance at a given time point. Second, the 361
challenge assesses the quality of the current state of the annotations, whether they are made computationally 362
or not, and is set up to reliably track it over time. Finally, as described in this work, CAFA has started 363
to drive the creation of new experimental annotations by facilitating synergies between different groups of 364
researchers interested in function of biological macromolecules. These annotations not only represent new 365
biological discoveries, but simultaneously serve to provide benchmark data for rigorous method evaluation. 366
CAFA3 and CAFA-π feature the latest advances in the CAFA series to create advanced and accurate 367
methods for protein function prediction. We use the repeated nature of the CAFA project to identify certain 368
trends via historical assessments. The analysis revealed that the performance of CAFA methods improved 369
dramatically between CAFA1 and CAFA2. However, the protein-centric results for CAFA3 are mixed when 370
compared to historical methods. Though the best performing CAFA3 method outperformed the top CAFA2 371
methods (Figure 1), this was not consistently true for other rankings. Among all three CAFA challenges, 372
CAFA2 and CAFA3 methods inhabit the top 12 places in MFO and BPO. Between CAFA2 and CAFA3 373
the performance increase is more subtle. Based on the annotations of methods (Supplementary Materials), 374
many of the top-ranking methods are improved versions of methods that have been evaluated in CAFA2. 375
Interestingly, the top performing CAFA3 method, which consistently outperformed methods from all past 376
CAFAs in the major categories, was a novel contribution (Zhu lab). 377
For this iteration of CAFA we performed genome-wide screens of phenotypes in P. aeruginosa and 378
C. albicans as well as a targeted screen inD. melanogaster. This not only allowed us to assess the accuracy 379
with which methods predict genes associated with select biological processes, but also to use CAFA as 380
an additional driver for new biological discovery. In short, our experimental work identified more than a 381
thousand of new functional annotations in three highly divergent species. Though all screens have certain 382
limitations, the genome-wide screens also bypass questions of biases in curation. This evaluation provides 383
key insights: CAFA3 methods did not generalize well to selected terms. Because of that, we ran a second 384
effort, CAFA-π, in which participants focused solely on predicting the results of these targeted assays. This 385
targeted effort led to improved performance, suggesting that when the goal is to identify genes associated 386
with a specific phenotype, tuning methods may be required. 387
For CAFA evaluations, we have included both Na¨ıve and sequence-based (BLAST) baseline methods. 388
For the evaluation of P. aeruginosa screen results, we were also able to include a gene expression baseline 389
from a previously published compendium (33). Intriguingly, the expression-based predictions outperformed 390
existing methods for this task. In future CAFA efforts, we will include this type of baseline expression-based 391
method across evaluations to continue to assess the extent to which this data modality informs gene function 392
prediction. The results from the CAFA3 effort suggest that gene expression may be particularly important 393
for successfully predicting term-centric biological process annotations. 394
The primary takeaways from CAFA3 are: (1) Genome-wide screens complement annotation-based efforts 395
to provide a richer picture of protein function prediction; (2) The best performing method was a new method, 396
instead of a light retooling of an existing approach; (3) Gene expression, and more broadly, systems data 397
may provide key information to unlocking biological process predictions, and (4) Performance of the best 398
methods has continued to improve. The results of the screens released as part of CAFA3 can lead to a 399
re-examination of approaches which we hope will lead to improved performance in CAFA4. 400
5
Acknowledgements
401
Will be provided with the final manuscript 402
6
Data and Software
403
Data are available on figshare: https://figshare.com/articles/Supplementary_data/8135393 404
The assessment software used in this paper is available under GNU-GPLv3 license at: https://github. 405
com/ashleyzhou972/CAFA_assessment_tool 406
7
Funding
407
The work of IF was funded, in part, by National Science Foundation award DBI-1458359. The work of CSG 408
and AJL was funded, in part, by National Science Foundation award DBI-1458390 and GBMF 4552 from the 409
Gordon and Betty Moore Foundation. The work of DAH and KAL was funded, in part, by National Science 410
Foundation award DBI-1458390, National Institutes of Health NIGMS P20 GM113132, and the Cystic 411
Fibrosis Foundation CFRDP STANTO19R0. The work of AP, HY, AR and MT was funded by BBSRC grants 412
BB/K004131/1, BB/F00964X/1 and BB/M025047/1, Consejo Nacional de Ciencia y Tecnolog´ıa Paraguay 413
(CONACyT) grants 14-INV-088 and PINV15-315, and NSF Advances in Bio Informatics grant 1660648. 414
DK acknowledges supports from the National Institutes of Health (R01GM123055) and the National Science 415
Foundation (DMS1614777, CMMI1825941). PB acknowledges support from National Institutes of Health 416
(R01GM60595). GB and BZK acknowledge support from the National Science Foundation (NSF 1458390) 417
and NIH DP1MH110234. FS was funded by the ERC StG 757700 ”HYPER-INSIGHT” and by the Spanish 418
Ministry of Science, Innovation and Universities grant BFU2017-89833-P. FS further acknowledges funding 419
from the Severo Ochoa award to the IRB Barcelona. The work of SK was funded by ATT Tieto k¨aytt¨o¨on grant 420
and Academy of Finland. TB and SM were funded by NIH awards UL1 TR002319 and U24 TR002306. The 421
work of CZ and ZW was funded by National Institutes of Health R15GM120650 to ZW and start-up funding 422
from the University of Miami to ZW. PR acknowledges NSF grant DBI-1458477. PT acknowledges support 423
from Helsinki Institute for Life Sciences. The work of FZ and WT was funded by the National Natural Science 424
Foundation of China (31671367, 31471245, 91631301) and the National Key Research and Development 425
Program of China (2016YFC1000505, 2017YFC0908402]. CS acknowledges support by the Italian Ministry 426
of Education, University and Research (MIUR) PRIN 2017 project 2017483NH8. SZ is supported by National 427
Natural Science Foundation of China (No. 61872094 and No. 61572139) and Shanghai Municipal Science 428
and Technology Major Project (No. 2017SHZDZX01). PLF and RLH were supported by the National 429
Institutes of Health NIH R35-GM128637 and R00-GM097033. DTJ, CW, DC and RF were supported by 430
the UK Biotechnology and Biological Sciences Research Council (BB/L020505/1 and BB/L002817/1) and 431
Elsevier. The work of YZ and CZ was funded in part by the National Institutes of Health award GM083107, 432
GM116960, AI134678, the National Science Foundation award DBI1564756, and the Extreme Science and 433
Engineering Discovery Environment (XSEDE) award MCB160101 and MCB160124. The work of BG, VP, 434
RD, NS and NV was funded by the Ministry of Education, Science and Technological Development of the 435
Republic of Serbia, Project No. 173001. The work of YWL, WHL, JMC was funded by the Taiwan Ministry 436
of Science and Technology (106-2221-E-004-011-MY2). YWL, WHL, JMC further acknowledge support from 437
“the Human Project from Mind, Brain and Learning” of the NCCU Higher Education Sprout Project by 438
the Taiwan Ministry of Education and the National Center for High-performance Computing for computer 439
time and facilities.The work of IK and AB was funded by Montana State University and NSF Advances 440
in Biological Informatics program through grant number 0965768. BR, TG and JR are supported by the 441
Bavarian Ministry for Education through funding to the TUM. The work of RB, VG, MB, and DCEK was 442
supported by the Simons Foundation and NIH NINDS grant number 1R21NS103831-01. 443
References
444
[1] S. Goodwin, J. D. McPherson, and W. R. McCombie. Coming of age: ten years of next-generation 445
sequencing technologies. Nat Rev Genet, 17(6):333–351, 2016. 446
[2] R. Aebersold and M. Mann. Mass spectrometry-based proteomics. Nature, 422(6928):198–207, 2003. 447
[3] A. M. Schnoes, D. C. Ream, A. W. Thorman, P. C. Babbitt, and I. Friedberg. Biases in the experimental 448
annotations of protein function and their effect on our understanding of protein function space. PLoS
449
Comput Biol, 9(5):e1003063, 2013. 450
[4] B. Rost, J. Liu, R. Nair, K. O. Wrzeszczynski, and Y. Ofran. Automatic prediction of protein function. 451
Cell Mol Life Sci, 60(12):2637–2650, 2003. 452
[5] I. Friedberg. Automated protein function prediction–the genomic challenge. Brief Bioinform, 7(3):225– 453
242, 2006. 454
[6] R. Sharan, I. Ulitsky, and R. Shamir. Network-based prediction of protein function. Mol Syst Biol, 455
3:88, 2007. 456
[7] R. Rentzsch and C. A. Orengo. Protein function prediction–the power of multiplicity.Trends Biotechnol, 457
27(4):210–219, 2009. 458
[8] A. Shehu, D. Barbara, and K. Molloy. A survey of computational methods for protein function
predic-459
tions, pages 225–298. Springer, 2016. 460
[9] D. Cozzetto and D. T. Jones. Computational methods for annotation transfers from sequence. Methods
461
Mol Biol, 1446:55–67, 2017. 462
[10] M. Pellegrini, E. M. Marcotte, M. J. Thompson, D. Eisenberg, and T. O. Yeates. Assigning protein 463
functions by comparative genome analysis: protein phylogenetic profiles. Proc Natl Acad Sci USA, 464
96(8):4285–4288, 1999. 465
[11] L. J. Jensen, R. Gupta, N. Blom, D. Devos, J. Tamames, C. Kesmir, H. Nielsen, H. H. Staerfeldt, 466
K. Rapacki, C. Workman, C. A. Andersen, S. Knudsen, A. Krogh, A. Valencia, and S. Brunak. Prediction 467
of human protein function from post-translational modifications and localization features. J Mol Biol, 468
319(5):1257–1265, 2002. 469
[12] M. Deng, K. Zhang, S. Mehta, T. Chen, and F. Sun. Prediction of protein function using protein-protein 470
interaction data. J Comput Biol, 10(6):947–960, 2003. 471
[13] F. Pazos and M. J. Sternberg. Automated prediction of protein function and detection of functional 472
sites from structure. Proc Natl Acad Sci USA, 101(41):14754–14759, 2004. 473
[14] E. Nabieva, K. Jim, A. Agarwal, B. Chazelle, and M. Singh. Whole-proteome prediction of protein 474
function via graph-theoretic analysis of interaction maps. Bioinformatics, 21 Suppl 1:i302–310, 2005. 475
[15] B. E. Engelhardt, M. I. Jordan, K. E. Muratore, and S. E. Brenner. Protein molecular function prediction 476
by Bayesian phylogenomics. PLoS Comput Biol, 1(5):e45, 2005. 477
[16] F. Enault, K. Suhre, and J. M. Claverie. Phydbac “Gene Function Predictor”: a gene annotation tool 478
based on genomic context analysis. BMC Bioinformatics, 6:247, 2005. 479
[17] T. Hawkins, S. Luban, and D. Kihara. Enhanced automated function prediction using distantly related 480
sequences and contextual association by PFP. Protein Sci, 15(6):1550–1556, 2006. 481
[18] M. N. Wass and M. J. Sternberg. Confunc–functional annotation in the twilight zone. Bioinformatics, 482
24(6):798–806, 2008. 483
[19] S. Mostafavi, D. Ray, D. Warde-Farley, C. Grouios, and Q. Morris. GeneMANIA: a real-time multiple 484
association network integration algorithm for predicting gene function. Genome Biol, 9(Suppl 1):S4, 485
2008. 486
[20] A. Sokolov and A. Ben-Hur. Hierarchical classification of gene ontology terms using the GOstruct 487
method. J Bioinform Comput Biol, 8(2):357–376, 2010. 488
[21] W. T. Clark and P. Radivojac. Analysis of protein function and its prediction from amino acid sequence. 489
Proteins, 79(7):2086–2096, 2011. 490
[22] D. Piovesan, M. Giollo, E. Leonardi, C. Ferrari, and S. C. E. Tosatto. INGA: protein function predic-491
tion combining interaction networks, domain assignments and sequence similarity. Nucleic Acids Res, 492
43(W1):W134–W140, 2015. 493
[23] R. You, Z. Zhang, Y. Xiong, F. Sun, H. Mamitsuka, and S. Zhu. GOLabeler: improving sequence-based 494
large-scale protein function prediction by learning to rank. Bioinformatics, 34(14):2465–2473, 2018. 495
[24] R. Fa, D. Cozzetto, C. Wan, and D. T. Jones. Predicting human protein function with multi-task deep 496
neural networks. PLoS One, 13(6):e0198216, 2018. 497
[25] P. Radivojac, W. T. Clark, T. R. Oron, A. M. Schnoes, T. Wittkop, A. Sokolov, K. Graim, C. Funk, 498
K. Verspoor, A. Ben-Hur, G. Pandey, J. M. Yunes, A. S. Talwalkar, S. Repo, M. L. Souza, D. Piovesan, 499
R. Casadio, Z. Wang, J. Cheng, H. Fang, J. Gough, P. Koskinen, P. Toronen, J. Nokso-Koivisto, 500
L. Holm, D. Cozzetto, D. W. Buchan, K. Bryson, D. T. Jones, B. Limaye, H. Inamdar, A. Datta, 501
S. K. Manjari, R. Joshi, M. Chitale, D. Kihara, A. M. Lisewski, S. Erdin, E. Venner, O. Lichtarge, 502
R. Rentzsch, H. Yang, A. E. Romero, P. Bhat, A. Paccanaro, T. Hamp, R. Kassner, S. Seemayer, 503
E. Vicedo, C. Schaefer, D. Achten, F. Auer, A. Boehm, T. Braun, M. Hecht, M. Heron, P. Honigschmid, 504
T. A. Hopf, S. Kaufmann, M. Kiening, D. Krompass, C. Landerer, Y. Mahlich, M. Roos, J. Bjorne, 505
T. Salakoski, A. Wong, H. Shatkay, F. Gatzmann, I. Sommer, M. N. Wass, M. J. Sternberg, N. Skunca, 506
F. Supek, M. Bosnjak, P. Panov, S. Dzeroski, T. Smuc, Y. A. Kourmpetis, A. D. van Dijk, C. J. 507
ter Braak, Y. Zhou, Q. Gong, X. Dong, W. Tian, M. Falda, P. Fontana, E. Lavezzo, B. Di Camillo, 508
S. Toppo, L. Lan, N. Djuric, Y. Guo, S. Vucetic, A. Bairoch, M. Linial, P. C. Babbitt, S. E. Brenner, 509
C. Orengo, B. Rost, S. D. Mooney, and I. Friedberg. A large-scale evaluation of computational protein 510
function prediction. Nat Methods, 10(3):221–227, 2013. 511
[26] Y. Jiang, T. R. Oron, W. T. Clark, A. R. Bankapur, D. D’Andrea, R. Lepore, C. S. Funk, I. Kahanda, 512
K. M. Verspoor, A. Ben-Hur, C. E. Koo da, D. Penfold-Brown, D. Shasha, N. Youngs, R. Bonneau, 513
A. Lin, S. M. Sahraeian, P. L. Martelli, G. Profiti, R. Casadio, R. Cao, Z. Zhong, J. Cheng, A. Altenhoff, 514
N. Skunca, C. Dessimoz, T. Dogan, K. Hakala, S. Kaewphan, F. Mehryary, T. Salakoski, F. Ginter, 515
H. Fang, B. Smithers, M. Oates, J. Gough, P. Toronen, P. Koskinen, L. Holm, C. T. Chen, W. L. 516
Hsu, K. Bryson, D. Cozzetto, F. Minneci, D. T. Jones, S. Chapman, D. Bkc, I. K. Khan, D. Kihara, 517