Repositorio Institucional de la Universidad Autónoma de Madrid
https://repositorio.uam.es
Esta es la
versión de autor
del artículo publicado en:
This is an
author produced version
of a paper published in:
Applied Economics 45.30 (2013): 4226-4235
DOI:
http://dx.doi.org/10.1080/00036846.2013.781260
Copyright:
© 2013 Taylor & Francis
El acceso a la versión del editor puede requerir la suscripción del recurso
Access to the published version may require subscription
Gender
wage
differentials
and
educational
mismatch:
an
application
to
the
Spanish
case
M
adel Mar Salinas-Jiménez
a,*
, Marta Rahona-López
band Inés P. Murillo-Huertas
a aDepartamento de Economía. Facultad de CC. Económicas, Universidad deExtremadura, Avda.Elvas s/n. 06006, Badajoz, Spain
bFacultad de CC. Económicas, Departamento de Economía y Hacienda Pública, Universidad Autónoma de Madrid, Campus de Cantoblanco-28049, Madrid, Spain
This article aims to analyse gender wage differentials in Spain by taking into account the levels of educational attainment and bystudyingwhetherthe educa-tionalmismatch affects thegender wagegap. Focusing onreturns to education,evidenceisfoundontheexistenceofeducationalmismatchandonitscontribu-tiontodeterminewages,with women suffering greater wage penalties that are associated with educational mismatch. Furthermore, although the genderwagegapislowerforindividualswithloweducationallevels,wefindthatthepartofthisgapduetodifferences inreturnsisgreaterinthisgroup.Onthecontrary,thegendergapisgreateramonghighly-educatedworkers,butinthis casemostofthewagedifferentialsareduetodifferencesinproductivecharacteristics.Inanycase,ourresultssuggest thatgenderwagediscriminationtendstobegreaterforthoseworkerswhoshoweducationalmismatch.
Keywords:genderwagegap;returnstoeducation;educationalmismatchJELClassification:I20;I24;J31
I. Introduction
The existence of gender wage differentials has beenwidely documented in most developed countries, with women’s earnings being on average lower than men’seven when account is taken of differences in productive characteristics.1 TheSpanishcaserepresentsnoexceptionin spite of the advances experienced by women in the
Spanishlabourmarketinrecentdecades.2 Welfarepoliciesbased on education are usually seen as contributing to more equalitarianopportunities betweenwomenand menas regards the participation inthe labourmarket. In fact, greaterparticipationofwomenintheSpanishlabourmarketcanbeexplainedtoagreaterextentbydifferentstructural factorsamongwhichhighereducationplaysanimportantrole,byincreasingwomen’searningpotential(Boverand
*Corresponding author. E-mail:[email protected] 1
A comprehensive survey of the literature on the gender wage gap is provided by Blau and Kahn (2000). For a meta-analysis based on 263 articles on gender wage differentials, see also Weichselbaumer and Winter-Ebmer (2005).
2
As an illustration of these advances, we can look at the increase in the female activity and employment rates in the last decades. Data from the Spanish National Statistics Institute (INE) shows that the female activity rate has increased from 27.8% in 1980 to 41.4% in 2000 and to 52.3% in 2010, whereas the employment rate for women rises from 24.2% in 1980 to 32.9% in 2000 and to 41.6% in 2010.
Arellano,1995; Vila and Mora,1998). However, important gender wage differentials still remain in the Spanish labour market, with women’s earnings being (on average) around 75–80% those of men (Gardeazabal and Ugidos, 2005; Amuedo-Dorantes and De la Rica,2006).
In the past, part of the gender wage gap in Spain could be attributed to the lower levels of education acquired by women, but in recent decades women have progressively increased their education levels and have become a majority in higher education, so gender wage differentials may hardly be explained by differences in education at the current time. Nevertheless, different rewards to education by gender may still contribute to gender wage differentials. Moreover, if one takes into account the demand side of the labour market, one should consider that a mismatch between the education acquired by workers and that required by the jobs they do may differ; so, part of the skills acquired through education could be underused.3The con-tribution of differences in returns to the gender wage gap could hence be even more relevant if educational mismatch affects women and men to different extents and if returns to years of over- (under-) education differ depending on gen-der. Although recognizing other sources of wage differen-tials by gender (e.g. gender segregation by sector, industry or/and occupation, experience or gender heterogeneity in preferences), in this study, we will focus on the role of education and on the degree of match between the educa-tion acquired by workers and that required by their jobs to explain gender wage differentials in Spain.
The study of wage differentials by levels of education is often applied to control for individual heterogeneity. As noted by Katz and Murphy (1992), highly- and low-edu-cated workers will access occupations with different skill contents which will determine different earning capacities; so, the interest is on analysing wage differentials sepa-rately for workers with different levels of education. In Spain, the study by De la Ricaet al. (2008) follows this perspective and analyses gender wage differentials in the wage distribution for individuals with a level of college/ tertiary education and for those with a lower level of education. For the Italian case, Favaro and Magrini (2008) also study gender differentials in wages by levels of education, andfind that highly-educated women tend to experience lower gender gaps than low-educated women. More recently, Addabbo and Favaro (2011) confirm sharp differences by educational levels and highlight the signif-icant incidence of differences in rewards for highly-edu-cated Italian women. The authors interpret this result as suggesting that the incidence of over-education is greater among highly-educated Italian women and that the pay penalty they suffer compared to their well-matched
counterparts is higher than that of men. Educational mis-match and returns to education are however not under analysis in their study. In fact, there is an extensive litera-ture on gender differences in returns to education and on educational mismatch, but the question of whether educa-tional mismatch affects the gender wage gap has not attracted the attention of the literature on gender differen-tials to date.
We aim to contribute to this literature by analysing gender wage differentials in Spain by taking into account the educational mismatch. In particular, we aim to answer the following research questions:
Question 1: Does educational mismatch contribute to determine wages? If so, do returns asso-ciated to educational mismatch differ by gender?
Question 2:Is the gender wage gap in Spain explained by gender differences in productive char-acteristics or by different returns associated to such characteristics?
Question 3:Do the factors behind the gender wage gap differ for workers showing educational mismatch?
In order to answer question 1, we estimate returns to education both for actual years of schooling (following the theoretical framework proposed by Mincer,1974) and for years of required over- and under-education (thus apply-ing the ORU (Over-, Required and Under-education) spe-cifications proposed by Duncan and Hoffman, 1981). These estimations are run by gender in order to ascertain whether returns associated to years of education and to educational mismatch differ by gender. To answer ques-tion 2, we follow the Blinder (1973) and Oaxaca (1973) decomposition, which allows one to break down the gen-der wage gap into a part explained by differences in productive characteristics and a part due to difference in returns to such characteristics. Finally, the analysis of the extent to which gender differences in returns contribute to the gender wage gap will be done for workers showing (or not) educational mismatch in order to answer question 3. In any case, individual heterogeneity will be controlled for by taken into account the levels of educational attainment. The remainder of the article is structured as follows. Section II offers a brief review of the literature on returns to education and educational mismatch. Section III pre-sents the data and the estimates for educational mismatch by gender. Section IV focuses on the analysis of returns to education in Spain for the year 2006, paying special atten-tion to differences by gender and to the match between 3
In fact, when the supply and demand sides of the labour market are jointly considered, onefinds that educational mismatch has significantly increased in most of the developed countries, especially as regards the percentage of workers being overeducated (McGuiness,2006).
attained and required education. Section V evaluates gen-der wage differentials by both educational attainments and educational mismatch. Finally, the article closes with the mainfindings and conclusions of this study.
II. Returns to Education and Educational Mismatch
In the framework of the human capital theory, education is a key variable to determine individual productivity and therefore wages. The empirical approach to asses this prediction was developed by Mincer (1974) and is based on an earnings equation, where years of schooling are central to explain wages (together with experience and other control variables). Within this framework, marginal productivity is determined by labour supply and over-education appears as an inconsistent long-term outcome since it would be associated with the underutilization of workers’human capital. In contrast, the job-competition model (Thurow, 1975) focuses on the demand side and suggests that job characteristics are the main factors that determine earnings. Workers compete for high-wage jobs, and education (and even surplus education) contributes to preserve an individual’s position within a particular job queue. Nevertheless, once the individuals are allocated jobs, the marginal productivity is determined by job char-acteristics; so, returns to surplus education (i.e. education in excess of that required for a particular job) will be zero. The assignment model (Sattinger,1993) provides a middle ground between these opposite views by arguing that workers’marginal productivity, and consequently wages, depends on both the demand and supply sides of the labour market, being determined in part by job character-istics (e.g. required education) and in part by individual characteristics (e.g. acquired education).4
The empirical literature on the wage effects of educa-tional mismatch started with the seminal paper by Duncan and Hoffman (1981), where a distinction was made between the individuals’educational attainments and the requirements of their jobs. Returns to education were then estimated for both years of required education and years of surplus (or deficit) education. As noted by Hartog (2000), this approach proved to be attractive mainly for two rea-sons: first, because of its simplicity and straightforward specification, which is easy to estimate and clear to inter-pret; and second, because of the link established between
the demand and supply sides of the labour market, which allows for different allocation processes leading to evident differentials in returns depending not only on levels of schooling but also on jobs’characteristics.
In order to take into account the demand and supply sides of the labour market, it becomes necessary to pre-viously estimate the degree of match between the workers’ level of educational attainment and that required for their job. Different measures for educational mismatch have been proposed in the literature and are generally grouped into objective, subjective and statistical measures. Objective measures are based on the analysis of job char-acteristics, with individuals’ characteristics being com-pared to job requirements; subjective measures are based on information provided by the workers themselves about some personal and job-related characteristics and statisti-cal measures compare the worker’s educational level with that of other workers doing a similar job, taking as refer-ence the statistical mean or the modal value of the dis-tribution.5Each of these measures shows advantages and disadvantages both methodologically and in the condi-tions needed for their implementation. Furthermore, there is no clear preference for the use of one or other measure in the empirical literature and the choice is usually determined by data availability. In any case, as emphasized by Hartog (2000), results obtained in different studies that estimate returns to years of over- (under-) education tend to be consistent regardless of the measure used to estimate educational mismatch.
Among the empirical results, there is a broad consensus on the negative effects of educational mismatch on wages, with returns to years of undereducation being negative whereas returns to years of overeducation tend to be positive but smaller than those to years of required educa-tion. Hence, it is generally found that wages earned by an undereducated worker are lower than those earned by co-workers with an educational level in accordance with their job, while overeducated workers get indeed higher wages, although below the average expected given their educa-tional level.6 Moreover, it also stands out that over-(under-) educated workers tend to receive lower (higher) wages than those they would have got in a job for which they were adequately educated.7Finally, when the focus is placed on gender differences in returns, wefind that the empirical evidence is mixed. On the one hand, some works suggest that the negative effects of educational mismatch on workers´ earnings are greater in the case of 4
A good review of the literature on overeducation as regards different theoretical frameworks can be found in McGuinness (2006).
5
For example, Verdugo and Verdugo (1989) consider that workers are over- (under-) educated when years of formal education exceed (are below) in more than one SD, the mean value of a particular job. Alternatively, Kikeret al. (1997) propose the use of the modal value, arguing that this statistic is less sensitive to the existence of outliers in the distribution.
6
See for example Hartog and Oosterbeek (1988) for the Netherlands; Dalyet al. (2000) for USA and Germany; Cohn and Ng (2000) for Hong Kong; Ren and Miller (2011) for China or Alba-Ramírez (1993) and Budría and Moro-Egido (2008) for the Spanish case.
7
Kikeret al. (1997) for Portugal; Di Pietro and Urwin (2006) for Italy; Groot (1996) and Dolton and Silles (2008) for UK; or Cohn and Khan (1995) and Tsai (2010) for USA.
men (Dolton and Vignoles,2000, for the UK; Dalyet al., 2000, for Germany; Ren and Miller, 2011, for China), whereas, on the other, different studies point to the oppo-site result, with women being more penalized by educa-tional mismatch than men (Cohn and Ng,2000, for Hong Kong; Budría and Moro-Egido,2009, for the Spanish and German cases).
III. Data and Descriptive Analysis
Data used in this study come from the last available wave of the Spanish Wage Structure Survey (WSS), which refer to year 2006. This survey is conducted by the Spanish National Institute of Statistics as part of a European project providing harmonized 4-year period information on the structure and distribution of wages. The WSS offers a comprehensive matched employer-employee data set. Variables referred to workers include monetary pay, gen-der, age, education, occupation, working hours, supervi-sory tasks, type of contract (permanent or temporary) and full-/part-time status. Firm related variables provide infor-mation on the activity sector, size, public/private owner-ship and location by region. The sample used in this article
is restricted to workers aged 16–65with 118 996 men and 69 519 women.
The measure of earnings used in this study is the gross hourly wage. Looking at education, the database provides information on the highest educational level completed by workers, with years of schooling being proxied in the pre-sent study by the theoretical years of schooling required to complete that educational level.8 Finally, given that the WSS does not include the individual’s actual experience in the labour market, the potential experience (age minus years of schooling minus six) is used as proxy.
More than 60 occupations corresponding to the two-digit occupational code proposed by the National Occupational Classification-1994 are considered when estimating educational (mis)match. A modal-based statis-tical measure is used to estimate years of required, over-and under-schooling.9 Years of required education (Sr)
correspond to the modal value of years of schooling for those individuals who are appropriately educated in each occupation, whereas years of over- and under-education (SoandSu) are given by the difference between the actual
years of schooling and the modal value in each occupation for over- and under-educated workers, respectively.10
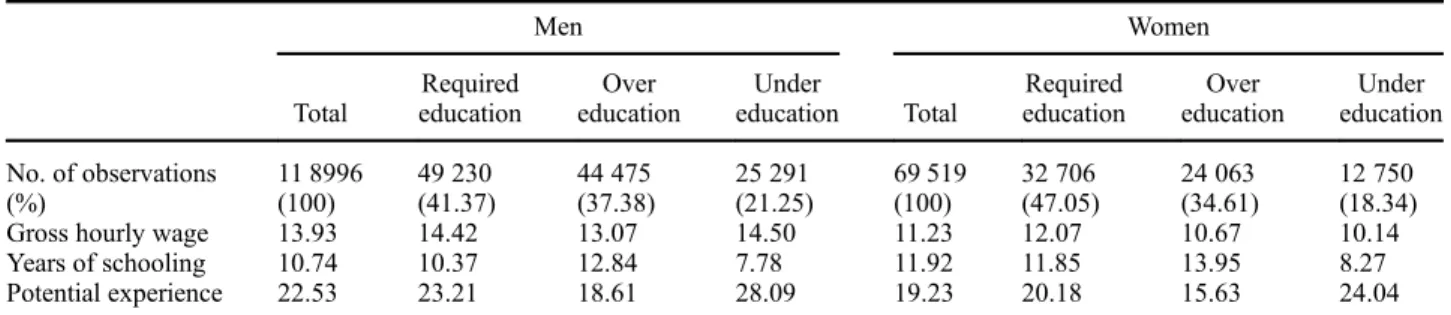
Table 1offers descriptive statistics on wages, schooling, experience and educational mismatch. As can be
Table 1. Descriptive statistics by gender and educational mismatch
Men Women Total Required education Over education Under education Total Required education Over education Under education No. of observations 11 8996 49 230 44 475 25 291 69 519 32 706 24 063 12 750 (%) (100) (41.37) (37.38) (21.25) (100) (47.05) (34.61) (18.34)
Gross hourly wage 13.93 14.42 13.07 14.50 11.23 12.07 10.67 10.14
Years of schooling 10.74 10.37 12.84 7.78 11.92 11.85 13.95 8.27
Potential experience 22.53 23.21 18.61 28.09 19.23 20.18 15.63 24.04
Source: Wage Structure Survey (2006) and own elaboration.
8
It should be noted that the construction of the‘years of schooling’variable from information on levels of completed education gives a discontinuity in the variable. Although it would be desirable to have direct information on years of schooling, the discontinuity arising from the followed approach does not pose any problem in the analysis. In any case, if information on completed levels of education gives an idea of acquired skills, the use of this variable will contain the relevant information for the purpose of our analysis. In particular, we work with seven educational levels: primary education,first-stage secondary education, upper secondary education, middle-grade vocational training, upper-grade vocational training, short-cycle university and long-cycle university. For the sake of presentation, primary education,first-stage secondary education and upper secondary education are grouped as‘up to secondary education’whereas short- and long-cycle university are grouped as‘higher education’.
9
Since education is practically bounded, it should be noted that the dispersion around the mode is not independent of the modal value. This point should be in mind when comparing educational mismatch between groups with different modal values. Other studies using this same measure of educational mismatch are those by Kikeret al. (1997); Cohn and Ng (2000); Mendes de Olivieraet al. (2000) and Bauer (2002).
10
As a robustness test, years of required education are also broadly defined as the modal value plus/minus 1 year. As expected, the percentage of workers with the required education slightly increases. However, the results for both the distribution of over- and under-educated workers and for the subsequent analyses remain qualitatively similar to those obtained when the modal value is considered.
observed, educational mismatch affects a large proportion of workers, most of them being overeducated (37.4% in the case of men and 34.6% in the case of women). It can also be highlighted that gross hourly wages are higher for men, with women’s wages being on average around 80% of those earned by their male counterparts. Some differ-ences appear, nonetheless, when an account of educational mismatch is taken, with a female-to-male earnings ratio of 83.7% for workers with the required education, whereas this ratio does not reach 70% in the case of undereducated workers. A priori, gender wage differentials do not respond to differences in education, since years of school-ing are on average greater for women in more than 1 year. Differences in other productive characteristics such as experience in the labour market, which is higher in more than 3 years in the case of men, could nonetheless con-tribute to explain gender wage differentials. Alternatively, it could also be that different returns to these productive characteristics lay behind the gender wage gap.
IV. Returns to Education in Spain: an Analysis by Gender
The standard model to estimate returns to education comes from the empirical framework proposed by Mincer (1974) and is based on an earnings equation of the following type: lnðwiÞ ¼αþβSiþγEiþδEi2þλXiþui (1) where wages (w) are explained by years of attained school (S), experience in the labour market (E) and its square (E2), a vector of controls (Xi) and a random variable (u).
When educational mismatch is taken into account, this specification varies slightly as years of schooling are decomposed into years of required schooling (Sr), years
of over schooling (So) and years of under schooling (Su).
This specification was proposed by Duncan and Hoffman (1981) and is generally known as the ORU equation:
lnðwiÞ ¼αþβoSoiþβrSriþβuSuiþγEiþδE2i
þλXiþui
(2)
In Equation 1, the education variable (i.e. actual years of schooling) refers to the individual’s characteristics and therefore to the supply side of the labour market, whereas in Equation 2, we find variables referred to both the demand and supply sides, with wages being determined by job-required education and by deviations between the supply and the demand of qualifications (years of
over- and under-schooling). This allows one to test for some predictions coming from different theoretical frame-works: ifβr¼βo¼βucannot be rejected, workers’ pro-ductivity would be solely explained by their actual decisions on schooling, as predicted within the framework of the human capital theory; conversely, ifβo¼βu¼0, workers’productivity would be fully determined by the requirements of their job, giving hence support to the job-competition model; finally, if neither hypothesis is accepted, it would imply that educational mismatch occurs (βrÞβoÞβu) and allows to explain wages, thus supporting the assignment views of the labour market.
Equations 1 and 2 are estimated for our Spanish sample of workers in year 2006. All regressions are run for men and women separately and control for full-/part-time sta-tus, type of contract, supervisory tasks,firm size, industry, public/private ownership and region. The Chow tests indicate that estimates for men and women are signifi -cantly different. Furthermore, the F-tests show that all variables are jointly significant. Finally, evidence is found on the existence of educational mismatch and on its contribution to determine wages, with both individual and job characteristics playing a role in the determination of earnings andthereby giving support to the assignment models.11
Table 2offers a summary of the results, showing the estimated returns to education when actual years of schooling are considered and when educational mismatch is taken into account On average returns to education tend to be higher for women than for men, with each additional year of actual schooling giving rise to 5.4% returns in the case of women, whereas this percentage only reached 4.8% in the case of men (only in the case of workers with higher education, returns to education are slightly lower for women than for men). Some significant differences appear, however, when educational mismatch is taken into account. Even though returns to education are found to be higher for years of required schooling than for actual schooling, the aforementioned pattern is main-tained, with returns to years of required education being higher for women than for men (the only exception being the workers with higher education). Nevertheless, wefind that returns to years of educational mismatch are in favour of men. Returns to years of schooling in excess of those required by a job tend to be half than those for required years of schooling, with men obtaining higher returns to years of surplus education than women. On the other hand, returns to years of underschooling tend to be negative, with women suffering greater penalties for each year of undereducation than their male counterparts. Thus, although returns to years of required education are higher for women, wefind that women suffer to a greater 11
Similar results supporting the assignment view are found in Groot (1996); Sloaneet al. (1999) or Dolton and Vignoles (2000) for the UK or in Kikeret al. (1997) for the case of Portugal.
extent the earnings losses associated with educational mismatch.12
V. Decomposing the Gender Wage Gap in Spain: the Role of Education and Educational Mismatch
The standard approach to analyse differences in wages was developed by Blinder (1973) and Oaxaca (1973). Within this framework, wage differentials are decom-posed into a part driven by differences in productivity and a residual or unexplained part that is often interpreted as a discrimination effect.13Wage differentials are hence analysed by comparing wages for equally productive workers so that the wage ratio between two groups of individuals (in our case, men and women) would be equal, in absence of discrimination, to the ratio of their respective productivities. This procedure requires the esti-mation of separate earnings equations for male and female conditional on human capital characteristics, thus allow-ing productive characteristics to be differently rewarded. In order to do this, two standard wage equations are estimated, one for each gender group:
lnðwiÞ ¼βZ
00
i þui (3)
wherewiis the individual hourly wage,Z 00
i is a vector of individual characteristics, anduiis a random error term.
The raw wage gap is then decomposed into an explained part, which is due to differences in mean pro-ductive characteristics (proxied by observable variables such as education, experience or industry, among others) and an unexplained part, which is due to different returns to such characteristics. The total difference in mean wages of male and female workers is decomposed as follows: lnðwmÞ lnðwwÞ ¼ ðZm0 Z
0
wÞ
0^
βmþ ð^βm^βwÞZw0 (4) where the upper bar indicates the mean of the variables,^β are the estimated parameters from Equation 3, and sub-scriptsmandwrefer to men and women respectively. The first term on the right-side measures the component of the wage differential due to the differences in the mean of the explanatory variables (i.e. the explained part), whereas the second term stands for the part of the wage gap that is interpreted as discrimination (i.e. the unexplained part) since it refers to differences in market rewards to produc-tive characteristics of male and female workers.14
Table 2. Estimated returns to education
Total Up to secondary Higher education
Men Women Men Women Men Women
i) Micerian model
Actual years of schooling 4.79* 5.39* 2.23* 2.90* 6.76* 5.92*
(0.0003) (0.0004) (0.0005) (0.0007) (0.0021) (0.0018)
R2 0.48 0.49 0.38 0.34 0.43 0.39
F-statistic 4848.75* 2869.18* 2151.33* 819.84* 685.97* 572.53*
ii) ORU model
Years of required schooling 7.07* 8.02* 4.57* 5.42* 9.63* 8.51*
(0.0004) (0.0005) (0.0006) (0.0009) (0.0021) (0.0018) Years of overschooling 3.57* 3.42* 2.45* 2.37* 4.82* 3.33* (0.0005) (0.0006) (0.0007) (0.0011) (0.0021) (0.0019) Years of underschooling −2.97* −3.66* −1.13* −2.26* −2.36* −4.47* (0.0006) (0.0008) (0.0007) (0.0009) (0.0044) (0.0046) R2 0.52 0.53 0.41 0.37 0.50 0.46 F-statistic 5174.38* 3169.39* 2201.91* 865.04* 819.15* 682.98* F-test (H0:βr=βo=βu) 7656.92* 6461.19* 1051.36* 1167.05* 1181.98* 1167.60* F-test (H0:βo=βu= 0) 4165.89* 2691.85* 592.87* 483.68* 247.02* 178.74*
Note: *Significant at the 1% confidence level. SEs between brackets.
12
Similar results are found in Cohn and Ng (2000) for Hong Kong and in Budría and Moro-Egido (2009) for the cases of Spain and Germany.
13
The expressions‘unexplained part’or‘discrimination’are used indistinctly throughout this article to refer to the unexplained residual. An interesting discussion on the use of these expressions on the gender wage gap literature can be found in Weichselbaumer and Winter-Ebmer (2006).
14
In line with most of the empirical literature, we assume men’s wages as being the nondiscriminatory structure, so male and female characteristics would be paid at men’s prices in absence of discrimination.
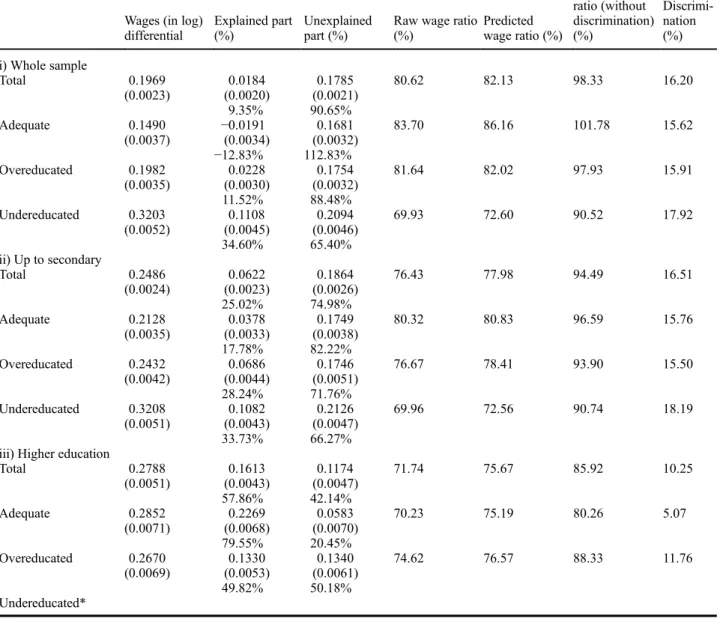
The Blinder–Oaxaca decomposition results are pro-vided inTable 3. Results are shown for the sample as a whole and by levels of educational attainment. In each case, we provide the estimates for the total sample and for the sub-samples of workers who achieve an educa-tional level matching the requirements of their jobs and for those who are over- or under-educated. Overall, we find that gender differences in productive characteris-tics account for a minor part of wage differentials, whereas the largest proportion of the gender wage gap is due to different returns to productive characteristics. In particular, focusing on the whole sample, it is found that the unexplained part accounts, on average, for
90.6% of the gender wage differentials. When educa-tional (mis)match is taken into account, the explained part is even negative for the sample of workers with the required education, thus indicating that women’s pro-ductive characteristics are better than those of men, and consequently individual characteristics do not contri-bute to explain the gender wage gap. In fact, if women had similar productive characteristics to those of men, the gender wage gap would be even greater. The unex-plained part then reaches a value greater than 100%, since differences in returns account for the entire gender gap and even compensate for the better productive endowments of women.
Table3. Blinder–Oaxacadecomposition
Wages (in log) differential
Explained part (%)
Unexplained part (%)
Raw wage ratio (%) Predicted wage ratio (%) Predicted wage ratio (without discrimination) (%) Discrimi-nation (%) i) Whole sample Total 0.1969 0.0184 0.1785 80.62 82.13 98.33 16.20 (0.0023) (0.0020) (0.0021) 9.35% 90.65% Adequate 0.1490 −0.0191 0.1681 83.70 86.16 101.78 15.62 (0.0037) (0.0034) (0.0032) −12.83% 112.83% Overeducated 0.1982 0.0228 0.1754 81.64 82.02 97.93 15.91 (0.0035) (0.0030) (0.0032) 11.52% 88.48% Undereducated 0.3203 0.1108 0.2094 69.93 72.60 90.52 17.92 (0.0052) (0.0045) (0.0046) 34.60% 65.40% ii) Up to secondary Total 0.2486 0.0622 0.1864 76.43 77.98 94.49 16.51 (0.0024) (0.0023) (0.0026) 25.02% 74.98% Adequate 0.2128 0.0378 0.1749 80.32 80.83 96.59 15.76 (0.0035) (0.0033) (0.0038) 17.78% 82.22% Overeducated 0.2432 0.0686 0.1746 76.67 78.41 93.90 15.50 (0.0042) (0.0044) (0.0051) 28.24% 71.76% Undereducated 0.3208 0.1082 0.2126 69.96 72.56 90.74 18.19 (0.0051) (0.0043) (0.0047) 33.73% 66.27%
iii) Higher education
Total 0.2788 0.1613 0.1174 71.74 75.67 85.92 10.25 (0.0051) (0.0043) (0.0047) 57.86% 42.14% Adequate 0.2852 0.2269 0.0583 70.23 75.19 80.26 5.07 (0.0071) (0.0068) (0.0070) 79.55% 20.45% Overeducated 0.2670 0.1330 0.1340 74.62 76.57 88.33 11.76 (0.0069) (0.0053) (0.0061) 49.82% 50.18% Undereducated*
Note: SEs between brackets. *Estimations for undereducated workers with higher education are not run because zero variance is encountered for the schooling variable.
By levels of educational attainment, differences in returns also account for most of the gender wage gap in the sub-sample of individuals who achieve a level up to secondary education (e.g. the unexplained part accounts for 66.3% of the undereducated workers and 82.2% for workers with the required education), whereas the percen-tage of gender wage differentials explained by differences in productive characteristics is higher for individuals with higher education (where individual characteristics explain almost 80% of the gender gap for those individuals who are properly educated).
On analysing the characteristics that contribute the most to explain gender wage differentials, wefind that years of schooling, experience and industry are the main factors behind explained wage differentials, with other variables accounting for a minor part of the gender wage gap. In fact, years of schooling tend to negatively contribute to gender wage differentials, thus suggesting that if women had schooling characteristics similar to that of men, the gender gap would be greater. Nevertheless, gender ences in experience and industry compensate for differ-ences in schooling and account for most of the gender wage gap explained by differences in characteristics. Moreover, in the case of workers with higher education, it is found that the part explained by other variables such as working full-time, having a permanent contract or being supervisor also account for a significant part of gender wage differentials. Although gender differences in work-ing status or supervisory positions could also respond to gender differences in preferences, this result suggests that some forms of discrimination other than differences in returns could be at play.
Focusing on the unexplained part, we can take into account the differences in returns to construct counterfac-tual wages without discrimination (i.e. women’s wages assuming that their productive characteristics are rewarded at men’s prices). In order to do this, we add the part of the wage differentials which are due to differences in returns to women’s wages. The right-hand side ofTable 3provides information on the raw and predicted wage ratios, on the predicted wage ratio in the absence of discrimination and on the difference between the predicted ratios with and without discrimination (i.e. the discriminatory part). Little differ-ences are found between the raw and the predicted wage ratios, showing that our estimates provide a good fit to observed wages. Gender wage gaps present a wide varia-bility across the different sub-samples. On average, women earn about 80–82% of men’s wages, but the gender gap tend to be greater when one considers the sub-samples of under-educated workers (e.g. around 70% for the sample as a whole and for workers with up to secondary education). In the case of workers with higher education, we find similar gender gaps regardless of whether educational mis-match is taken into account or not, with women’s earnings being around 75% of men’s wages.
A different picture is drawn when an account is taken of gender differences in returns, and the female-to-male wage ratios are estimated assuming that women’s characteristics get similar returns to those of men. Looking at the whole sample of workers, it stands out that paying women’s productive characteristics at men’s prices would lead gen-der wage differentials to almost disappear. Thus, in the absence of discrimination, women would earn (on average) around 98% of men’s wages, or put in another way, around 16% of men’s wages are not received by women due to discrimination. When we focus on workers with the required education, we see that, given the productive char-acteristics of women who attained an educational level matching the requirements of their job and assuming no gender differences in returns, women’s wages would be even greater than those earned by their male counterparts. On the other hand, when the focus is placed on workers showing educational mismatch, wefind that the discrimi-natory part is slightly higher in the case of the underedu-cated workers. A very similar pattern is found for the sample of workers with a level up to secondary education, whereas for the sample of workers with higher education, it is found that, if women’s characteristics had similar returns to those of their male counterparts, the wage ratio will rise from 75% to 80% for workers with the required education and from 76% to 88% for overeducated workers.
In summary, it is found that though the gender gap tends to be lower for individuals with low educational levels (up to secondary education), the part due to discrimination is greater in this group. On the contrary, among the highly-educated workers, the gender wage gap is slightly higher, but this gap is to a greater extent due to differences in productive characteristics. In any case, the results suggest that wage discrimination is greater for those individuals showing educational mismatch, in particular for the under-educated workers among those with a level up to second-ary education and for the overeducated workers among those with higher education.
VI. Conclusions
As the education levels in Spain has increased, women are getting better opportunities to access the labour market, but significant wage differentials by gender still remain. Moreover, looking at the demand side of the labour mar-ket, we observe that part of the skills acquired through education is underused, with a significant percentage of the workforce being overeducated. In particular, in our sample of workers, wefind a large proportion of workers (women and men) being over- or under-educated, with less than 50% showing a proper match. In this context, this article aimed to analyse gender wage differentials focusing on the role of education and on the degree of
match between the education acquired by workers and that required by the jobs they do.
By estimating the returns to education, wefind evidence on the existence of educational mismatch and on its con-tribution to determine wages. Moreover, when the analysis is run by gender, it is found that women get higher returns to years of actual or required schooling than men (the only exception being highly-educated workers), but years of educational mismatch seem to penalize women’s returns to a greater extent, with women getting lower returns to years of surplus education and higher penalties for years of deficit schooling than men do.
Women’s earnings in Spain are around 80% of men’s wages, but the female-to-male earnings ratio is even lower among highly-educated workers and among workers show-ing educational mismatch. On average, women show more years of schooling than men do, so gender wage differen-tials do not respond to differences in education. In fact, when wage differentials are decomposed into a part explained by differences in productive characteristics and a part due to differences in returns, wefind that the con-tribution of years of schooling to the gender gap is negative, but gender differences in experience and in the industries where women and men work compensate the better women’s endowments of schooling and explain part of the gender gap. Nevertheless, we find that a significant part of gender wage differentials is not explained by differ-ences in individuals’characteristics but by differences in returns. Moreover, women’s greater penalties to educa-tional mismatch translate into greater differences in returns among workers showing educational mismatch, with the part of the gender wage gap due to differences in returns being greater among workers with deficit or surplus education.
Although educational policies have clearly contribute to facilitate the access of women to the labour market, other welfare policies seem to be needed to promote more equalitarian opportunities between women and men in order to reduce existing gender wage differentials. Among them, implementing pay systems oriented to avoid differences in returns paid by gender, and policies to facilitate the access of women to the labour market in similar conditions than men (e.g. avoiding sectoral and occupational segregation) seem to be required. Also, achieving a greater match between the demand and supply sides of the labour market could contribute to reduce the gender wage gap, given the greater penalties suffered by women as a consequence of the educational mismatch. This greater match would not only be useful to reduce wage differentials but also to avoid that skills acquired through education were underused and to take advantage of the important effort made by the Spanish economy to increase the educational levels of its workforce.
Acknowledgements
The authors acknowledge support from the Spanish Ministry of Science and Innovation (Fundamental Research Projects ECO2009-13864-C03-01 and ECO2009-13864-C03-02).
References
Addabbo, T. and Favaro, D. (2011) Gender wage differentials by education in Italy,Applied Economics,43, 4589–605. Alba-Ramírez, A. (1993) Mismatch in the Spanish labor market:
overeducation?, The Journal of Human Resources, 28, 259–78.
Amuedo-Dorantes, C. and De la Rica, S. (2006) The role of segregation and pay structure on the gender wage gap: evidence from matched employer-employee data for Spain, B.E. Journal of Economic Analysis and Policy: Contributions to Economic Analysis and Policy,5, 1–32. Bauer, T. K. (2002) Educational mismatch and wages: a panel
analysis,Economics of Education Review,21, 221–29. Blau, F. D. and Kahn, L. M. (2000) Gender differences in pay,
Journal of Economic Perspectives,14, 75–99.
Blinder, A. S. (1973) Wage discrimination: reduced forms and structural estimates, Journal of Human Resources, 8, 436–55.
Bover, O. and Arellano, M. (1995) Female labour force partici-pation in the 1980s: the case `of Spain, Investigaciones Económicas,19, 171–94.
Budría, S. and Moro-Egido, A. (2008) Education, educational mismatch, and wage inequality: evidence for Spain,
Economics of Education Review,27, 332–41.
Budría, S. and Moro-Egido, A. (2009) The overeducation phe-nomenon in Europe,Revista Internacional De Sociología,
67, 329–45.
Cohn, E. and Khan, S. (1995) The wage effects of overschooling revisited,Labour Economics,2, 67–76.
Cohn, E. and Ng, Y. C. (2000) Incidence and wage effects of overschooling and underschooling in Hong Kong,
Economics of Education Review,19, 159–68.
Daly, M. C., Büchel, F. and Duncan, G. J. (2000) Premium and penalties for surplus and deficit education: evidence from United States and Germany, Economics of Education Review,19, 169–78.
De la Rica, S., Dolado, J. J. and Llorens, V. (2008) Ceilings or
floors: gender wage gaps by education in Spain,Journal of Population Economics,21, 751–76.
Di Pietro, G. and Urwin, P. (2006) Education and skills mismatch in the Italian graduate labour market,Applied Economics,
38, 79–93.
Dolton, P. and Silles, M. (2008) The effects of overeducation on earnings in the graduate labour market, Economics of Education Review,27, 125–39.
Dolton, P. and Vignoles, A. (2000) The incidence and effects of overeducation in the U.K. graduate labour market,
Economics of Education Review,19, 179–98.
Duncan, G. and Hoffman, S. D. (1981) The incidence and wage effects of overeducation,Economics of Education Review,
1, 75–86.
Favaro, D. and Magrini, S. (2008) Group versus individual discrimination among young workers: a distributional approach,Journal of Socio-Economics,37, 1856–79.
Gardeazabal, J. and Ugidos, A. (2005) Gender wage discrimina-tion at quantiles, Journal of Population Economics, 18, 165–79.
Groot, W. (1996) The incidence of, and returns to overeducation in the UK,Applied Economics,28, 1345–50.
Hartog, J. (2000) Over-education and earnings: where are we, where should we go?,Economics of Education Review,19, 131–47.
Hartog, J. and Oosterbeek, H. (1988) Education, allocation and earnings in the Netherlands: overschooling?,Economics of Education Review,7, 185–94.
Katz, L. and Murphy, M. (1992) Changes in relative wages, 1963–1987: supply and demand factors, The Quarterly Journal of Economics,107, 35–78.
Kiker, B. F., Santos, M. C. and Mendes de Oliviera, M. (1997) Overeducation and undereducation: evidence for Portugal,
Economics of Education Review,16, 111–25.
McGuinness, S. (2006) Overeducation in the labour market,
Journal of Economic Surveys,20, 387–418.
Mendes de Oliviera, M., Santos, M. C. and Kiker, B. F. (2000) The role of human capital and technological change in overedu-cation,Economics of Education Review,19, 199–206. Mincer, J. (1974) Schooling, Experience and Earnings,
Columbia University Press, New York.
Oaxaca, R. (1973) Male-female wage differentials in urban labour markets,International Economic Review,14, 693–709.
Ren, W. and Miller, P. W. (2011) Changes over time in the return to education in urban China: conventional and oru esti-mates, China Economic Review, doi:10.1016/j. chieco.2011.08.008.
Sattinger, M. (1993) Assignment models of the distribution of earnings,Journal of Economic Literature,31, 831–80. Sloane, P., Battu, H. and Seaman, P. T. (1999) Overeducation,
undereducation and the British labour market, Applied Economics,31, 1437–53.
Thurow, L. C. (1975)Generating Inequality,Basic Books, New York.
Tsai, Y. (2010) Returns to overeducation: a longitudinal analysis of the U.S. labor market,Economics of Education Review,
29, 606–17.
Verdugo, R. R. and Verdugo, N. T. (1989) The impact of surplus schooling on earnings. Some additionalfindings,Journal of Human Resources,24, 629–43.
Vila, L. and Mora, J. (1998) Changing returns to education in Spain during the 1980s,Economics of Education Review,
17, 173–78.
Weichselbaumer, D. and Winter-Ebmer, R. (2005) A meta-ana-lysis of the international gender wage gap, Journal of Economic Surveys,13, 479–511.
Weichselbaumer, D. and Winter-Ebmer, R. (2006) Rhetoric in economic research. The case of gender wage differentials,