University of Huddersfield Repository
Masoud, Yusef Yakhlef
The contribution of economics to understanding environmental cost: A case study of the Libyan cement industry, 1988-2008
Original Citation
Masoud, Yusef Yakhlef (2012) The contribution of economics to understanding environmental cost: A case study of the Libyan cement industry, 1988-2008. Doctoral thesis, University of
Huddersfield.
This version is available at http://eprints.hud.ac.uk/17526/
The University Repository is a digital collection of the research output of the University, available on Open Access. Copyright and Moral Rights for the items on this site are retained by the individual author and/or other copyright owners. Users may access full items free of charge; copies of full text items generally can be reproduced, displayed or performed and given to third parties in any format or medium for personal research or study, educational or not-for-profit purposes without prior permission or charge, provided:
• The authors, title and full bibliographic details is credited in any copy; • A hyperlink and/or URL is included for the original metadata page; and • The content is not changed in any way.
For more information, including our policy and submission procedure, please contact the Repository Team at: [email protected].
The contribution of economics to understanding environmental cost:
A case study of the Libyan cement industry, 1988-2008
Yusef Yakhlef Masoud
A thesis submitted to the University of Huddersfield in partial fulfilment of the requirements for the degree of Doctor of Philosophy
i
The contribution of economics to understanding environmental cost:
A case study of the Libyan cement industry, 1988-2008
This study considers how an increase in production costs following an action to reduce environmental pollution would be shared between the producer and the consumer. As such, it makes an interesting contribution to the literature on environmental economics by discussing, and modelling, how such a cost increase would be shared between the producer and the consumer. Producers might be more willing to undertake pollution control given that they are more than likely not going to have to bear all of the control cost. Consumers would bear some of that through a price increase. They would need to recognise that they should accept some of the responsibility for pollution control through higher prices that contribute to the cost of installing ‘cleaner’ production methods.
The method used in the study is a descriptive and analytical (time series analysis and the application of microeconomic analysis tools) to determine the potential effects of environmental policy on the case study company. In essence, the study calculates price elasticities of demand and supply and applies an appropriate value for the cost of environmental improvement. Then the relative elasticities are used to determine producer and consumer shares of the cost increase.
The student has selected one of the major cement producers in Libya – the Ahlia Cement Company and studied four of their cement manufacturing plants. He spent three months working with the plant managers to compile a database of costs and revenue; this data being previously unavailable in this form. Data was collected for the period, 1988-2008. The environmental cost used in the estimation is drawn from their company accounts.
The study starts by setting the world context for cement production, and pollution, and then puts Libyan environmental policy into that wider context. It then concentrates on the four separate cement manufacturing plants within the Ahlia Cement Company.
The specific lessons that can be drawn for managing environmental improvements in the Libyan cement industry can be extended somewhat to other Libyan industries and the wider global environment.
ii
Copyright Statement
i. The author of this thesis (including any appendices and/or schedules to this thesis) owns any copyright to it (the “Copyright”) and he has given the University of Huddersfield the right to use such Copyright for any administrative, educational and/or teaching purposes.
ii. Copies of this thesis, either in full or in extracts, may be made only in accordance with the regulations of the University Library. Details of these regulations may be obtained from the Librarian. This page must form part of any such copies made. iii. The ownership of any patents, designs, trademarks and any and all other intellectual property rights except for the Copyright (the “Intellectual Property Rights”) and any reproductions of copyright works, for example graphs and tables (“Reproductions”), which may be described in this thesis, may not be owned by the author and may be owned by third parties. Such Intellectual Property Rights and Reproductions cannot and must not be made available for use without the prior written permissions of the owner(s) of the relevant Intellectual Property Rights and/or Reproductions.
iii
Contents
Chapter One Introduction
1.1. A Historical Overview of Pollution 1
1.2. Pollution caused by the world cement industry 2
1.3. The pollution caused by the cement industry in Libya 4
1.4. The study problem 5
1.5. Study questions 9
1.6. Study Methodology 10
1.7. The study objectives 11
1.8. The importance of the study 11
1.9. Outlines of the study 12
Chapter Two: Theoretical Aspects of the Production Function and Consumer Surplus 13
2.1. Introduction 13
2.2. Discussion on production function 14
2.3. Examples of production function 16
2.4. Discussion on Consumer Surplus 18
2.5. Examples of Consumer Surplus 25
2.6. Conclusion 30
Chapter Three: Literature Review 32
3.1. Introduction 32
3.2. Broad background 32
3.3. Technical Aspects of cement production relevant to pollution production 35
3.4. The Environmental impact of cement manufacturing (Air emissions) 37
3.4.1. Particulate Matter (PM) 38
3.4.2. Sulfur Dioxide (SO2) 39
3.4.3. Nitrogen oxides (NOX ) 40
3.4.4. Carbon Oxides (CO and CO2) 41
3.4.5. Organic Emissions 42
3.4.6. Acid Gases (SO3 and HCI) 42
3.4.7. Cement Kiln Dust (CKD) 43
2B
3.5. 3BThe Environmental impact of Cement Industry 45
4B
3.5.1. 5BImpacts on the earth and agriculture: 45
3.5.2. Limiting or reducing pollution from cement manufacturing: Overview 45
3.5.3. Potential solutions to the pollution production 50
3.5.3.1. Non-hazardous organic and inorganic waste as alternative of fossil fuel 50
3.5.3.2. Hazardous waste 52
3.5.3.3. Reducing pollution through better fuel management 53
6B
3.5.3.4. 7BChanges to core technology 54
3.5.3.5. EU ETS 55
3.5.3.6. Cement Sustainability Initiative 56
3.5.4. Key Environmental Challenges for the Cement Industry in Libya 59
3.5.5. Libyan Local Impact Studies 59
3.6. Conclusion 60
8B
Chapter Four: International conventions and Libyan local laws to reduce the pollution 61
9B
4.1. 10BIntroduction 61
11B
4.2 . 12BConventions, protocols and international treaties that are organised by many international organizations on the protection of environment
62
13B
4.2.1. 14BVienna Convention for the protection of the Ozone Layer 65
15B
4.2.2. 16BMontreal Protocol On Substances that Deplete the Ozone Layer 66
17B
4.2.3. 18BThe Arctic Programme of Monitoring and Assessment (AMAP) 67
19B4.2.4. 20BConvention number 148: The protection of workers from the risks of working environment due to air pollution, noise and vibration.
iv
4.2.5. (The Convention Number 139): Prevention and control of risk because of work as a result of material and causal factors of cancer
68 4.2.6. The convention which gave attention to biological diversity and Cartagena Protocol on
biosafety. United Nations Environment Programme (UNEP)
69 4.2.7. Convention on Long-range Transboundary Air Pollution, Geneva, 13 November, 1979. 70 4.3. Local legal aspects which have been made by Libyan government to reduce the pollution
problem
73 4.4. Local institutions which are constituted by Libyan government for environment protection:
The Technical Centre for Environmental Protection, other initiatives, and, private associations
78
4.4.1. A technical Centre for environment protection: 78
4.5. An environmental perspective to Libya (Prospect for the Blue Plan between 2010- 2025) 85
4.6. Conclusion 85
Chapter Five: History of Cement Industry and Case Study of this Industry in Libya 87
5.1. Introduction 87
5.2. Emergence of the cement industry in Libya 87
5.3. Restructuring of the cement industry in Libya 89
5.4. The Development of the Cement Industry in Libya 91
5.4.1. Development of the Production and Productive Capacities 92
5.4.2. Evolution of Employment 94
5.4.3. Development of Capital 96
5.5. Problems and Obstacles to the Cement Industry in Libya 98
5.6. The Contribution of the Ahlia Cement Company 100
5.6.1. The Emergence of Ahlia Cement Company 100
5.6.2. Structure of the Ahlia Cement Company 101
5.7. The Evolution of Ahlia Cement Company 107
5.7.1. Production Developments and Capacity of Production in the Ahlia Cement Company 107
5.7.2. The Quantity and Value of the Company’s Sales 108
5.7.2.1. The Quantity and Value Evolution of Cement in the Company 108
5.7.2.2 The Sales Quantity and Value Evolution of Lime at the Company 109
5.7.2.3 The Sales Quantity and Value Evolution of Gypsum at the Company 110
5.7.2.4. The Development of Production and Productivity of the Company’s Cement Industry production and cement productive capacities in the Ahlia Cement Company.
111 5.7.2.5. Development of Production the Productive Capacities of Lime Industry with the Ahlia Cement
Company
112
5.7.3 The Employment Evolution in the Company 114
5.8. Conclusion 115
Chapter Six: Methodology 116
6.1. Econometric model for the application of environmental economic policy on the cement industry
116
6.1.1. Introduction 116
6.2. Study questions 117
6.3. Study Approach 117
6.4. The study sample 119
6.5. The Data collection 124
6.5.1. El-Mergheb Cement Plant 124
6.5.2. Libda Cement Plant 126
6.5.3. Zileten Cement Plant 127
6.5.4. Suk El-Khamis Complex 128
6.6. The econometrics approach 129
6.7. The Advantages and disadvantages of this study 133
6.7.1. Advantages 133
6.7. 2. The disadvantages 134
6.8. The application of economic policy on the cement industry in the framework of economic analysis
135 6.9. Analysis of the price elasticity of demand and price elasticity of supply for the cement industry 140
v
6.9.2. Price elasticity of demand 141
6.9.3. Price elasticity of supply 143
6.10. Summary of the methodology 150
6.11. Conclusion 151
Chapter Seven: Analysis and Discussion 153
7.1. Introduction 153
7.2. Estimating the marginal cost function for cement production in the Zileten Cement Factory 155
7.2.1. Introduction 155
7.2.2. Estimating the production function of the cement for the Zileten Cement Factory. 155
7.2.2.1. The Statistical Analysis 159
7.2.1.2. The Economic Analysis 160
7.2.3. Estimating the Function of Cost of pollution control from Cement Production in the Zileten Cement Factory
160
7.2.3.1. The Statistical Analysis 163
7.2.3.2 The Economic Analysis 164
7.2.4. Estimation of the environmental cost rate in the Zileten Cement Factory 165 7.2.5. Analysis of the elasticity of demand price and supply price for cement production at the
Zileten Cement Factory
166 7.2.6. The Analysis of Price Elasticity of demand and supply for the Zileten Cement Factory. 167 7.3. Estimating the Marginal cost of cement production in the Libda Cement Factory 170
7.3.1. The Statistical Analysis 173
7.3.1.2. The Economic Analysis 173
7.3.2. Estimating the Cost of pollution control functions of the cement production in the Libda Cement Factory
174
7.3.2.1. The Statistical Analysis 175
7.3.2.2. The Economic Analysis 176
7.3.3. Estimating the environmental cost rate in the Libda Cement Factory 176
7.3.4. The analysis of the demand price elasticity and the supply price elasticity for cement production in the Libda Cement factory
177 7.4. Estimating the marginal cost of the cement production in the Suk El-Khamis Cement Factories 179 7.4.1. Estimating the production function of cement production in the Suk El-Khamis Cement
Factories
179
7.4.1.1. The Statistical Analysis 182
7.4.1.2. The Economic Analysis 183
7.4.2. Estimating the cost of pollution control function of the cement production in the Suk El-Khamis Cement Factories
184
7.4.2.1. The Statistical Analysis 185
7.4.2.2. The Economic Analysis 185
7.4.3. Estimating the environmental cost rate in the Suk El-Khamis Cement Factories 186 7.4.4. The analysis of demand price elasticity and supply price elasticity for cement production in the
Suk El-Khamis Cement Factories.
187 7.5. Estimating the marginal cost of cement production in the El-Mergheb Cement Factory 189 7.5.1. Estimating the production function of cement production in the El-Mergheb Cement Factory 189
7.5.1.1. The Statistical Analysis 192
7.5.1.2. The Economic Analysis 192
7.5.2. Estimating the Cost of pollution control function of cement production in the El-Mergheb Cement Factory.
193
7.5.2.1. The Statistical Analysis 194
7.5.2.2. The economic Analysis 194
7.5.3. Estimating the environmental cost rate in the Mergheb Cement Factory 195
7.5.4. The analysis of the demand price elasticity and the supply price elasticity for cement production in the Mergheb Cement Factory.
196 7.6.6. Estimating the marginal cost of the cement production in the Ahlia Cement Company 199 7.6.1. Estimating the production function of cement production in the Ahlia Cement Company. 199
7.6.1.1. The Statistical Analysis. 203
vi
7.6.2. Estimating the Cost of pollution control function of the cement production in the Ahlia Cement Company
204
7.6.2.1. The Statistical Analysis 205
7.6.2.2. The Economic Analysis 206
7.6.3. Estimating the environmental cost rate in the Ahlia Cement Company 206
7.6.4. The analysis of the demand price elasticity and the supply price elasticity for cement production in the Ahlia Cement Company
208 7.7. A brief presentation of the production function results about the Ahlia Cement Company and
its factories
209 7.8. A brief presentation of the emission function results about the Ahlia Cement Company and its
factories
210 7.9. The impact of applying an environmental economic policy on cement material production 211 7.10. The impact of applying environmental economic policy on the industries based on cement 212
7.11. Conclusion 212
Chapter Eight: Conclusion 214
8.1. Introduction 214
8.2. The Study Aims 219
8.3. The research questions 220
8.4. The results of the study 222
8.5. The Study Recommendations 223
8.6. Study Contribution 225
8.7. The conclusion 227
vii
Appendices
Appendix One: Permission letter from Head of Libya Culture Affairs in London for Yusef Y Masuod to do a field study and this letter had been sent to Director of Scholarships in Libya.
246
Appendix Two: Permission letter from Head of Libya Culture Affairs in London for Yusef Y Masuod to do a field study and this letter had been sent to all Cement Companies and Cement plants in Libya.
247
Appendix Three: Permission letter from General Director of Administration and Finance of Ahlia Cement Company for Yusef Y Masoud to do a field study.
248 Appendix Four: Confirmation letter from Director of Scholarships in Libya to give Yusef Y
Masoud permission to do field study.
249 Appendix Five: An environmental perspective for Libya (the prospect for the Blue Plan between
2010- 2025)
250 Appendix Six: Unite root testes for data of Zileten Cement Plant (Augmented Dickey-Fuller
test statistic and Phillips-Perron test statistic)
261 Appendix Seven: Unite root testes for data of Libda Cement Plant (Augmented Dickey-Fuller test
statistic and Phillips-Perron test statistic)
265 Appendix Eight: Unite root testes for data of Suk El-Khamis Cement Plant (Augmented
Dickey-Fuller test statistic and Phillips-Perron test statistic)
269 Appendix Nine: Unite root testes for data of El-Mergheb Cement Plant (Augmented
Dickey-Fuller test statistic and Phillips-Perron test statistic)
272 Appendix Ten: Unite root testes for data of Ahlia Cement Company (Augmented Dickey-Fuller
test statistic and Phillips-Perron test statistic)
276
Appendix Eleven: Production function in Zileten Cement factory, 1988-2008. 281
Appendix Twelve: Production function in Libda Cement factory, 1988-2008. 282
Appendix Thirteen: Production function in Suk El-Khamis Cement factory, 1988-2008. 283 Appendix Fourteen: Production function in El-Merghab Cement factory, 1988-2008. 284
Appendix Fifteen : Production function in Ahlia Cement factory, 1988-2008. 285
Appendix Sixteen: Results of the emission function with raw material and the technology cost at Zileten Cement Factory during 1988-2008
286 Appendix Seventeen: Results of the emission function with raw material and the technology cost at
Libda Cement Factory during 1988-2008
287 Appendix Eighteen: Results of the emission function with raw material and the technology cost at
Suk El-Khamis Cement Factory during 1988-2008
288 Appendix Nineteen: Results of the emission function with raw material and the technology cost at
El-Mergheb Cement Factory during 1988-2008
289 Appendix Twenty: Results of the emission function with raw material and the technology cost at
Ahlia Cement Company during 1988-2008
viii
Figures
Figure (1-1) Ahlia Cement Company in Libya. 6
Figure (1-2) El-Mergheb Cement Factory. 7
Figure (1-3) Suk El-Khamis Complex for Cement and Building Material. 7
Figure (1-4) Libda Cement Factory. 8
Figure (1-5) Zileten cement Factory. 8
Figure (2-1) Illustration of the theoretical justfication for a general sales tax. 20
Figure (2-2) Illustration of the total utility. 24
Figure (2-3) Illstration of the consumer’s surplus. 25
Figure (3-2) Illustration of the cement stages 35
Figure (5-1) Restructuring of the cement industry in Libya 91
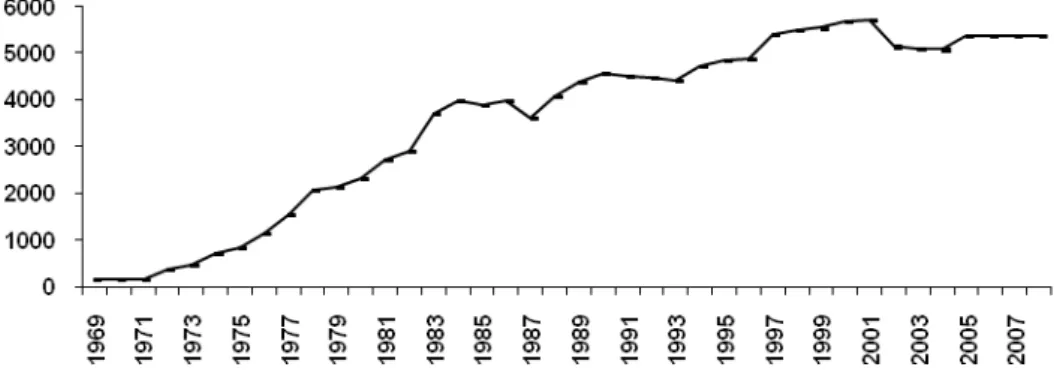
Figure (5-2) The development of production quantity and production energy or capacity for the cement industry in Libya and their development rates during 1969-2008.
93 Figure (5-3) The development employment in the cement industry in Libya and its development
rates during 1969-2008.
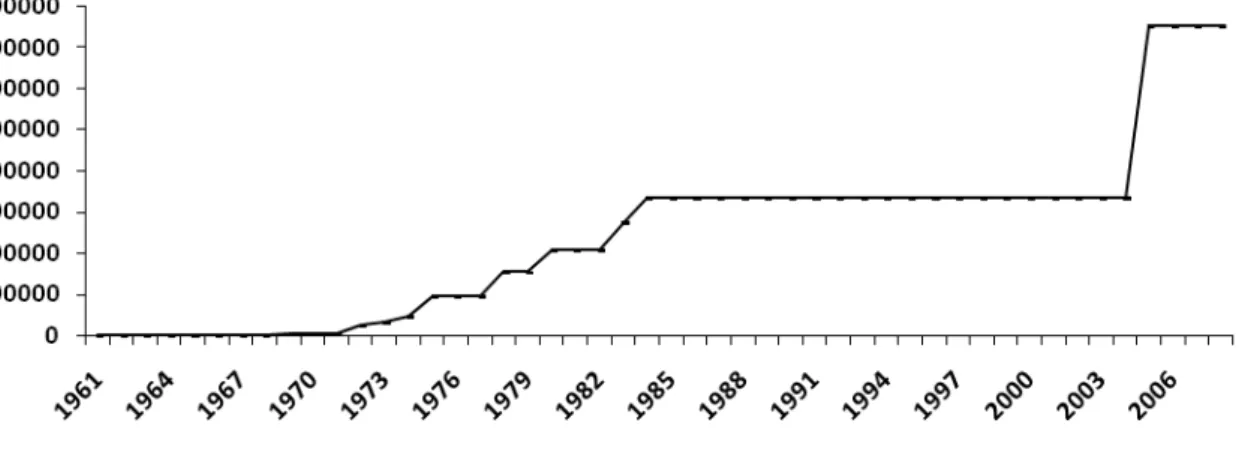
96 Figure (5-4) The development of capital of cement industry in Libya During 1961-2008 98
Figure (5-5) The structure of Ahlia Cement Company 103
Figure (5-6) Organizational structure of the three cement plants which already indicated in above. (Libda, Zileten. and Suk El-Khamis factories)
104
Figure (6-1) Illustration: Choice Method. 118
Figure (6-1) Illustration what happen in the cement industry after the addition of the cost of pollution.
135 Figure (6-2) Illustration of the range of price elasticity of demand on the cement industry (or any
commodity or factory)
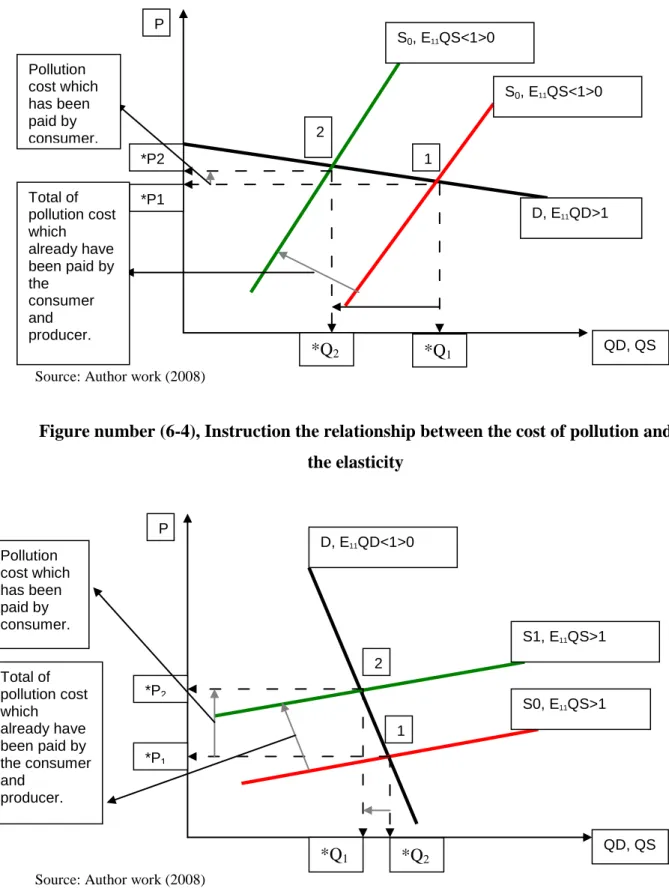
141 Figure (6-3), The relationship between the cost of pollution and the elasticity 147 Figure (6-4), The relationship between the cost of pollution and the elasticity 148 Figure (7-1) The relationship between production quantity, raw material and capital in the Zileten
Cement Factory, 1988-2008.
158 Figure (7-2) The relationship between the production quantity, raw material and capital, the Zileten
Cement Factory 1988-2008. Logarithm value for data
158 Figure (7-3) Technology cost, raw material and cement production in the Zileten Cement Factory
1988-2008.
162 Figure (7-4) The relationship between the production quantity, raw material and capital, 1988-2008. 172 Figure (7-5) The relationship between the emission amount, raw material and the technology cost,
1988-2008.
172 Figure (7-6) The relationship between the production quantity, raw material and capital of the Suk
El-Khamis Cement Factories, 1988-2008.
181 Figure (7-7) The relationship between the emission amount, raw material and technology cost of the
Suk El-Khamis Cement Factories, 1988-2008.
181 Figure (7-8) The relationship between the production quantity, raw material and capital of the
El-Mergheb Cement Factory, 1988-2008.
191 Figure (7-9) The relationship between the emission amount, raw material and technology cost of the
El-Mergheb Cement Factory, 1988-2008.
191 Figure (7-10) The relationship between the production quantity, raw material and capital of the Ahlia
Cement Company, 1988-2008.
202 Figure (7-11) The relationship between the emission amount, raw material and technology cost of the
Ahlia Cement Company, 1988-2008.
ix
Tables
Table (1-1) Details of the Libyan Cement Factories (in order of starting production) 9 Table (3-1) Illustrating key environmental issues from the cement industry. 36
Table (3-2) Emissions and residuals (per ton of cement). 37
Table (3-3) Standard Characterization of Particulate Matter. 39
Table (3-4) Average CKD composition. 44
Table (3-5 ) Studies that consider environmental damage directly to land, humans and buildings. 45 Table (4-1) Illustrative examples of the international conventions and treaties concluded by
international organizations, alphabetical and then by date.
63 Table (4-2) Illustrative Libyan legislations and laws on environment protection. 75 Table (4-3) Illustrative Decisions made by the Libyan government to protect the environment. 76 Table (4-4) Illustration of the conventions adopted by Libyan government specifically concerning
air protection and the ozone layer.
77 Table (4-5) Illustrative Convention and International Treaties concerned with which had been
concluded by Libyan Government to reducing the pollution and concluded by the Libyan Government.
77
Table (5-1) The development of production quantity and production energy or capacity for the cement industry in Libya and their development rates during 1969-2008.
92 Table (5-2) Development of employment in the cement industry in Libya and its development rates
during 1969-2008.
94 Table (5-3) Development of capital in the cement industry in Libya During 1961-2008. 97 Table (5-4) The development of quantity of cement sales and its growth rate at the Ahlia Cement
Company during 1988 – 2008.
108 Table (5-5) The development of quantity and value of lime sales and its growth rate at The Ahlia
Cement Company during 1988 – 2008.
109 Table (5-6) The development quantity and value of gypsum sales and its growth rate at The Ahlia
Cement Company during 1988 – 2008.
110 Table (5-7) The Production Capacity of the Company in Cement Production Area and its Growth
Rate during 1988 – 2008.
111 Table (5-8) The Production Capacity of the Company in Lime Production Area and its Growth Rate
during 1988 – 2008.
112 Table (5-9) The production capacity of the company in gypsum production area and its growth rate
during 1988 – 2008.
112 Table (5-10) The development of national and foreign employment and its growth rate at The Ahlia
Cement Company during 1988 – 2008.
114 Table (6-1) Rationale for research method and their relationship to the previous studies. 140 Table (6-2) Illustration of the scenario about, who will pay the cost of pollution the consumer or
producer or both.
146 Table (7-1) The basic variables to measure and calculate a cement production function for the
Zileten Cement factory during 1988-2008 (Libyan Dinars.)
157
Table (7-2) Production function the Zileten Cement factory, 1988-2008. 159
Table (7-3) Raw material and technology costs in the Zileten Cement Factory during 1988-2008 (Libyan Dinars).
161 Table (7-4) Illustrates the results of the emission function with raw material and the technology cost
at the Zileten Cement Factory during 1988-2008
163
Table (7-5) 7.2.3.1. The Statistical Analysis 163
Table (7-6) illustrated the environmental cost distribution (It could be used this distribution for any sort of businesses)
167 Table (7-7) The elasticity of demand price and supply price for cement production in the Zileten
Cement Factory
168 Table (7-8) Main variables for measurement of the production function and the pollution function in
the Libda Cement Factory, 1988-2008 (Libyan Dinars.).
170 Table (7-9) The results of the production function in the Libda Cement Function during 1998-2008. 173 Table (7-10) The results of the emission function in the Libda Cement Function, 1993-2008. 175 Table (711) The elasticity of demand price and supply price for cement production in the Libda
Cement Factory.
178 Table (7-12) Main variables for measurement of the production function and the pollution function in
the Suk El-Khamis Cement Factories during 1988-2008 (Libyan Dinars.).
x
Table (7-13) The results of the production function for the Suk El-Khamis Cement Factories, 1991-2008.
182 Table (7-14) The results of the emission function in the
Suk El-Khamis Cement Factories, 1997-2008.
184 Table (7-15) Main variables for measurement of the production function and the pollution function in
the El-Mergheb Cement Factory, 1988-2008 by (Libyan Dinars.).
190 Table (7-16) The results of the production function in the El-Mergheb Cement Factory, 1991-2008. 192 Table (7-17) The results of the emission function in the El-Mergheb Cement Factory, 1997-2008.
Table (7-18) The elasticity of demand price and supply price for cement production in the Mergheb Cement Factory, 1988-2008.
197 Table (7-19) Main variables for measurement of the production function and the pollution function in
the Ahlia Cement Company, 1988-2008 (Libyan Dinars.).
201 Table (7-20) The results of production function for the Ahlia Cement Company, 1991-2008. 203 Table (7-21) The results of the emission function in the Ahlia Cement Company, 1988-2008. 205 Table (7-22) The elasticity of demand price and supply price for cement production in the Ahlia
Cement Company, 1988-2008.
208 Table (7-23) A brief presentation of production functions (CP) results in the Ahlia Cement Company
and its factories
210 Table (7-24) A brief presentation of the emission functions (MP) results in the Ahlia Cement
Company and its factories.
xi
Acknowledgements
I am very grateful to my supervisors Mr John Day & Dr Julia Meaton and
the Allah Cement Company, for their efforts and guidance throughout the
entire research.
Special thanks are addressed to Ahamemmed Omer Ahamemmed , Ali
Kalf-Allah , Ahamed Al-Dhaash & Fathihe Abo-shafa and all the workers
in Ahlia Cement Company and its factories for their help.
xii
Dedication
This Thesis is dedicated to my parents, brother, sisters, my wife & my
daughters Ruba and Lien. With Love and Respect.
1
Chapter One Introduction
1.1. A Historical Overview of Pollution
Humankind has had a major role in causing environment pollution, and people have been creating waste since ‘pre-history’. In those early days, the waste was burned, put into the water, buried in the ground or was piled on the surface. Since the waste from these early civilisations was mostly food waste or other organic material, it was easily broken down through natural decay. Equally importantly, the population was small and they were distributed over large areas of land. As a result, pollution was not an issue.
The spread of pollution started when groups of people began living together in cities, where unhealthy practices and the polluting of water resources caused a spread of collective epidemics in many ancient cities. These became the more serious, or dangerous, environmental problems of the eighteenth century and the beginning of the nineteenth century. An obvious role was played by the industrial revolution, which began in England and then spread to other European countries and North America. This period being characterized by the development of factories and urban crowding by those employed in the industrial sector.
The factories during the industrial revolution derived most of their energy from coal and most of the houses of the cities used coal as heating fuel. The burning of this coal led to the pollution of urban environments with smoke and soot. Poor health facilities and the contamination of drinking water resources in the cities by sewage led to typhoid fever and other diseases, and urban living become a significant health risk.
In the United States air pollution started to become a significant risk at the beginning of the twentieth century, by the 1930s many cities in the Middle East and the West
2
had filled their atmosphere with smoke and soot emitted from the cement factories, steel factories, power stations and railway stations .
Although technological developments and the discovery of new, less obviously environmentally damaging fuels has led to the improvement of urban environments around the world, there are still many environmental problems that need attention. These problems include “outdoor urban smog, indoor air pollution, acid deposition, Antarctic ozone depletion, global ozone reduction and global warming“ (Jacobson, 1998). Although pollution has many sources (including natural phenomena) it is clear that industry can and does have a large and dangerous impact on the environment. The particular industry explored in this thesis is the cement industry.
1.2. Pollution caused by the world cement industry
In the booming economy that extends from Asia to Eastern Europe, cement is the raw material of progress. It is both capable of keeping other building elements together as well as being used to make concrete, and so cement is an essential component in buildings. As the world has developed the use of cement has increased and this is exemplified by the fact that China alone consumes 45% of global cement production, and Ukraine, a smaller emerging economy, has doubled the volume of production during the last decade. The demand for cement has therefore risen, and this is exacerbated by the non-recyclability of the product. (Ashargalawst, 2007) Until recent times the dust and soot from cement plant chimneys was considered the most important, and serious, environmental problem in the cement industry. However, since the late 1980s / mid 1990s, a widening list of pollutants has come to the notice of scientists, citizens and legislators, which include the following (Aboud 2005):
- Nitrogen Oxide (NO2): Formed when nitrogen (N2) combines with oxygen (O2) in the burning of fossil fuels, as well as from the natural degradation of vegetation, and the use of chemical fertilizers. NOx gases are a significant component of acid deposition and a precursor of photochemical smog. (Coal.ca, 2008). Also, harmful gases (which contribute to acid rain and global
3
warming) are emitted as a by-product of fossil fuel combustion.(En.Mimi.hu, 2008)
- Sulphur oxides (SO2): A family of gases, including sulphur dioxide (SO2) formed when sulphur, or fossil fuels containing sulphur, burn in air. Airborne sulphur compounds may be converted to other substances which contribute to acid deposition. (Coal.ca, 2008)
- Carbon monoxide (CO). A colourless odourless poisonous flammable gas formed when carbon compounds burn incompletely because there is not enough oxygen. Also produced by the action of steam on hot carbon and used as a reducing agent in metallurgy and as a fuel. (Thefreedictionary, 2007)
- Hydrocarbons. A class of compounds containing hydrogen and carbon formed by the decomposition of plant and animal remains, including coal, mineral oil, petroleum, natural gas, paraffin, the fossil resins and the solid bitumens occurring in rocks. Gasoline is a mixture of hydrocarbons. (Coal.ca, 2008)
- Dioxins and furans. Dioxin is the general collective term for chlorinated aromatic compounds, consisting of a group called polychloro dibenzo-p-dioxins and polychloro dibenzofurans. The first group (PCDDs) consists of 75 and the second (PCDFs) of 135 congeners. The characteristic of all the compounds is a high melting point, a low vapour pressure, low water solubility and a reasonable solubility in and affinity for apolar media. These differences in affinity make it possible to predict where dioxins will occur and how to remove these compounds. (Seys, 2009)
- Carbon dioxide: A colourless, odourless, non-toxic radiative gas that is essential to plant and animal life. It is also emitted as a result of burning organic materials, including fossil fuels. It is the main greenhouse gas contributing to climate change, arguably the world’s greatest environmental problem. (Coal.ca, 2008).
4
1.3. The pollution caused by the cement industry in Libya:
Cement production in Libya faces many of the problems found in both the developed and the developing world. The industry is fundamental to the success of Libya’s attempt to industrialise and will necessarily have a negative impact on the environment both globally and locally. Whilst there are a variety of methods for reducing these impacts, the problem is how these methods might be implemented and, arguably, most importantly, who will pay for any ameliorating efforts.
International awareness, concern and interest in the impact of industry on the environment (and specifically the impact on climate change) is increasing and has taken on global dimensions. Concern is confined not only to industrialized countries but also has spread to developing countries, although progress in some of these areas has been woefully slow. Arabia (1998) argued that decision makers in many developing countries did not study the environmental impacts of a project for three main reasons:
(1) The belief that the preparation of these studies could delay the development process
(2) The lack of real awareness of the importance of environmental considerations with some decision makers in these countries.
(3) A dominant belief that such an assessment would result in economic burden on the project.
Libya is a developing country with an economy dependent on oil for both the main source of income and the main source of energy. The general development strategy is aimed both at reducing the reliance on this resource and correcting the structural imbalance (Thatit, 2005). The aim is to secure the necessary time to diversify the national economic structure by using oil revenues to ensure the continuation of economic development and social development through building an industrial sector to be an alternative source of income. Total expenditure on this strategy exceeded 26437.5 million Libyan Dinars during 1980 – 2000 and it is so clear from this spending that the priority was industry, agriculture and transportation. The share of these sectors was 17.4%, 17.2%, and 14.2% respectively (Thatit, 2005)
5
It has been the target of the industrial sector in Libya to achieve a high and sustained rate of industrial production, to use local raw materials and to reduce dependence on imports, whilst developing the export industry (Alme, 1991).This development will inevitably involve the greater use of cement with even greater impacts on the environment (Jafear, 2005).
1.4. The study problem
Industrial activity causes many types of pollution, including emissions, but also other types of wastes such as oil, grease and solid waste. The effect of this pollution is not limited to the atmosphere but extends to human beings, animals and life in general (Trhone, 2006). In Libya, in recent years, there has been an increase in the number of factories which do not take into account environmental considerations when they are established, and this is in addition to the lack of environmental awareness among the owners of these factories which exacerbates the problem. State owned factories, which are supposed to be designed in accordance with environmental standards, emit pollutants particularly because of the lack of spare parts (because of both the air embargo on Libya and the political and diplomatic problems between Libya and the countries of the developed world) and also the weakness, or lack, of maintenance programmes (Biaa, 2002).
It seems then that Libya (along with many other developing countries) has not fully considered the impact of industrial development on the local and global environments. Although there are many global environmental initiatives and charters concerning pollution, and particularly climate change (e.g. the Kyoto Protocol), it is unclear as to how seriously some countries take on these responsibilities and if how any concerns for these issues are translated into effective management at the country or plant level.
Cement, mining and chemical industries are those that cause significant environmental pollution. If these industries are to be incentivised to address these environmental issues there needs to be an application of economic policy that will
6
result in limiting the damage from such pollution. This thesis explores the potential of one particular economic policy in the context of cement factories given that cement is necessary for almost all developments and installations, and is an essential material for housing projects and building projects.
This study will concentrate on two Libyan companies: the Ahlia Cement Company and the Libyan Cement Company who are the two most important in this industry. (Markise, 2007)
1.4.1. The Ahlia Cement Company is located in the Khoms area and has four factories and a Headquarters Building.
Figure (1-1) Ahlia Cement Company in Libya.
7
Figure (1-2) El-Mergheb Cement Factory.
1.4.1.1. El-Mergheb Cement Factory: It is located in the Khoms area, 120 km to the east of Tripoli with an annual production capacity of 33000 tons and started
production in 1969.
Figure (1-3) Suk El-Khamis Complex for Cement and Building Material.
1.4.1.2. Suk El-Khamis Complex for cement and Building Material: It is located in the Suk El-Khamis Msehel area, 80 km to the south of Tripoli, with annual
production capacity of 1,000,000 tons and started production in 1977. It also produces slaked lime with an annual production capacity of 200,000 tons.
8
Figure (1-4) Libda Cement Factory.
1.4.1.3. Libda Cement Factory: It is located to the east of Tripoli by about 115 km, with annual production capacity of 1,000,000 tons, and it started production in 1981.
Figure (1-5) Zileten cement Factory.
1.4.1.4. Zileten Cement Factory: It is located to the east of Tripoli by about 140 km, with an annual production capacity of 1,000,000 tons and it started production in 1984.
9
1.4.2. The Libyan Cement Company: Has three cement factories as follows: 1.4.2.1. Benghazi Cement Factory: It is located to the east of Tripoli city by about
1000 km with an annual production capacity of 1,000,000 tons and it started production in 1977.
1.4.2.2. Hawwari Cement Factory: It is located beside Benghazi city in Howwari area, with an annual production capacity of 1,000,000 tons and it started production in 1984.
1.4.2.3. Fattaih Cement Factory: It is located to the east of Darrnah city by about 15km, with an annual production capacity of 1,000,000 tons and it started production in 1983.
Table (1-1) Details of the Libyan Cement Factories (in order of starting
production) Serial number Name of cement company Name of factory The date of commencement of production Number of ovens Nominal annual capacity 1 Ahlia El-Mergheb 1969 2 333,000 2 Libyan Benghazi 1977 3 1,000,000
3 Ahlia Suk
El-Khamis 1977 2 1,000,000 4 Libyan Hawwari 1984 2 1,000,000 5 Ahlia Libdeh 1981 1 1,000,000 6 Libyan Fattaeh 1983 1 1,000,000 7 Ahlia Zileten 1984 1 1,000,000 Source: (Snaia, 2005) 1.5. Study questions:
This study aims to answer the following three broad questions:
1.5.1. Is there the possibility that there are some economic instruments that can help our understanding of environmental cost, and, would those instruments suggest how to reduce such environmental costs?
1.5.2. Is it possible to determine the amount of the environmental cost of the cement industry? How is it possible to determine the environmental cost of the cement industry?
10
1.5.3. If we know the (technical) costs that help to reduce the pollution caused by the cement industry, then how would this cost be borne between the producer and the consumer? Would all the costs fall on the consumer or on the producer alone, or would they be shared? If shared then who would bear the most - the producer or the consumer? Or would it be equally shared? Or is there a third party that will be bearing, or part bearing, it such as the government?
1.6. Study Methodology
This study aims to apply micro analysis tools to determine the effects of environmental policies. Appropriate economic analysis tools will be used to identify what happens when a hypothetic environmental economic policy is applied. The method used in this study is both descriptive and analytical. The descriptive element identifies the extent and types of pollution relevant to the industry and sets the context in which the analytical element can suggest the impact of an inevitable increase in production cost on the producer and the consumer.
This study falls under the general framework of research on environmental issues and specifically on industrial pollution and control. This matter has been considered in many studies but not precisely in the way considered in this study. In particular, this will be the first study to focus on, and apply an analytical tool to the cement industry in order to consider the impact of a change in environmental policy to this sector. The study aims to estimate the price elasticity of demand and price elasticity of supply for cement production in order to determine one effect of environmental policy, namely, the relative share of the assumed price increase following a voluntary, or compulsory, adoption of a environmentally improving project with the concomitant increase in cement price. The study uses a unique, and previously unavailable, dataset on production quantity, production inputs, and prices during the study period 1988 – 2008 for the two Libyan cement producers described in section 1.4 above.
11
1.7. The study objectives
This study aims to:
1.7.1. Having identified the general environmental cost of the cement industry to consider a method by which to consider the impact of the cost of environmental improvement on the producer and the consumer.
1.7.2. Know who will bear that environmental improvement cost and their relative share.
1.7.3. Assist decision-makers in the cement industry to know the impact of the environmental improvement costs on cement industry profits and then help them to understand both the magnitude of that cost and what proportion would be borne by them.
1.7.4. Reduce the consumer fear that they will bear the whole of an environmental protection / improvement cost. For normal demand and supply curves, the final cost will be shared.
In order to achieve these objectives, the research was concerned with the development of an economic model that estimated the production function for four Libyan cement plants (operated by the Ahlia Cement Company) and the demand curve for the primary consumer of the product within the Libyan marketplace.
1.8. The importance of the study
This study is important because environmental degradation is one of the most critical contemporary issues associated with economic growth. This study highlights the industrialization experience in Libya, and how this development as part of the overall strategy for economic development, has, perhaps by necessity paid little regard to environmental issues. The focus is on a major sector that drives such development – the cement industry. Whether at the University research level or at the published studies level in professional journals it is anticipated that this research will deepen environmental awareness.
12
1.9. Outlines of the study
Chapter One has introduced the topic and the context in which it will be studied. Chapter Two theoretical of the Production Function and Consumer Surplus. Chapter Three and Four will be further developing the context, by looking at international and local literature on international conventions and treaties and laws of Libya with its resolutions to reduce the environmental pollution. Chapter Five will be focused on History of Cement Industry with a Case Study of Ahila Cement Company in Libya. Chapter Six presents the methodology employed. Chapter Seven presents analysis and discussion and chapter Eight will provide a discussion of the conclusions drawn from the research.
13
Chapter Two
Theoretical of the Production Function and Consumer Surplus 2.1. Introduction
“Production is one of the main focuses in economics. Production theories have existed
long before Adam Smith, but were only refined during the late 19th century. When concerned with a one output firm the production function is a very simple construct. It explains the technology available to a firm. It tells us the maximum quantity of an output that can be produced using various combinations of inputs given certain knowledge. We can think of the production function as a type of transformation function where inputs are transformed into output. In principles of economics courses, we normally assume that only two inputs exist, labour and capital, this is for pedagogical simplicity only. In most production cases there exist many different types of inputs that are instrumental in the production process. As we will see later in this chapter, many of the production functions developed can be extended to a multi-input scenario”. (Berndt and Laurits, 1973; and Gordon, 2011)
“In economics a crucial distinction is made over the difference between the short run
and long run. In some business disciplines, such as finance, a short term asset is considered one that has a maturity of a year or less and a long term asset is one with a maturity greater than a year. In economics, calendar time is not relevant in production theory. Time periods are dealt with in the following manner. The short run is considered that time period where at least one input used in the production process is fixed. This means that it cannot be increased nor decreased. The long run is considered that time period where all inputs are variable, no inputs are fixed. We will ignore the case of a quasi-fixed input. When using the simple case where only capital and labour are used it is customary to assume that capital is fixed in the short run, thus only labour can be used to change the selected level of output. The normal graphical aid used in showing this relationship is entitled a total product curve where product is short for the quantity of production. When we enter into the long run production isoquants indicating various levels of output take the place of the role played by the total product curv
e
”(Berndt and Laurits, 1973).14
“Several types of production functions exist. One way to categorize them is they are
either fixed or flexible in form. Other common properties that can be categorized are also very important in economics. These include the type of returns to scale a production function exhibits, the elasticity of substitution and whether or not it is constant across output levels, the homogeneity, the homotheticity and the reparability of the functions (Gordon, 2011). Moreover, will be show in this chapter a brief background on consumer surpluses as well.
2.2. Discussion on the production function
“Economics did not begin to become a separate discipline of academic study until at
least the time of Adam Smith. Even then it was thought of in more general terms than we think of the discipline today. The history before Adam Smith is not deficient of economic writings though. Various Roman and Greek authors have addressed many issues in economics included cursory attention to production and distribution. The Scholastics, including Saints Augustine and Thomas Aquinas, also devoted substantial time to economic matters including discussion and inquiries into production. Several authors associated with the Mercantilist and Physiocratic schools of thought also paid even more careful attention to matters of production in the economy. For example, Anne Robert Jacques Turgot, a member of the Physiocrats, is credited with the discovery around 1767 of the concept of diminishing returns in a one input production function. Of course Adam Smith himself devoted much time to issues concerning productivity and income distribution in his seminal 1776 book The Wealth of Nations (Christenson, 1973;, Laurits et al, 1973; Gordon, 2011).
“The Classical economists who immediately followed Smith expanded on his work in
the area of production theory. In 1815 Thomas Malthus and Sir Edward West discovered that if you were to increase labour and capital simultaneously then the agricultural production of the land would rise but by a diminishing amount. They both in effect rediscovered the concept of diminishing returns. David Ricardo later adopted this result in order to arrive with his theory of income distribution when writing his economic classic the Principles of Political Economy. The Marginalists also dabbled in the area of production. During the late 1800s W. Stanley Jevons, Carl
15
Menger and Leon Walras all incorporated ideas of factor value into their writings. What these early post-Smith economists all had in common is that they all used production functions that were in fixed proportions. In other words the capital to labour ratios were not allowed to change as the level of output changed. Although interesting, in practice most production functions probably exhibit variable proportions“. (Brue and Randy, 2007; Chambers, 1988; and Christenson et al, 1973).
“In the 1840s J. H. von Thunen developed the first variable proportions production
function. He was the first to allow the capital to labour ratio to change. Von Thunen noticed that if we were to hold one input constant and increase the other input then the level of output would rise by diminishing amounts. In other words he applied the concept of diminishing returns to a two input, variable proportions production function for the first time. An argument could definitely be made that he is the original discoverer of modern marginal productivity theory. His work never received the attention it deserved though. Instead during 1888 American economist John Bates Clark received credit for being the founder of marginal productivity theory based on his speech at the American Economic Association meetings that year. Shortly after in 1894 Philip Wicksteed demonstrated that if production was characterized by a linearly homogeneous function (in other words one that experiences constant returns to scale) then with each input receiving its marginal product the total product would then be absorbed in factor payments without any deficit or surplus. Around the turn of the century, Knut Wicksell produced a production function very similar to the famous Cobb-Douglas production function later developed by Paul Douglas and Charles W. Cobb. Unfortunately this was never published in any academic journal and thus he never received any credit for the development of what Cobb and Douglas rediscovered in 1928“. (Berndt and Laurits,
1973; Berndt and Laurits; 1973; Brue, Stanley and Randy, 2007).
“In 1937 David Durand built upon the popular Cobb-Douglas production function.
The Cobb-Douglas function assumed an elasticity of scale equal to one. In other words the exponents in their function summed to one. Durand assumed fewer restrictions on the values of the exponents. He allowed for their sum to be less than,
16
greater than or equal to one. This meant the elasticity of scale was no longer restricted to one. The production function could now exhibit increasing or decreasing returns to scale in addition to constant returns to scale”.
“One other restriction on the Cobb-Douglas production function involved the
elasticity of substitution. It assumed the value for this elasticity was equal to unity. In 1961, Kenneth Arrow, H.B. Chenery, B.S. Minhas and Robert Solow developed what became known as the Arrow-Chenery-Minhas-Solow or ACMS production function. Later in the literature this became known as the constant elasticity of substitution or CES production function. This function allowed the elasticity of substitution to vary between zero and infinity. Once this value was established it would remain constant across all output and/or input levels. The Cobb-Douglas, Leontief and Linear production functions are all special cases of the CES function. In 1968 Y. Lu and L.B. Fletcher developed a generalized version of the CES production function. Their variable elasticity of substitution function allowed the elasticity to vary along different levels of output under certain circumstances“. (Arrow et al, 1971;
& Gordon, 2011).
“Recently there have been many developments with flexible forms of production functions. The most popular of these would be the transcendental logarithmic production function which is commonly referred to as the translog function. The attractiveness of this type of function lies in the relatively few restrictions placed on items such as the elasticity of scale, homogeneity and elasticity of substitution. There are still problems with this type of function however. For example, the imposition of separability on the production function still involves considerable restrictions on parameters which would make the function less flexible than thought. The search for better, more tractable production functions continues”.(Berndt and Laurits, 1973; Berndt, and Laurits, 1973; Brue and Randy, 2007; Chambers, 1988; Christenson, Laurits et al, 1973; and Gordon, 2011).
17
In last few years there are many studies on production functions, which is considered to be the most important economic instruments which will help to understand some of the economic effects at the microeconomic, macroeconomic and international economics levels, but as a consequence of its plentiful and widely varying aspects of its application, it become necessary to choose a number of them to illustrate the importance of a reliable measure to understand and determine the economic effects on the individual and the state. These studies are as follows:
The first study has been carried out by Growiec (2008) on production functions and distributions of unit factor productivities: Uncovering the link. Growiec derives a reversible "endogenous technology choice transform," according to which firm-level production functions and distributions of unit factor productivities are two sides of the same coin. The Cobb-Douglas function relates to Pareto distributions, and the CES to Weibull distributions.
Another study by Shields & Shields (2009) concerns estimating external returns to education in the US: a production function approach, and, the study is based on an explicit production function of the form suggested by Lucas. Strong evidence of the presence of external benefits to education for the US is found.
Another study has been done by Klump and Saam (2008) about the calibration of normalised CES production functions in dynamic models. Normalising CES production functions allows one to choose technology parameters of dynamic models in a plausible way.
Another study by Hong, Lee and Hwang (2011), is about Metafrontier Production Function Analysis of Horizontal and Vertical Integration in Korea's Cable TV Industry. With its remarkable growth, the cable TV industry has witnessed increasing business integration continuously. This study categorizes technology-based operators into three groups on the basis of business integration—vertically integrated, horizontally integrated, and isolated system operators, and estimates the efficiency of each group. In addition, metafrontier analysis is employed to compare the efficiencies of the groups. The results
18
suggest that vertically and horizontally integrated system operators can improve technical efficiency by accomplishing economies of scope and scale, respectively.
Another study has been done by Thornton, (2002) on ‘Estimating a health production function for the US: some new evidence’. This study reports some new evidence on the impact of medical care, socioeconomic, lifestyle and environmental factors on the health status of the population of the USA. The results show that additional medical care utilization is relatively ineffective in lowering mortality and increasing life expectancy. The most important factors that influence death rates are related to socioeconomic status and lifestyle.
Another study has been done by Alonso-Rodriguez, (2000) about VARMA modelling of the production function. This paper models the elements of the production function by VARMA methods to gain empirical insight on which element leads the other. At the same time, we look for the possibility of detecting any characteristic which could help to differentiate between developed and developing economies.
From above studies it can be noted that the production function is an effective tool to deal with varieties of economic problems in general, and at the microeconomic level in the specific.
2.4. Discussion on Consumer’s Surplus
Consumer's surplus denotes the difference between the maximum amount of money a consumer would be willing to pay for a product or service and the amount he actually pays. The term was first introduced into economics by Alfred Marshall in his Principles of Economics, but the first person to enunciate the idea in a precise way appears to have been Jules Dupuit, a French engineer, in a paper published in 1844. Rudolf Auspitz and Richard Lieben (who knew of Dupuit's work but not Marshall's) gave an account of consumer's surplus in 1889 in their book Untersuchungen über die Theorie des Preises (”Investigations on the Theory of Price”); but their work was neglected, and it was Dupuit, and above all Marshall,
19
who influenced modern economists”. (Auspitz and Lieben, 1889; Dupuit, 1952;
Dupuit, 1962; Marshall, 1949; Marshall, 1961; and Houghton, 1958).
“Dupuit's work on utility theory appears to have derived from his interest in a
contemporary debate concerning the financing of public enterprises. What was required, he realised, was a measure of utility that could be used in judging the worth of public works. He saw that J. B. Say's use of exchange value as a measure of utility was incorrect and pointed out that Say himself had advocated a method for determining whether public works were justified (this was to multiply output, or volume of traffic, by the diminution in costs) which did not involve his own utility measure but which was none the less quite wrong. Say's errors he attributed to a disregard of Smith's distinction between value-in-use and value-in-exchange. Dupuit, having a clear conception of the law of diminishing marginal utility, found no difficulty in the paradox of value. He pointed out that price cannot be relied upon to indicate total utility, which must be measured, albeit imperfectly, in terms of money. The total utility of an object may be estimated, he showed, by what a consumer would take to go without it, or (and he implied that this is the same thing) how much he would pay rather than go with-out it. The difference between this amount and the total price actually paid, which may be measured by the product of a finely graduated tax, Dupuit called utilite relative, in reality, it is of course Marshall's consumer's surplus. Dupuit discovered two "laws" of demand: the one (which we now recognise as the ‘Giffen’ exception), that as price falls the quantity purchased tends to increase; the other, that this increase is larger the lower the price at which the fall occurs. The second law was derived from the pyramidical structure of society: at each successive stage in a series of price reductions the demand of an ever larger class of consumers becomes effective. Dupuit therefore conceived the shape of the demand curve for a commodity to be typically that drawn in the diagram reproduced below. The source of the diagram – Houghton, having in his words, “Solely for the convenience of following customary practice, I have reversed Dupuit's axes”. He used this diagram to illustrate "utilite relative" and to demonstrate some of Dupuit’s applications of the concept. He provided a complete theory of discrimination, illustrated copiously with examples from railway tariffs and other sources; he analysed appropriate pricing
20
policies for a private and a public monopolist; and he showed, too, how discriminatory charging might make profitable an enterprise which, if it charged a single price for its product, would make losses. Another interesting application involves the Dupuit taxation theorem”. This is illustrated also on the diagram below.
“Assuming for the purpose a constant rate of decline in consumption as price rises,
Dupuit showed that the loss of utility due to the imposition of a tax on a commodity is proportional to the square of the tax rate. It follows from this that it is better to spread indirect taxes over a large number of commodities than to concentrate outlay taxes on a few particular goods. This is probably the first theoretical justification for a general sales tax”. (Houghton, 1958)
“Dupuit's consumer's surplus analysis came in for heavy criticism from Walras.
Although he recognised that Dupuit deserved high praise for his work on discriminatory pricing Walras found him guilty of a "capital error" in confusing demand and utility curves. Since Dupuit's utility measures were involved in this confusion, Walras concluded that the whole of his utility measurement analysis was vitiated and, having repeated almost exactly Bordas' objections to the method, his final judgment was that "Dupuit's theory is no improvement. This was not only an astonishingly bad assessment by a theoretician who is regarded by some as the greatest in economics, but it was framed in highly misleading terms. Dupuit's implied
21
confusion of demand and utility curves was of course a much less serious blunder than Walras believed”.
“Moreover, as we have seen, Dupuit, in his reply to Bordas, if not earlier, showed a
clear appreciation of many of the points which Walras accused him of having overlooked. It was most remiss of Walras that, having criticised Dupuit's work on utilite relative quite destructively, he did not offer a correct formulation. He either ignored or failed to appreciate the truth, so clearly expressed by Johnson, that the general problem of maximising utility is applicable just because there is this surplus”.
“The notions of producers' and consumers' benefits from trade (Marshall's producers'
and consumers' rents) were first discussed in print, in England, by Jenkin, who used a graphical analysis to illustrate how these might be measured. Jenkin believed his measures to be "novel". In this, he was only partially correct, of course, but he was certainly the first to publish a discussion of producers' surplus and a demonstration that the amounts of the two surpluses depend, in each case, on the steepness of the appropriate curve. Jenkin applied his results to the problems of the incidence of a commodity tax, showing how the relative losses of producers and consumers due to the tax may be calculated and making the points that each party's loss is greater than the tax it pays and that these losses are greater the higher is the tax rate. Jenkin, however, paid no attention to the concept of the individual consumer's surplus and contributed nothing to the elucidation of the special assumptions required for a satisfactory analysis of this idea”.
“The first significant advance on Dupuit's work came from Vienna. Rudolph Auspitz
and Richard Lieben published their Untersuchungen iiber die Theorie des Preises in 1889, just one year before Marshall's Principles appeared and ten years after his Pure Theory had been privately circulated. In a paragraph added to the preface of a French translation of their work (1914), the surviving author, Lieben, explained that they had no knowledge of the Pure Theory until some time after the first German edition. Since their consumer's surplus analysis was completed by 1889, it clearly can owe nothing to Marshall, and is simply a development of Dupuit's work. Although the
22
treatment of the concept by the two Austrians is in many ways similar to Marshall's, there are some interesting and significant differences. Where these exist, it is by no means the case that the Austrian analysis suffers from comparison”.
“The Auspitz and Lieben investigations into price theory were more thorough than
those of any comparable writer save Walras, with whose general equilibrium analysis their methods were in direct contrast. Philosophically, their approach was a highly sophisticated Jevonsian utilitarianism. They believed that: "les sentiments de l'individu ne sont pas susceptibles de mesure"; and that " encore moins saurait-on comparer Jes sentiments de deux individus". Nevertheless, they took the view that it is possible to measure the small changes in feelings (satisfactions, dissatisfactions) which are important for choice. Their position was that although his subjective evaluation of money changes according to an individual's circumstances, such variations may be disregarded so far as small changes in expenditure are concerned”.
“Auspitz and Lieben were meticulously careful to set out the abstractions necessary to
their method and were at pains to emphasise the conditional validity of their results; in this respect their treatment is undoubtedly more satisfactory than Marshall's. Their three major abstractions from reality, important for consumer's surplus theory, were: that the marginal utility of money does not vary, that tastes remain unchanged, and that other prices remain constant, with respect to variations in the price of a particular commodity. These assumptions were made, not of course because they were believed to be realistic, but purely in the interests of simplicity. Two theorists who were well aware of the intricacies of commodity relatedness and who, it may be noted, made valuable original contributions to analysis in this field, could hardly have agreed lightly on their use. As is well known, Marshall's own assumptions in his consumer's surplus analysis were precisely these of Auspitz and Lieben”.
“One of the most significant features of the Auspitz and Lieben treatment of
consumer's surplus is that they distinguish clearly between the individual and aggregative concepts. The first they measured as a quantity of money and called consumer's profit, the second they treated as an amount of utility which, given their
23
assumptions, could be measured in money terms. In clearly distinguishing between the 'two ideas and in retaining Dupuit's conception of the individual surplus (utilite relative) as a utility difference, the two Austrians again scored over Marshall. The latter defined consumer's surplus in such a way that many interpreters have taken the individual concept to be essentially a money difference, whereas, of course, it is fundamentally a utility difference, which has a unique money measure only when the marginal utility of money is constant. The difference between Marshall and Auspitz and Lieben is that Marshall's definition appears to depend for its meaningfulness on this assumption of constancy, whilst the Auspitz and Lieben definition, like Dupuit's, is perfectly general and only their money measure of the surplus requires the: special assumption that the marginal utility of money is constant”.
“Along the Y-axis (the marginal utility of money being assumed constant) and
quantities of a commodity A are measured along the X-axis (Fig. 2). The curve OA is a total cost curve, vertical distances from the X-axis representing the cost of producing corresponding quantities. OA1 is a total offer curve: its radius vectors are parallel to tangents to OA and along the Y-axis horizontal distances indicate the amounts which would be supplied at prices represented by the slopes of these vectors. ON is a total utility curve and along the X-axis vertical distances represent the utility of corresponding quantities. ON, is a total demand curve: its radius vectors are parallel to tangents to ON, and along the X-axis vertical distances represent total expenditure on X at prices indicated by the slopes of these vectors. The analysis shows (for CZ example) that with an output OZ, sold at price consumers' surplus is CD and producers' surplus CB”.
“Walras was as highly critical of this analysis as he was of Dupuit's work on
consumer's surplus. He pointed out that the four curves can be reduced to two-the Marshall supply and demand curves-and went on to argue that, like Dupuit, Auspitz and Lieben had confused demand and utility curves. Walras concluded that their measure of consumer surplus was therefore wrong and he argued that in conditions of free competition producers' surplus does not exist. In both cases his criticisms seem wide of the mark and the two Austrians appear to have the better of the