PredSL:
A
Tool for the N-terminal Sequence-based Prediction
Protein Subcellular Localization
Evangelia I. Petsalaki, Pantelis G. Bagos, Zoi I. Litou, and Stavros J. Hamodrakas”
Department of Cell Biology and Biophysics, Faculty of Biology, University of Athens, Panepistimiopolis, 15701, Greece.
of
Athens
The ability to predict the subcellular localization of a protein from its sequence is of great importance, as it provides information about the protein’s function. We present a computational tool, PredSL, which utilizes neural networks, Markov chains, profile hidden Markov models, and scoring matrices for the prediction of the subcellular localization of proteins in eukaryotic cells from the N-terminal amino acid sequence. It aims to classify proteins into five groups: chloroplast, thylakoid, mitochondrion, secretory pathway, and “other”. When tested in a five- fold cross-validation procedure, PredSL demonstrates 86.7% and 87.1% overall accuracy for the plant and non-plant datasets, respectively. Compared with Tar- getP, which is the most widely used method to date, and LumenP, the results of PredSL are comparable in most cases. When tested on the experimentally verified proteins of the Saccharomyces cerevisiae genome, PredSL performs com-
parably if not better than any available algorithm for the same task. Rirther- more, PredSL is the only method capable for the prediction of these subcellu- lar localizations that is available as a stand-alone application through the URL: http://bioinformatics.biol.uoa.gr/PredSL/.
words: subcellular localization, prediction, target peptide, transit peptide, signal peptide
Introduction
The subcellular localization of a protein is indica- tive of its function. Most proteins in eukaryotic cells are synthesized in the cytosol and are translocated to various subcellular compartments with the aid of a targeting sequence ( 1 ) . In most cases of mito- chondrial (mTP), chloroplast (cTP), thylakoid lumen (lTP), and secreted proteins (SP), this targeting se- quence is in the N-terminal. There have been efforts to use several types of information towards predicting the subcellular localization of proteins in recent years
( 2 ) , including the use of protein homology ( 3 ) , the whole amino acid composition
( 4 ) ,
quasi-sequence-order effect ( 5 ) , evolutionary and structural infor- mation (6), and the N-terminal targeting sequence
( 7 ) . The techniques used for this purpose include
statistics ( B ) , weight matrices ( 9 ) , text mining (1
a),
and machine learning methods such as support vec- tor machines (SVMs; ref. 11), hidden Markov mod- els (HMMs; ref. 12-14), feed-forward neural networks ( 7 ) , and recurrent neural networks (15). Currently,* Corresponding author.
E-mail: [email protected]48 Geno. Prot. Bioinfo.
the most widely used methods for the prediction of protein subcellular localization are SignalP (16), ChloroP (17), and TargetP ( 7 ) , which use the N-
terminal residues of a sequence and two layers of neu- ral networEs for prediction.
Here, we present a novel approach named PredSL for the prediction of protein subcellular localization based on the presence of an N-terminal targeting sequence, combining several of the techniques men- tioned above. We use the N-terminal targeting se-
quence as it is responsible for the specific targeting of most proteins belonging to the particular subcel- lular localizations. Therefore, we casnsider it to be sufficient to provide a reliable Prediction. Other ap- proaches, using for instance the whole amino acid se- quence for prediction, have been shown to produce higher accuracy in some circumstances, but we did not consider them here. This is because the N-terminal sequence-based prediction also offers a useful biolog- ical insight into the mechanism of prlotein targeting. For instance, a predictor that uses the whole amino acid sequence as input may be biased against par- ticular protein families, reflecting the distinct bio- Vol. 4 No. 1 2006
logical functions of the organelles that they are tar- geted to. While using the N-terminal sequence, we are in accordance (at least for the vast majority of the proteins targeted to the particular subcellular lo- calizations) with the experimentally derived evidence, supporting the idea that the N-terminal sequence is sufficient for the appropriate targeting. The tool de- veloped here classifies proteins into five subcellular localizations (chloroplast, thylakoid, mitochondrion, secretory pathway, and “other”), and is freely avail- able for download, unlike other methods that perform a similar task. It is also freely available for academics on the web.
Results
and
Discussion
The prediction tool was tested using a five-fold cross- validation procedure (Table 1). The comparison of PredSL with TargetP cannot be made in an objec- tive manner, as the datasets used for the training are different. However, comparing the results from the cross-validation of PredSL and the results of TargetP in Emanuelsson et al ( 7 ) , we found that in most cases
the sensitivity, specificity, and Matthew’s correlation coefficient (MCC) achieved by PredSL are compara- ble, if not better. Meanwhile, PredSL has the ad- vantage of offering a prediction for the lumen target- ing peptide (1TP). The results of the 1TP pre$iction, compared to that of LumenP ( I B ) , a module not in- cluded in the TargetP web server, are significantly better. The 1TP prediction (Table 2) was tested on the whole dataset, resulting to 91.9% accuracy, com- pared to 88.8% provided by the LumenP predictor. The cleavage site prediction is also better: 88.7% of the sequences have their 1TP cleavage sites predicted within f 2 residues, compared to 75.1% that the Lu- menP predictor estimates correctly. These results were based on the complete dataset of 259 sequences. On a redundancy reduced dataset of 109 sequences, which was obtained using cd-hit (19) by removing sequences that had more than 40% sequence homol- ogy, we obtained 85.3% accuracy of prediction con- cerning the existence of the lTP, and 82.4% accuracy concerning the prediction of the cleavage site, which are better than the 82.4% and 70.1% accuracy of the LumenP predictor, respectively. When testing with a five-fold cross-validation, we obtained 87.3% accu- racy of prediction concerning the existence of the lTP, and 66.1% accuracy concerning the prediction of the cleavage site, compared to the 87.0% and 54.8% ac-
curacy of the LumenP predictor, respectively. Using a negative test set of 2,400 sequences of the proteins located in the chloroplast but not in the thylakoid lu- men or the membrane, only 5.3% were identified with the 1TP.
In an effort to compare PredSL with the al- ready available prediction tools in a real dataset, we used the information from the YeastGFP database (http://yeastgfp.ucsf.edu). In this publicly available resource, the results of the global analysis of pro- tein localization studies in the budding yeast Saccha-
romyces cerevisiae are deposited, which were obtained
with the use of green fluorescent protein (GFP; ref.
2 0 ) . The comparison was made against TargetP, iP-
SORT, and Predotar, mainly because they are the most commonly used and successful prediction meth- ods and are readily available to the public. TargetP is considered to be the most reliable tool currently avail- able. It consists of two layers of feed-forward artificial neural networks. By using the N-terminal sequence of a protein, it classifies the protein into mitochondrion, chloroplast, secretory pathway, or “other” localiza- tion. iPSORT is one of the oldest available prediction methods ( Z I ) , which is based similarly to TargetP
on identifying N-terminal sorting signals. However, it uses simple empirical rules (charge, hydrophobic- ity, etc.) that are amenable to human intervention
whereas at the same time are interpretable to visual inspection. iPSORT is available to the public also as a web server and as a stand-alone executable appli- cation. Lastly, we used Predotar, which is also based on feed-forward neural networks for identifying the
N-
terminal targeting signals. Predotar is also available as a stand-alone application and its use was also dic- tated by the need to compare our method with other available stand-alone applications.
Table 3 shows that PredSL significantly outper- forms the iPSORT algorithm and it also performs similarly to TargetP and Predotar. Based on the above results tested on an experimentally character- ized genome, it can be assumed that the same will also hold, approximately, for other real-life applica- tions of these software tools. Towards this end, we applied the PredSL algorithm in various completely sequenced genomes of organisms belonging to differ- ent taxonomic groups (plants, fungi, mammals, pro- tozoa, arthropoda, and fishes). The results are pre- sented in Table 4 and are generally in agreement with previously published estimates for the particular or- ganisms. For instance, MITOPRED predicts 4.8%, 4.3010, lo%, 6.3%, and 4% mitochondria1 proteins for
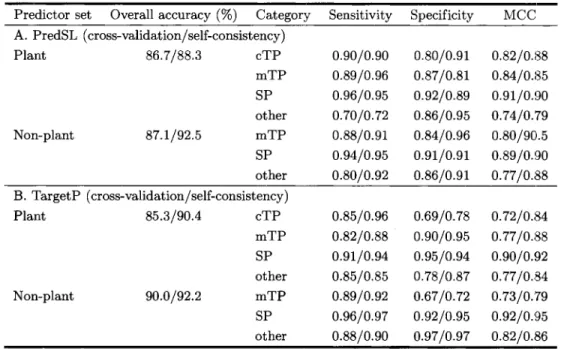
Table 1 Comparison of the Localization Performance of PredSL and TargetP Tested by Five-fold Cross-validation and Self-consistency*
-
Predictor set Overall accuracy (%) Category Sensitivity Specificity MCCA. PredSL (cross-validation/self-consistency) Plant 86.7188.3 cTP 0.90/0.90 0.80/0.91 0.8210.88 mTP 0.8910.96 0.8710.81 0.8410.85 SP 0.9610.95 0.9210.89 0.91/0.90 other 0.7010.72 0.8610.95 0.7410.79 Non-plant 87.1192.5 mTP 0.8810.91 0.8410.96 0.80/901.5 SP 0.9410.95 0.91/0.91 0.89/0.!30 other 0.8010.92 0.8610.91 0.7710.88 B. TargetP (cross-validation/self-consistency) Plant 85.3190.4 cTP 03510.96 0.6910.78 0.7210.84 mTP 0.821038 0.9010.95 0.7710.88 SP 0.9110.94 0.9510.94 0.90/0.92 other 0.8510.85 0.7810.87 0.7710.84 Non-plant 90.0/92.2 mTP 0.8910.92 0.67/0.72 0.7310.79 SP 0.9610.97 0.9210.95 0.9210.95 other 0.8810.90 0.9710.97 0.8210.86
*The PredSL datasets for plant proteins consist of 249 chloroplast sequences, 250 mitochondrial sequences, and 253 secreted proteins’ sequences, whereas for non-plant proteins the datasets consist of 366 mitochondrial sequences and 370 secreted proteins’ sequences. The TargetP datasets for plant proteins consist of 141 chloroplast sequences, 368 mitochondrial sequences, and 269 secreted proteins’ sequences, whereas for non-plant proteins the datasets consist of 371 mitochondrial sequences and 715 secreted proteins’ sequences.
Table 2 Comparison of PredSL and LumenP on the Prediction Accuracy of the 1TP and
Its Cleavage Site*
Dataset 1TP prediction (%) Cleavage site prediction
( k 2 residues) (%)
PredSL LumenP PredSL LumenP
Complete set 91.9 88.8 88.7 75.1 (259 sequences) Reduced set 85.3 82.4 82.4 70.1 (40% similarity) Cross-validation 87.3 87.0 66.1 54.8 (259 sequences)
*Tested by the fivefold cross-validation on the complete dataset (259 sequences) and on a 40% redundancy reduced dataset by cd-hit (109 sequences), respectively.
Table 3 Comparison of PredSL with Other Three Prediction Tools on the Subcellular Localization Prediction of the S. cerevisiae Proteins
Subcellular localization PredSL iPSORT TargetP Predot ar
Total (unknown=2,164) 2,62113,554 (73.7%) 2,40413,554 (67.6%) 2,61613,554 (71.6%) 2,47513,554 (69.6%) Mitochondrion 3011499 (60.3%) 3041499 (60.9%) 306/499 (61.3%) 315/499 (63.1%) Secretory pathway 2241850 (26.4%) 2061850 (24.2%) 2571850 (26.4%) 2041850 (24.0%) Other 2,096/2,305 (90.9%) 1,894/2,305 (82.2%) 2,053/2,305 (89.1%) 1,956/2,305 (84.9%)
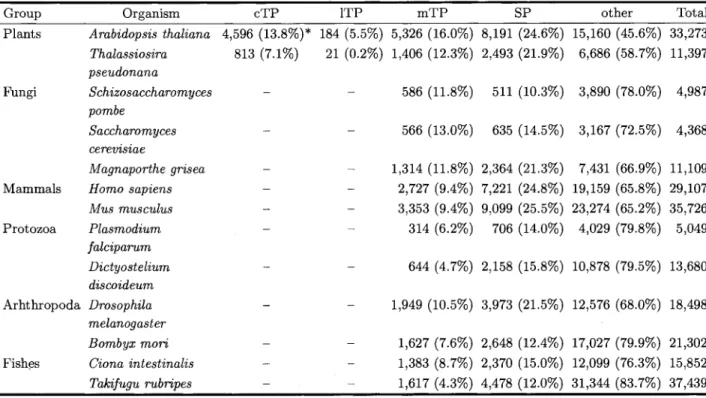
Table 4 Prediction Performance of PredSL on Various Completely Sequenced Genomes from Different
Taxonomic Groups
Group Organism cTP 1TP mTP SP other Total
Plants Arabidopsis thaliana 4,596 (13.8%)* 184 (5.5%) 5,326 (16.0%) 8,191 (24.6%) 15,160 (45.6%) 33,273 Thalassiosira
pseudonana
Fungi Schizosaccharomy ces
pombe
Saccharomyces cerevisiae
Magnaporthe grisea
Mammals Homo sapiens
Mus musculus Protozoa Plasmodium falciparum Dictyostelium discoideum Arhthropoda Drosophila melanogaster Bombyx mori
Fishes Ciona intestinalis Takifugu rubripes 21 (0.2%) 1,406 (12.3%) 2,493 (21.9%) 6,686 (58.7%) 11,397 - 586 (11.8%) 511 (10.3%) 3,890 (78.0%) 4,987 - 566 (13.0%) 635 (14.5%) 3,167 (72.5%) 4,368 - 1,314 (11.8%) 2,364 (21.3%) 7,431 (66.9%) 11,109 - 2,727 (9.4%) 7,221 (24.8%) 19,159 (65.8%) 29,107 - 3,353 (9.4%) 9,099 (25.5%) 23,274 (65.2%) 35,726 - 314 (6.2%) 706 (14.0%) 4,029 (79.8%) 5,049 644 (4.7%) 2,158 (15.8%) 10,878 (79.5%) 13,680 - - 1,949 (10.5%) 3,973 (21.5%) 12,576 (68.0%) 18,498 - - - 1,627 (7.6%) 2,648 (12.4%) 17,027 (79.9%) 21,302 1,383 (8.7%) 2,370 (15.0%) 12,099 (76.3%) 15,852 1,617 (4.3%) 4,478 (12.0%) 31,344 (83.7%) 37,439 *We list the total number of sequences classified in each subcellular location and their percentage in the whole genome.
Homo sapiens, Caenorhabditis elegans, S. cerevisiae, Drosophila melanogaster, and Arabidopsis thaliana,
respectively. These estimates are clearly lower than the ones predicted by PredSL, but it is known that MITOPRED, which also uses profile HMMs derived from domains with known localization to the mito- chondria, shows greater specificity in predicting pro- teins targeted to mitochondria (though without pre- dicting any other localization). This fact was also acknowledged in the respective paper ( 1 3 ) , where the work of Kumar et al (22) was also cited, pointing
to an overall estimate of 13% mitochondria1 proteins in the yeast genome. Similar results were also ob- tained by the recent development of MitPred ( 2 3 ) ,
which also uses profile HMMs coupled with SVM. Chloroplast located proteins in A . thaliana predicted
by TargetP were of the same magnitude (approxi- mately 15% of the genome), whereas proteins targeted to thylakoid were also predicted by LumenP to be more rare (<1%) (24). In another recent work ( 2 5 ) , among the 28,952 protein sequences of A . thaliana
that were tested, TargetP and Predotar respectively predicted 4,780 and 4,582 proteins to be chloroplast localized. Among these proteins, 1,947 were predicted to be chloroplast localized by both predictors. These figures are also in agreement with the results obtained Geno. Prot. Bioinfo.
by PredSL and provide further evidence that, with the combination of the results of many independently developed and reliable predictors, we may have more specific estimates. PredSL thus, could be used in con- junction with the already established methods, and it would be interesting to perform large-scale analyses in order to discover the degree of concordance of the various predictors. In a completely new genome (that is, a genome of an organism with few homologous se- quences to those already used to train the methods), it would be interesting to have the option of using var- ious predictors and obtain different sets of proteins “predicted” to the various subcellular localizations. In this situation, the proteins predicted by all the al- gorithms would be the most “reliable”.
In conclusion, PredSL is currently the only method that performs classification of eukaryotic pro- teins to the five subcellular localizations: chloro- plast, thylakoid, mitochondrion, secretory pathway, and other. It uses a combination of several methods in order to exploit different properties of the amino acid sequence and results to a reliable classification of the proteins. When compared with other available meth- ods such as TargetP, iPSORT, and Predotar, PredSL offers a comparable if not better reliability concerning the translocations of proteins to the chloroplast, the
mitochondrion, and the secretory pathway. Moreover, it offers the option of a reliable prediction of protein targeting to the thylakoids of the chloroplast, a fea- ture not offered by any other publicly available tool. Finally, it is one of the very few tools for subcellular localization prediction that is available for download as a stand-alone application, and it is the only one performing such a classification.
Materials and Methods
Datasets
The training data were extracted from the release 3.5 of UniProt (26). The datasets were initially extracted requiring the keyword “Eukaryota” in the “OC” field of their entry. If in the same field there was the keyword “phyta” or “planta”, the sequences were in- cluded in the plant dataset. Otherwise, they were included in the non-plant dataset. Sequences that did not have an N-terminal methionine (M) were ex- cluded from the datasets, as well as those including either B, Z, or X. The datasets were split into chloro- plast, mitochondrial, secreted, cytoplasmic, and nu- clear proteins. For the first three categories, it was required that they contain the keywords “TRANSIT” or “SIGNAL”, and “Chloroplast” or “Mitochondrial”
1.First layer of networks
3.Cleavage site prediction networks
Query sequence:
MAAFLIPR
...
...
SCORES
in the “FT” field. For the others, it was required that they contain the keyword “Cytoplasm” or “NU- cleus” in their “CC” field. Sequences that had more than one subcellular localization assigned to them were excluded from the datasets. After a 40% re- dundancy reduction using the program cd-hit (19), a plant set consisting of 1,309 sequences (249 chloro- plast, 62 mitochondrial, 422 secreted, 171 cytoplas- mic, and 405 nuclear sequences) was obtained and also a non-plant set of 10,559 sequences (366 mitochon- drial, 5,247 secreted, 1,458 cytoplasmic, and 3,488 nuclear sequences). The training set construction was based on having a positive set and a negative set of the same size, consisting of equal numbers of the other categories. Because of the small size of the plant mi- tochondrial set, we used the mitochondrial sequences from the non-plant set as well.
Algorithm
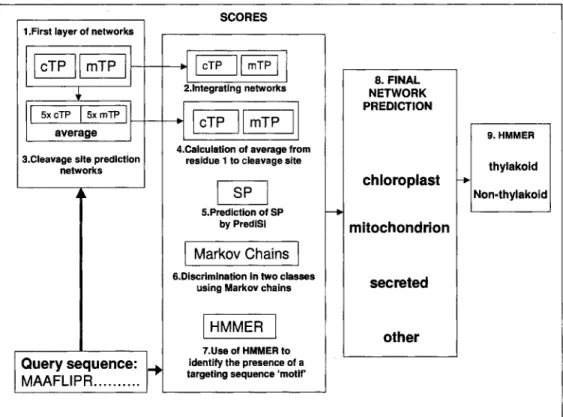
PredSL employs a combination of mural networks, Markov chains, scoring matrices (PrediSi), and HMMs, in order to get a number of scores for each sequence. These scores are then fed into a neural net- work, which makes the final prediction of the sub- cellular localization. More specifically, the algorithm follows a number of steps (Figure 1):
2.lntegratlng networks
4.Calculation of average from residue 1 to cleavage site
El
5Prediction of SPby PrediSi
1
MarkovChains1
6.Discrimlnation In two classesusing Markov chains
IHMMER
I
7.Use of HMMER to identify the presence of a targeting sequence ‘motif‘8. FINAL NETWORK PREDICTION chloroplast mitochondrion secreted other 9. HMMER thylakoid Non-thylakoid
Fig. 1 An schematic overview of the PredSL algorithm.
1. Initially we create a first layer of two paral- lel neural networks (cTP and mTP) that distinguish between chloroplast and mitochondrial targeting se- quences. For the training of these networks, we use the NevProp4 package (http://brain.unr.edu/publi- cations/), which utilizes a version of the Quickprop algorithm (27), having 4 hidden units and the in- put window size is 55 and 35 amino acid positions for each network, respectively. Each amino acid is repre- sented by a set of 20 nodes with one of them switched on. For example, alanine is represented by the vector “10000000000000000000”. It results in 55 x 20=1100
and 35 x 20=700 input nodes for each network, respec- tively. Each network produces 100 output scores for the 100 N-terminal residues of each sequence.
2. The output scores for the 100 N-terminal residues of each sequence from each network are fed as input into two integrated neural networks, again one for each category (cTP and mTP), and are trained us- ing the same sets without hidden units, thus providing two scores. Since at this stage we are not interested in the prediction of the cleavage site, the length of 100 is sufficient for the discrimination even though in many cases the targeting sequence is significantly shorter, and in some others longer.
3. Moreover, from the output scores of the first neural network, we calculate an approximate cutoff, under which the residues no longer belong to a target- ing peptide, and we take a window of 40 amino acid positions for which we estimate the cleavage site of the cTP or mTP correspondingly, using a set of neu- ral networks. For the training of these networks, we only use the sequences that have definite annotations concerning the cleavage site as positive data. It results
in a reduction of the numbers of sequences in the cTP and mTP datasets to 122 and 31 correspondingly for the plant set and the mTP dataset, and to 241 for the non-plant set. We use equal numbers of positive and negative sequences, and the negative sequences consist of equal representation of each of the negative datasets. Due to the small number of sequences used in the negative dataset, for each case (cTP and mTP) we train five neural networks with different sets of se- quences as negative, in order to make the prediction more objective. For training, after experimenting ini- tially using several window sizes, we choose the ones with the best performance; for the prediction of the cTP cleavage site it is 27 residues around the cleav- age site (-20, +6), and for the prediction of the mTP cleavage site it is 21 residues around the cleavage site (-12, +8). The output score is the average of those
of the five neural networks.
4. We calculate the average of the output scores of the first neural network from the first position to the predicted cleavage site for each set of networks and obtain two more scores.
5. Next we use the PrediSi algorithm (9) avail- able at http://www.predisi.de, which predicts signal peptides for secreted proteins using weight matrices, getting one more score.
6. Subsequently, we use a combination of positive and negative sets to train a simple first-order Markov chain to distinguish sequences between the two classes (28). The combinations used for the plant set as posi- tive/negative are chloroplast/cytoplasmic, mitochon- drial/cytoplasmic, chloroplast/mitochondrial, mito- chondrial & chloroplast/cytoplasmic, mitochondrial & chloroplast/secreted, chloroplast/mitochondrial & cytoplasmic, and for the non-plant set are mitochon- drial/cytoplasmic, mitochondrial/secreted, mitochon- drial/cytoplasmic & secreted. Thus, we acquire six scores for the plant proteins and three for the non- plant.
7. Finally, using the release 2.2 of HMMER (29), we generate profiles for the cTP and mTP and search the 120 N-terminal residues of the sequences for them. The length of the 120 N-terminal residues is used to ensure that we take into account most of the target- ing sequences, even if they are longer than the av- erage length. The alignments used to generate the profiles are created as follows: For the cTP, the first 15 residues are aligned in the left, the next 8 residues are aligned in the middle, and the rest, up to the cleav- age site plus 9 residues, are aligned to the right. For the mTP, the first 10 residues are aligned to the left, and the rest, up to the cleavage site plus 9 residues, are aligned to the right. In this manner we get two more scores for each sequence. Therefore, we have 13 scores for the plant sequences and 7 for the non-plant sequences.
8. We feed these scores to a final neural network, which has been trained with equal numbers of se- quences from each category (chloroplastic, mitochon- drial, secreted, and other) and using six hidden units for the plant set and three for the non-plant set. The output consists of one score corresponding to each subcellular localization (chloroplast, mitochondrion, and secretory pathway). If all the scores are less than a certain cutoff empirically determined, the sequence is classified as “other”. Otherwise the prediction is based on the largest score.
9. The proteins predicted as chloroplast are then
searched for certain HMM-profiles from position 30 to 120 for the existence of the 1TP. We search from position 30 of the precursor sequence to avoid false positives, since it is improbable that there will be an 1TP within the 30 N-terminal residues, and we ter- minate the search in position 120 since the average length of a cTP is between 30-90 residues. There- fore, the 1TP should in theory be detected within the 120 N-terminal residues. The profiles are cre- ated using the datasets from LumenP ( 1 8 ) by align-
ing with ClustalW (30), having 35 residues previous to the 1TP cleavage site plus 6 positions after that. Three such profiles are used: one from the proteins following the Sec-pathway, one from those following the TAT-pathway, and one including all proteins. If even one output score from searching the sequence is above the cutoff (-4), the protein is then classified as “thylakoid”
.
Cleavage site prediction
Depending on the prediction of the subcellular local- ization, we use the corresponding cleavage site predic- tion from the neural networks (cTP and mTP) or Pre- diSi (9) as a final prediction of the cleavage site. For the lTP, we use the prediction obtained by aligning the significant hits to the model generated by HM- MER (29).
Acknowledgements
We thank Professor Olof Emanuelsson for his help and the useful information he provided for the thylakoid targeting peptide prediction, and the reviewers of this work for their useful comments.
References
1. 2. 3. 4. 5. 54Blobel, G. 2000. Protein targeting (Nobel lecture). Chembiochem 1: 86-102.
Feng, Z.P. 2002. An overview on predicting the subcel- lular location of a protein. In Silico Biol. 2: 291-303. Mott, R., et al. 2002. Predicting protein cellular lo-
calization using a domain projection method. Genome Res. 12: 1168-1174.
Cedano, J., et al. 1997. Relation between amino acid
composition and cellular location of proteins. J . Mol.
Chou, K.C. 2000. Prediction of protein subcellular lo- cations by incorporating quasi-sequence-order effect. Biol. 266: 594-600.
Geno. Prot. Bioinfo. 6. 7. 8. 9. 10. 11. 12. 13. 14. 15. 16. 17 18. 19. 20. 21. 22.
Biochem. Biophys. Res. Commun. 278: 477-483. Nair, R. and Rost, B. 2003. Better prediction of sub- cellular localization by combining evolutionary and structural information. Proteins 53: 917-930.
Emanuelsson, O., et al. 2000. Predicting subcellu-
lar localization of proteins based on their N-terminal amino acid sequence. J . Mol. Biol. f300: 1005-1016.
Chou, K.C. and Elrod, D.W. 1999. Prediction of mem- brane protein types and subcellular locations. Pro- teins 34: 137-153.
Hiller, K., et al. 2004. PrediSi: prediction of signal
peptides and their cleavage positions. Nucleic Acids Res. 32: W375-379.
Szafron, D., et al. 2004. Proteome Analyst: custom
predictions with explanations in a web-based tool for high-throughput proteome annotations. Nucleic Acids Res. 32: W365-371.
Park, K.J. and Kanehisa, M. 2003. ]?rediction of pro- tein subcellular locations by support vector machines using compositions of amino acids and amino acid pairs. Bioinformatics 19: 1656-1663.
Zhang, Z. and Wood, W.I. 2003. A profile hidden Markov model for signal peptides generated by HM- MER. Bioinformatics 19: 307-308.
Guda, C., et al. 2004. MITOPRED: a genome-scale
method for prediction of nucleus-encoded mitochon- drial proteins. Bioinformatics 20: 1:785-94.
Nielsen, H. and Krogh, A. 1998. Prediction of sig- nal peptides and signal anchors by a hidden Markov model. Proc. Int. Conf. Intell. Syst. Mol. Biol. 6:
Boden, M. and Hawkins, J. 2005. Prediction of subcel- lular localization using sequence-biased recurrent net- works. Bioinformatics 21: 2279-2286.
Nielsen, H., et al. 1997. A neural network method for identification of prokaryotic and eukaryotic signal peptides and prediction of their cleavage sites. Int. J .
Neural Syst. 8: 581-599.
Emanuelsson, O., et al. 1999. ClhloroP, a neural
network-based method for predicting chloroplast tran- sit peptides and their cleavage sites. Protein Sci. 8: Westerlund, I., et al. 2003. LumenP--a neural network
predictor for protein localization in the thylakoid lu- men. Protein Sci. 12: 2360-2366.
Li, W., et al. 2002. Tolerating some redundancy
significantly speeds up clustering of large protein databases. Bioinfomnatics 18: 77-82.
Huh, W.K., et al. 2003. Global ainalysis of protein
localization in budding yeast. Nature 425: 686-691. Bannai, H., et al. 2002. Extensive feature detection
of N-terminal protein sorting signals. Bioinformatics Kumar, A., et al. 2002. Subcellular :localization of the
yeast proteome. Genes Dev. 16: 707-719. 122-130.
978-984.
18: 298-305.
23. Kumar, M., et al. 2005. Prediction of mitochon-
drial proteins using support vector machine and hid- den Markov model. J . Biol. Chem. In press.
24. Sun, Q., et al. 2004. Analysis of curated and predicted
plastid subproteomes of Arabidopsis. Subcellular com-
partmentalization leads to distinctive proteome prop- erties. Plant Physiol. 135: 723-734.
25. Andersson, M.X. and Sandelius, A.S. 2004. A chloroplast-localized vesicular transport system: a bio- informatics approach. BMC Genomics 5: 40.
26. Bairoch, A., et al. 2005. The universal protein re-
source (UniProt). Nucleic Acids Res. 33: D154-159.
27. Fahlman, S.E. 1988. Faster-learning variations on
back-propagation: an empirical study. In Proceedings
of the Connectionist Models Summer School. Morgan-
Kaufmann, Los Altos, USA.
28. Durbin, R., et al. 1998. Biological Sequence Analysis: Probabilistic Models of Proteins and Nucleic Acids.
Cambridge University Press, Cambridge, UK. 29. Eddy, S.R. 1998. Profile hidden Markov models.
Bioinformatics 14: 755-763.
30. Thompson, J.D., et al. 1994. CLUSTAL W: improv-
ing the sensitivity of progressive multiple sequence alignment through sequence weighting, position- specific gap penalties and weight matrix choice. Nu- cleic Acids Res. 22: 4673-4680.