UNIVERSIDADE CATÓLICA
PORTUGUESA . PORTO
FACULDADE DE ECONOMIA E GESTÃO
MESTRADO
Gestão de Serviços
Modalidade de Trabalho Tema Nome Aluno Data Outubro, 2012Carolina Fidalgo Horta Projeto
Developing a Balanced Scorecard for Porto Technical Centre - YAZAKI
Dedicated to the loving memory of Daniela Martins
i
ACKNOWLEDGEMENTS
I would like to express my sincere gratitude to a number of people who were instrumental in helping me make this work possible.
I am heartily thankful to my supervisor, Professor Rita Ribeiro, whose optimistic attitude, supervision and support from the preliminary to the concluding stage enabled me to develop this work project. This thesis was greatly improved by her constant advice and suggestions.
This project wouldn’t have been possible without the diversity of insights I was exposed to at Yazaki Saltano de Ovar – Produtos Eléctricos, Lda., and particularly at Porto Technical Centre. It was an honour to have the possibility to give my contribution to an organisation where I could see my knowledge recognized and valued.
I owe my deepest gratitude to Helena Dias, who guided my journey at the organisation and could always find some time for me.
I am also very thankful to Eng. Jorge Fontes, PTC’s General Manager, as his insightful comments were crucial for the improvement of this thesis. Thus, his typical saying “I want to be wowed” challenged me to do better every time.
Moreover, I wish to thank Anabela Pimentão, whom I’ve worked with closely during the whole project, and always had a positive word to say even at the most stressful times. My appreciation also goes to my Masters’ Degree instructors and colleagues with whom I had the opportunity to learn and grow.
It is with immense gratitude that I acknowledge the unconditional support of my parents, Ivone and Fernando, and my grandparents. Thank you for always having faith in me. Finally to Carlos, a special word of thanks for the constant support, patience and “re-encouragement” throughout the whole process.
ii
“Not everything that can be counted counts, and not everything that counts can be counted.”
iii
ABSTRACT
In a highly competitive and fast paced business environment, where intangible assets play an increased role in success, strategy execution and performance management are the top challenges executives face. The Balanced Scorecard is a structured business performance measurement system that goes beyond lagging indicators such as basic financial metrics to measures that derive future direction and success, while aligning the organisation around strategy and making strategy everyone’s job.
The aim of this project is the development of a Balanced Scorecard for Porto Technical Centre, the European shared services centre of YAZAKI, the world's largest producer of wiring harnesses for the automotive industry. This study intends to contribute towards a clear understanding of the journey an organisation undertakes while developing its Scorecard. This management tool has not been widely explored in this field, and its development has been hampered by the industry complexity.
The project comprised the entire development process of the Balanced Scorecard, since the definition of the mission, vision, values and strategy, to the development of the objectives, measures and their cause-and-effect relationships, targets and initiatives for each of the scorecard perspectives. The work performed was the first step in developing a comprehensive Scorecard for Porto Technical Centre, from which all departmental, and ultimately personal scorecards, will be aligned. Additionally, the case study established the foundations for a successful implementation and further cascading of the Balanced Scorecard throughout the organisation, bearing in mind its dynamic nature, and that performance measures should be reviewed periodically to ensure they continue to reflect the strategy and the issues of importance to success.
Keywords: performance measurement; strategy execution; Balanced Scorecard; case study; automotive industry.
iv
RESUMO
Num ambiente de negócios altamente competitivo, onde os ativos intangíveis desempenham um papel crescente no sucesso, a execução da estratégia e a gestão de desempenho estão no topo dos desafios enfrentados pelos executivos dos dias de hoje. O Balanced Scorecard é um sistema de medição de desempenho estruturado que vai além dos básicos indicadores financeiros, que dão informação acerca da performance passada, para as medidas que indicam direção futura e conduzem ao sucesso, alinhando a organização em torno da estratégia.
O objetivo deste projeto é o desenvolvimento de um Balanced Scorecard para o Porto Technical Centre, o centro europeu de serviços partilhados da YAZAKI, o maior produtor mundial de cablagens para a indústria automóvel. Além disso, este estudo pretende contribuir para a clara compreensão do processo de desenvolvimento de um Balanced Scorecard numa organização, recorrendo à aplicação empírica numa indústria onde o Balanced Scorecard não foi amplamente explorado, e onde o seu desenvolvimento é dificultado pela complexidade da mesma.
O projeto compreende o processo de desenvolvimento do Balanced Scorecard desde a definição da missão, visão, valores e estratégia, até ao desenvolvimento dos objetivos, medidas e suas relações de causa e efeito, metas e iniciativas para cada uma das quatro perspetivas do Balanced Scorecard. O trabalho realizado foi o primeiro passo no desenvolvimento de um Scorecard abrangente para o Porto Technical Centre, a partir do qual todos os scorecards departamentais e, finalmente, pessoais, estarão alinhados. O estudo de caso estabeleceu ainda as bases para uma implementação bem sucedida, assim como para o desenvolvimento do Balanced Scorecard “em cascata” por toda a organização. Tendo em conta a natureza dinâmica da ferramenta, as medidas de desempenho devem ser revistas periodicamente para garantir que continuam a refletir a estratégia e as questões de importância para o sucesso.
Palavras-chave: medição do desempenho; estratégia; Balanced Scorecard; estudo de caso; indústria automóvel.
v
TABLE OF CONTENTS
I. INTRODUCTION ... 1
1.1 Background ... 1
1.2 Purpose and Motivations of the Project ... 3
1.3 Structure of the Dissertation ... 4
II. THE SUBSECTOR OF COMPONENTS FOR THE AUTOMOTIVE INDUSTRY ... 5
III. THE YAZAKI GROUP AND PORTO TECHNICAL CENTRE ... 6
3.1 YAZAKI Corporation and YAZAKI Europe ... 6
3.2 YAZAKI in Portugal ... 8
3.3 Porto Technical Centre (PTC)... 9
IV. LITERATURE REVIEW ... 11
4.1 Performance Measurement / Management Systems ... 11
4.2 The Balanced Scorecard ... 14
4.2.1 Second Generation Balanced Scorecards – Strategy Maps ... 19
4.2.2 Third Generation Balanced Scorecards ... 22
4.2.3 Criticisms to the Balanced Scorecard Framework ... 25
4.3 The Balanced in Service Organisations ... 29
4.4 The Balanced in the Automotive Industry ... 33
V. METHODOLOGY ... 39
5.1 Research Questions ... 39
5.2 Research Strategy and Design ... 39
vi
5.2.2 Reliability, replicability, and validity ... 43
VI. BALANCED SCORECARD DEVELOPMENT ... 45
6.1 Planning and Developing a Balanced Scorecard ... 45
6.1.1 The Planning Phase ... 45
6.1.2 The Development Phase ... 48
6.2 Developing the Balanced Scorecard ... 49
6.2.1 Mission, Values, Vision and Strategy Development ... 49
6.2.1.1 Mission Statement ... 49
6.2.1.2 Corporate Values ... 49
6.2.1.3 Vision ... 50
6.2.1.4 Strategy ... 50
6.2.2 Defining objectives, measures, targets and initiatives ... 50
6.2.2.1 Employee Learning and Growth Perspective ... 52
6.2.2.2 Internal Business Process Perspective ... 55
6.2.2.3 Customer Perspective ... 67
6.2.2.4 Financial Perspective... 72
6.2.3 Developing cause-and-effect relationships ... 76
VII. CONCLUSION AND FUTURE WORK ... 81
7.1 Conclusions of the project ... 81
7.2 Limitations of the project ... 82
7.3 Suggestions for future work ... 84
vii
APPENDICES ... 96
Appendix I – YAZAKI and PTC – Company Identification ... 96
Appendix II – PTC’s Departments and Services ... 102
Appendix III – PTC Key Process Map (Flowchart) ... 107
Appendix IV – BSC Activity Planning ... 110
Appendix V – BSC Communication Plan ... 111
Appendix VI – PTC’s Values Survey and Results Analysis ... 112
Appendix VII – BSC Measures Dictionary ... 124
Appendix VIII – Human Resources at PTC and the Improvement of the Individual Performance Management System ... 150
Appendix IX – Summary of the Balanced Scorecard for Porto Technical Centre .... 156
ANNEXES ... 157
Annex I –The Subsector of components for the Automotive Industry ... 157
Annex II – PTC’s Organisational Chart ... 163
Annex III – PTC’s Customers ... 164
Annex IV – Strategic Business Plan for Porto Technical Centre ... 167
Annex V – PTC’s Customer Satisfaction Survey ... 171
Annex VI – PTC’s Performance Management Process (PMP) ... 174 Annex VII – Examples of charts compiling assessments from different evaluators . 185
viii
LIST OF TABLES
TABLE 1 - Citation frequencies annual count ... 13
TABLE 2 - Measures defined for the Learning & Growth Perspective ... 53
TABLE 3 - Measures defined for the Internal Processes Perspective ... 57
TABLE 4 - Measures defined for the Customer Perspective ... 68
TABLE 5 - Measures defined for the Financial Perspective ... 72
TABLE 6 - Initiatives defined for the Learning & Growth Perspective ... 75
TABLE 7 - Initiatives defined for the Internal Process Perspective ... 75
TABLE 8 - Initiatives defined for the Customer Perspective ... 76
TABLE 9 - Initiatives defined for the Financial Perspective ... 76
LIST OF FIGURES FIGURE 1 - The YAZAKI Group Structure ... 7
FIGURE 2 - YAZAKI Saltano de Ovar and its three areas: Components, Wire Harness and Engineering ... 8
FIGURE 3 - Total usage and overall satisfaction with the Balanced Scorecard from 1996 to 2010 ... 14
FIGURE 4 - Managing Strategy: Four Processes ... 16
FIGURE 5 - Translating Vision and Strategy: Four Perspectives ... 17
FIGURE 6 - A Strategy Map Represents How the Organisation Creates Value ... 20
FIGURE 7 - Cause-and-effect linkages on the Balanced Scorecard ... 21
FIGURE 8 - ZAC strategic linkage model (draft) ... 24
FIGURE 9 - The automotive industry – Increasing overall complexity ... 35
FIGURE 10 - The Collaborative Project Scorecard ... 37
FIGURE 11 - WHE Time Per Circuit Performance ... 58
FIGURE 12 - WHE Delivery Performance ... 59
FIGURE 13 - The 5 S Methodology ... 61
FIGURE 14 - Example of temporary licensing card ... 62
ix
FIGURE 16 - PTC’s Strategy Map – Representing cause-and-effect relationships between measures on the BSC ... 78
x
LIST OF ABBREVIATIONS
ABC Activity Based Costing
ACAP Associação Automóvel de Portugal
AEP Associação Empresarial de Portugal
AFIA Associação de Fabricantes para a Indústria Automóvel
BIP Business Improvement Processes
BIT Business Improvement Tools
BOS Business Operating System
BSC Balanced Scorecard
CAD Computer-aided Design
CAE Código de Actividade Económica
CAE Computer-aided engineering
CFO Chief Financial Officer
COMBU Component Business Unit
CPI Consumer Price Index
CPS Collaborative Project Scorecard
CRM Customer Relationship Management
CSC Customer Service Centre
CV Curriculum Vitae
EBIT Earnings Before Interest and Taxes
EDS Electric Distribution Systems
EIBU Electronic Instrument Business Unit
ELV End Life Vehicle
xi
ETA Estimated Time Acceptance / Arrival
ETD Estimated Time Delivery
EV Electric Vehicle
EVA Economic Value Added
GCT Global Costing Tool
GDP Gross Domestic Product
G/M Gross Margin
GQRS-C Global Quality Requirement Supplier
HEV Hybrid Electric Vehicle
HR Human Resources
IFT Ideas From Team
IMDS International Material Datasheet
IT Information Technology
JB Jig Board
JLR Jaguar Land Rover
KSF Key Success Factor
KPI Key Performance Indicator
MDS Material Datasheet
MHT Man Hour Tracking
MIT Margin Improvement Tool
NSD New Service Development
NYS New YAZAKI System
OBS Operating Business Sector
xii
PM Performance Measurement
PMP Performance Management Process
PPM Parts per Million
PPSS Permanent Power Supply System
PSA Peugeot Citroën
PTC Porto Technical Centre
QCC Quality Control Circle
QCD Quality, Cost & Delivery
QCDE Quality, Cost, Delivery & Environment
RFQ Request For Quotation
ROI Return On Investment
R&D Research & Development
SG&A Selling, General and Administrative Expenses
SME Small and medium enterprise
STD Standard
TDC Technical Documentation Centre
VSM Value Stream Map
WHE Wire Harness Engineering
YC YAZAKI Corporation
YDB YAZAKI Database
YEL YAZAKI Europe Limited
YSE YAZAKI Saltano de Ovar Produtos Eléctricos, Lda.
YSP YAZAKI Saltano de Portugal
1
I. INTRODUCTION
This section presents the objective and fundament of this work, gives an insight on the performance management systems subject matter, in particular the Balanced Scorecard, and explains the structure of the work developed.
The project aims to define performance measures for the service provided by Porto Technical Centre, the services centre of Yazaki Saltano de Ovar, Produtos Eléctricos, Lda. The performance management tool proposed by the organisation was the Balanced Scorecard (from now on BSC).
1.1 Background
Performance measurement, and more recently performance management, is a subject that has been in the spotlight of organisations’ management in the last decades. According to Kaplan and Norton (2004b) between 70 and 90% of organisations fail to execute their strategies. Performance measurement plays a key role in translating an organisation’s strategy into desired behaviours and results (Liu & Rong, 2009 citing Van der Stede, Chow & Lin, 2006). “Performance measures drive accountability, visibility, and transparency; inspire and motivate all employees; provide direction for the organisation; and encourage alignment from top to bottom” (Tyagi & Gupta, 2008). The primary challenge managers face is the gap between strategy and execution. Strategy, initiatives, resources and risk are addressed at the senior executive level of an organisation, but they are not tied to day-to-day activities. As a result, organisations are able to measure performance, but are unable to manage it (Tyagi & Gupta, 2008).
Over the past two decades, the BSC has become a widely advocated management tool for strategy operationalization and performance management, commonly associated with “best practices”. A recent Bain & Company survey of more than eleven thousand companies on five continents found that the BSC was used by 47% of responding organisations, a higher adoption rate than some other well-known management tools like Supply Chain Management (39%), Customer Segmentation (42%) and Total Quality Management (38%) (Rigby, 2011). According to Kaplan and
2
Norton, the developers of the BSC, “the name reflected the balance between financial and non-financial measures, between lagging and leading indicators, and between external and internal performance perspectives” (Kaplan & Norton, 1996a).
The framework provides an enhancement to traditional management control systems by looking beyond financial measures to incorporate non-financial measures. The BSC suggests we see the organisation from four perspectives: to the traditional financial perspective, Kaplan and Norton (1992) added the client, the internal process, and the learning and growth perspectives. Learning & Growth constitute the essential foundation for success in today’s knowledge age, measuring and managing the performance of the organisation’s key Internal Business Processes, as well as the focus on Customer’s needs and satisfaction will ultimately lead to improved Financial results.
Furthermore, the BSC encompasses intangible assets’ value creation that has direct impact on revenue and profit, through chains of cause-and-effect relationships – Strategy Maps1 (Kaplan & Norton, 2001a citing Huselid, 1995). Research has indicated that upwards 75% of value in today’s organisation is derived from intangible assets (Niven, 2002). This is dramatically justified by the increasing role of services in today’s economy, as even productive companies are adding value to their products and achieving competitive advantages through services. In the automotive industry the increased importance of services has even led to a shift in profit generation, as many automakers are generating more profit from services than they are from their core vehicle business (Cucuzza & Frezell, 2003).
The implementation of the BSC and its cascading throughout the entire organisation will allow each department, team, and ultimately each individual to understand and be aware of their role and contribution to achieve the objectives of the organisation. Moreover, for successful performance management the BSC is not complete with its implementation, it has to be updated continuously to follow an organisation’s strategy evolution and adapt to external environmental changes.
1
Strategy Maps are defined by Kaplan & Norton as a visual framework of the cause-and-effect relationships among the components of an organisation’s strategy, and it is used to integrate the four perspectives of the BSC – financial, customer, internal business processes and learning and growth (Kaplan & Norton, 2004b).
3
The use of the BSC in the automotive industry has been limited compared with other industries (Cucuzza & Frezell, 2003). This dissertation aims to be a contribution to the literature in the application of the BSC in a specific area of the automotive industry, the engineering services.
1.2 Purpose and Motivations of the Project
Developing a BSC for the Technical Centre (Porto Technical Centre – PTC) of Yazaki Saltano de Ovar was a challenge proposed by the manager of Costing & Pricing, Helena Dias. In 2009 PTC’s managers had started the exercise of creating balanced scorecards for each of the fourteen departments of the service centre. However, most managers had little knowledge about the tool, and given the complexity of the subject the fruits resulting from this effort were scarce. A new approach was then undertaken: to first develop a comprehensive Balanced Scorecard for PTC, to which all departmental scorecards would be aligned.
The challenge of developing a management tool as complex as the BSC in a service environment was crucial while choosing the master thesis project, since it would require a deep knowledge of the organisation and its strategic management. Thus, the research could involve two subjects of great interest, the influence of the Japanese culture in work practices and procedures, as well as the lean management tools employed in everyday activities. Though these subjects have not been addressed specifically on this project, they were experienced by the author of the study during the contact with the organisation, the people and their working methods and day-to-day activities. The curiosity to understand the complex relationships between the various actors in the automotive industry value chain also played a major incentive.
The study also aims to reduce the identified gap in the development of the Balanced Scorecard management framework in the specific area of engineering services in the subsector of automotive components, a major export sector in Portugal.
4
This thesis only encompasses the development of the Balanced Scorecard and not its implementation, due to the time constraints2. The aim is to define the key performance measures that translate PTC’s strategy and vision, as well as the targets and initiatives that should be defined so that PTC can follow its strategy and achieve its vision. The future implementation of the management system will allow realizing the vision and strategy of PTC through the objectives and performance indicators chosen, as well as manage intangible assets such as employee knowledge and customer relationships, key elements of value creation in today’s economy.
1.3 Structure of the Dissertation
This document is organized into eight chapters. In chapter I the problematic under study was introduced in terms of theoretical background, research gap and its purpose, and the justification for choosing this project was presented. The study begins with a brief analysis of the automotive industry and the sub sector of automotive components (chapter II). The third chapter characterizes the YAZAKI Group and Porto Technical Centre (PTC), the case studied in this work. Chapter IV presents the literature review undertaken on performance management systems, in particular the Balanced Scorecard. In chapter V the methodological approach for this study is addressed, clarifying the research methods and choices made in the project. The process of the development of a Balanced Scorecard for PTC is explained in chapter VI. Chapter VII presents the main findings of the project and concludes the dissertation with the limitations of this study and suggestions for future work.
2
The Project was only developed within the organisation during the period from October 2010 to June 2011 (8 months) and by a team working on it in part-time.
5
II. THE SUBSECTOR OF COMPONENTS FOR THE AUTOMOTIVE INDUSTRY
Yazaki Saltano de Ovar Produtos Eléctricos, Ltd. is embedded on the subsector of components for automobiles, more specifically, on the manufacturing of other wires and electric and electronic cables (CAE – 23720).
The automotive industry is totally globalized and has a very complex value chain, both organisationally and technologically, and is seen as a barometer of the global economy.
In recent years, there has been a process of mergers, acquisitions and strategic alliances that have been intended to increase the dimension of companies, to ensure its global presence as well as the ability to leverage synergies and economies of scale, to reduce costs and increase profitability (ACAP, 2010).
The automotive industry in Portugal represents a significant portion of GDP3, national exportation and has a big social impact. It represents a universe of 33,000 companies, 2.7% of total employment in Portugal (a total of 138,000 direct jobs), and achieves a turnover of 24 billion Euros (15% of GDP). The production of motor vehicles and their components is a major export sector in Portugal representing, in 2008, 14.4% of total products exported4.
The automotive components sector5 consists of about 180 to 200 companies (mostly SMEs6), with areas of activity from the production of engines or engine parts to manufacture of moulds and tools. It represents 2.2% of GDP, with a turnover close to 4.8 billion Euros, and employs 40,000 workers directly. It is the second national export (about 3.98 billion Euros)7.
This chapter intended to enhance the importance of the subsector, where PTC operates, for the Portuguese economy. The next chapter characterizes the organisation, as to allow a better understanding of the context in which the BSC is to be implemented.
3
Gross Domestic Product
4
2008 data from ACAP – Associação Automóvel de Portugal.
5
See Annex I - The Subsector of components for the Automotive Industry
6
Small and medium enterprises
7
6
III. THE YAZAKI GROUP AND PORTO TECHNICAL CENTRE8
3.1 YAZAKI Corporation and YAZAKI Europe
YAZAKI was founded in 1929, when Sadami Yazaki began selling wiring harnesses for automobiles in Japan. After important changes in governmental regulations in 1935, Japanese companies were allowed to start domestic automotive production, which allowed Mr. Yazaki to expand his business greatly. The first plant opened in 1938, and in 1941, YAZAKI Electric Wire Industrial Co. Ltd. was established with about 70 employees. In 1949, Sadami Yazaki made an important strategic decision: to focus on the production of automotive wiring harnesses, a ground-breaking decision which resulted in today’s global leadership.
Today, YAZAKI is located in 39 countries all around the world9, and this fact shows the company’s concern for being close to customers – “Globally there, wherever you are” is one of the company’s mottos. The YAZAKI Group is also strongly committed to the environment since 1974, when it created the first cooling system powered by solar energy. Currently, the Environment & Energy Equipment Sector is the second largest business area of the company (representing 17% of total product sales), offering several products that support the supply and utilization of the various energy sources, such as gas, electricity, and solar heat. Electricity transmission cables, gas security systems, air conditioning equipment, and solar powered systems are some of these products. Regarding the Automotive Sector, YAZAKI Corporation presents itself as a Total Manufacturing Supplier, from R&D to final assembly and delivery worldwide. YAZAKI holds a leading position in the worldwide wiring harness market. Furthermore, its product line includes fibre optics, display and clock modules, power centres, electronics, combination switches, connectors, terminals and high voltage cables and components10.
8
See Appendix I – YAZAKI and PTC – Company Identification
9
Employing more than 179,000 people.
10
7
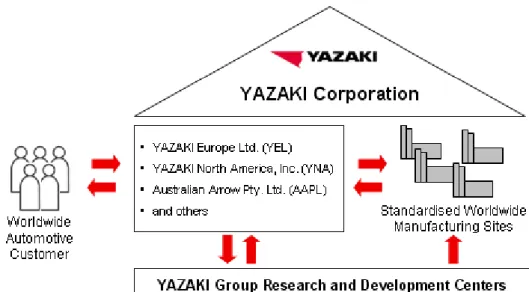
Figure 1 shows the structure of the YAZAKI Group, which consists of research and development centres, manufacturing sites, sales centres and local administration centres (Yazaki Europe Ltd., for example). PTC is embedded in the “YAZAKI Group Research and Development Centres” cluster, which provides services to plants worldwide, and supports all the YAZAKIs around the world in the provision of services and products to automotive customers, the Original Equipment Manufacturers (OEM).
FIGURE 1 - The YAZAKI Group Structure Source: www.yazaki-europe.com
The YAZAKI Group has also been expanding into new business sectors, such as the Nursing Care Business, Recycling Business and Agribusiness.
YAZAKI Europe (YEL) is established in 1980 with the opening of the first European sales office located in the UK, and in 1986 the first European production plant opened in Portugal. It is now present in 18 countries, with 16 Customer Service Centres (CSC), 15 plants and 2 Development Offices, employing about 50,000 people.
8
3.2 YAZAKI in Portugal
YAZAKI Saltano de Portugal (YSP) arises in 1986 in Serzedo, Vila Nova de Gaia, with the establishment of the first YAZAKI plant in the country, in Ovar. YAZAKI Saltano de Ovar Produtos Eléctricos, Lda. (YSE) was then established as an extension of the YSP, which became the company’s headquarters in Portugal, with the main office still located in Gaia.
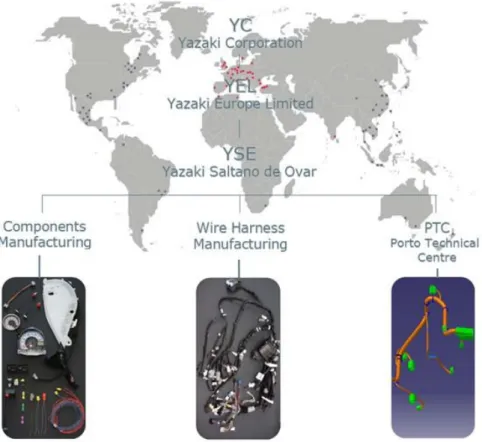
On figure 2, one can see how the YSE falls within the YAZAKI Group, and its three major areas: Components Manufacturing (COMBU – Component Business Unit), Wire Harness Manufacturing (EIBU – Electronic Instrument Business Unit and Porto Technical Centre (PTC)11.
FIGURE 2 - YAZAKI Saltano de Ovar and its three areas: components, Wire Harness and Engineering Source: Welcome to PTC - Presentation Slides (2010)
11
9
3.3 Porto Technical Centre (PTC)
The services centre PTC was only established in 2001, although some of the services it now offers have started to become available still at the office of YSP in Vila Nova de Gaia. In February 2010 PTC is transferred to a new building in Ovar, closely located to the laboratory and the factory. This new building was built specifically to receive PTC and accommodate its more than 300 employees in a large open space, and was officially inaugurated by the Chairman of YAZAKI Corporation, Mr. Shinji Yazaki (son of the founder) on October 1st 2010.
PTC centralizes some of the activities of the European R&D structure to minimize costs. The decision to create the Porto Technical Centre in Portugal was essentially because of the existence of the Yazaki Saltano de Portugal activities, Manufacturing Design and the Laboratory, which already worked for all European sites, and also because of the 15 years know-how in wire harness production.
Currently, PTC consists of a group of people with different skills and experiences, framed structurally in different departments, being its main objective the supply and the availability of a set of services and activities to customers, mostly (about 95%) on the EDS (Electric Distribution Systems) scope. PTC’s Customers12 are essentially the YAZAKI Customer Service Centres (CSC), normally located, as close as possible, to the main OEM’s automobile plants and the YAZAKI manufacturing plants. PTC is defined within the YAZAKI Group as a “non-profit organisation”13, as it exists to support CSC’s (like a back-office), so that they can provide YAZAKI services to the OEM’s. PTC’s competition is mainly internal (within YAZAKI), the manufacturing plants in some services, and the CSC’s who want to regain the engineering services.
Presently, PTC is headed by Eng. Jorge Fontes and consists of 14 departments14, each of these with a manager15, and a group of team leaders and employees associated:
Data Management; 12
See Annex III – PTC’s Customers
13
According to Eng. Jorge Fontes, PTC General Manager.
14
See Appendix II – PTC’s Departments and Services
15
10
Wire Harness Engineering (WHE);
CAD Systems;
Business Improvement Tools (BIT);
Digital Factory / Jig Board (JB) Layout;
Component Design;
Manufacturing Engineering;
Operational Support;
Sales & Marketing;
Costing & Pricing;
Crimping Centre;
Global Service;
Checker Fixture;
Laboratory.
To summarize, PTC performs studies on product and manufacturing engineering, prepares all wire harness (EDS), components (COMBU) and speedometer systems, gathers and provides information on various technical aspects of the automotive industry, and performs tests and laboratory trials, crimping activities16, and produces its own crimping tools17.
16
See Appendix III – PTC Key Process Map (Flowchart)
17
This is the only area that is not service, and due to the high prices of the crimping tools, this product accounts for one third of the sales volume of PTC.
11
IV. LITERATURE REVIEW
This chapter covers the theoretical context of the study, analysing the state of the art of organisational performance measurement and management systems. The research focuses on the Balanced Scorecard management tool, its application in services, and in the automotive industry in particular.
4.1 Performance Measurement / Management Systems
“When you can measure what you are speaking about, and express it in numbers, you know something about it[ [otherwise] your knowledge is of a meagre and unsatisfactory kind.”
Lord Kelvin, 1824-1907
Neely, Gregory & Platts (1995) define performance measurement as “the process of quantifying action, where measurement is the process of quantification and actions leads to performance”. The same authors state that a performance measurement system can be defined as “the set of metrics used to quantify both the efficiency and effectiveness of actions”.
Performance measurement and, in more recent years, performance management and its link to strategy, is a topic that has been extensively explored and subject to discussion for many years. Several frameworks, criteria and principles of performance measurement system design have emerged in the literature over the years.
Peter Drucker suggested that few factors are as important to the performance of an organisation as measurement; and performance measurement is increasingly crucial to survive in today’s complex and competitive marketplace. The traditional method of measurement has been financial. However, by the early 1980s, the financial measures once monitored started to be viewed as no longer appropriate to be the sole criteria for accessing organisational success, as they “provide an historical view, giving little indication of future performance” (Bruns, 1998). Other criticisms to the singular use of financial measures of performance include the fact they can’t capture today’s
12
organisational value creating activities (the so called intangible assets), the “focus on short-term gains at the expense of long-term value creation [such as research and development] may lead to sub-optimization of the organisation’s resources” (Stenzel, 2007) and the fact that this type of measure is not relevant in many levels of the organisation. Attention was driven to how organisations can replace their traditionally cost based measurement systems with ones that reflect their current objectives and environment.
In 1954, Drucker already argued that a “balanced” measurement system should be developed18, however, only later, frameworks balancing financial and non-financial measures started to emerge. The Performance Measurement Matrix (Keegan, Eiler & Jones, 1989), the Balanced Scorecard (Kaplan & Norton, 1992), and the Performance Prism (Kennerley & Neely, 2000) are some of the multidimensional and balanced models created to support organisational development.
More recently, academic communities and consultants suggest that ineffective management of the evolution of measurement systems is causing a “new measurement crisis”. Performance measurement systems need to be dynamic, and measures should effectively change over time to cope with changes in internal and external environment, reflect the strategic direction, and ensure organisational success. Wisner and Fawcett (1991) acknowledge the need for performance measures to be reviewed and changed to ensure the measures remain relevant (Kennerley & Neely, 2002).
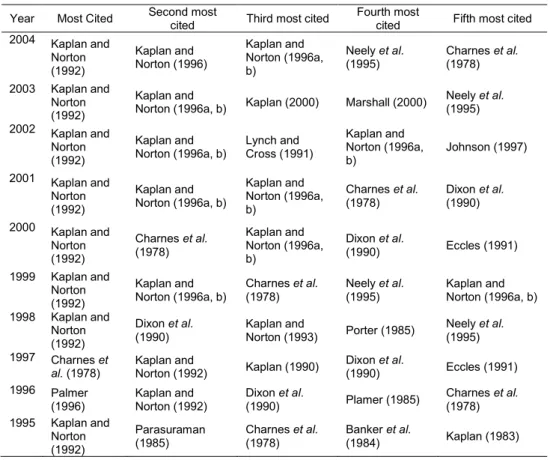
The Balanced Scorecard is perhaps the best known performance management framework. Kaplan and Norton articles on their framework continue to be the most frequently cited over the years. Table 1 shows the on-going dominance of the Balanced Scorecard on the field of performance measurement.
18
“Market standing, innovation, productivity, physical and financial resources, profitability, manager performance and development, worker performance and attitude, and responsibility” are appropriate performance criteria says Drucker in his 1954 publication The Practice of Management (Drucker, 1954).
13 Year Most Cited Second most
cited Third most cited
Fourth most
cited Fifth most cited 2004 Kaplan and Norton (1992) Kaplan and Norton (1996) Kaplan and Norton (1996a, b) Neely et al. (1995) Charnes et al. (1978) 2003 Kaplan and Norton (1992) Kaplan and
Norton (1996a, b) Kaplan (2000) Marshall (2000)
Neely et al. (1995) 2002 Kaplan and Norton (1992) Kaplan and Norton (1996a, b) Lynch and Cross (1991) Kaplan and Norton (1996a, b) Johnson (1997) 2001 Kaplan and Norton (1992) Kaplan and Norton (1996a, b) Kaplan and Norton (1996a, b) Charnes et al. (1978) Dixon et al. (1990) 2000 Kaplan and Norton (1992) Charnes et al. (1978) Kaplan and Norton (1996a, b) Dixon et al. (1990) Eccles (1991) 1999 Kaplan and Norton (1992) Kaplan and Norton (1996a, b) Charnes et al. (1978) Neely et al. (1995) Kaplan and Norton (1996a, b) 1998 Kaplan and Norton (1992) Dixon et al. (1990) Kaplan and Norton (1993) Porter (1985) Neely et al. (1995) 1997 Charnes et al. (1978) Kaplan and Norton (1992) Kaplan (1990) Dixon et al. (1990) Eccles (1991) 1996 Palmer (1996) Kaplan and Norton (1992) Dixon et al. (1990) Plamer (1985) Charnes et al. (1978) 1995 Kaplan and Norton (1992) Parasuraman (1985) Charnes et al. (1978) Banker et al. (1984) Kaplan (1983)
TABLE 1 - Citation frequencies annual count Source: Neely (2005)
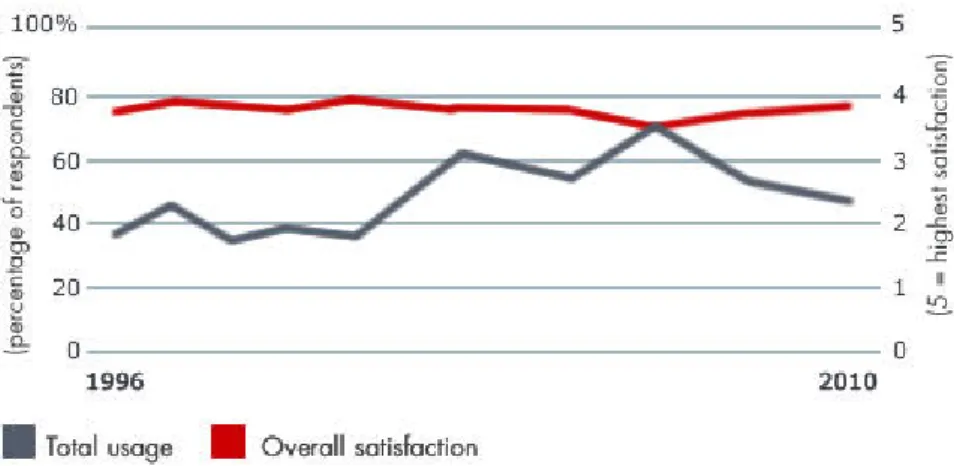
According to the last annual survey of management tools and trends undertaken by Bain & Company19, the Balanced Scorecard was used by 47% of the companies, with a satisfaction level of 3,83 (in a scale of 1 to 5).
19
The latest questionnaire was conducted in January 2011 and reflects behaviour in 2010. With this 13th survey, Bain & Company now has a database of more than 11,000 respondents from companies in a broad range of industries and can systematically trace the effectiveness of 25 management tools over the years.
14
FIGURE 3 - Total usage and overall satisfaction with the Balanced Scorecard from 1996 to 2010 Source: www.bain.com
Figure 3 represents the usage and satisfaction of the organisations included in the study with the tool, over the years. Even though the overall satisfaction rating has remained stable, the usage of the Balanced Scorecard framework has been slightly declining in recent years. On the Management & Tools Trends 2011 survey report, Bain & Company doesn’t provide a justification for this decline, but projects an increase in the Balance Scorecard use in 2011 of 16% (47% actual 2010 usage vs. 63% projected 2011 usage).
4.2 The Balanced Scorecard
The Balanced Scorecard was developed by Robert Kaplan, Professor of Accounting at the Harvard Business School, and the consultant David Norton. The origins of the concept can be traced back to many sources, namely the ‘Tableau de Bord’20, a management tool introduced in France in the 1930s, and a project developed in General Electric in the 1950’s21.
20
The ‘Tableau de Bord’ was described as a ‘dashboard’ used by managers to monitor the operational performance of their organisations (Bessire and Backer, 2005).
21
The project team recommended that divisional performance should be measured by one financial and seven non-financial metrics: profitability, market share, productivity, product leadership, public responsibility, personnel development, employee attitudes, and balance between short-range and long-range objectives (Kaplan, 2010).
15
In 1992, Kaplan and Norton introduced the Balanced Scorecard in a Harvard Business Review article based on a multi-company research project to study performance measurement in companies whose intangible assets played a central role in value creation (Nolan Norton Institute, 1991). The companies studied, as well as Kaplan and Norton, were convinced that the reliance on financial indicators of performance was affecting their ability to create value in a new extremely competitive business environment. While they provide an excellent review of what has happened in the past, they are inadequate in addressing the real value-creating mechanisms in today’s organisations – the intangible assets such as knowledge and networks of relationships (Niven, 2002). If companies were to improve the management of their intangible assets, they had to integrate the measurement of intangible assets into their management systems (Kaplan, 2010).
The study culminated in the establishment of a set of performance indicators covering all relevant aspects of the organisation, considering all its stakeholders and providing a short and long term perspective, with a strong association with strategy (Niven, 2002). The BSC includes financial measures as the ultimate outcome measures for company success, but complements these with operational measures from three additional perspectives - customer, internal processes, and learning and growth. Operational measures are considered the drivers of future financial performance (Kaplan & Norton, 1992) and long-term shareholder value. Thus, Kaplan and Norton’s work gradually broaden the concept from (i) defining the BSC as a comprehensive performance measurement system into (ii) the BSC as management tool for describing, communicating and implementing strategy (Kaplan, 2010), to facilitate and control performance measurement and management and align departmental and personal goals to overall strategy (Nørreklit, 2000).
In “Using the Balanced Scorecard as a Strategic Management System” (1996b), Kaplan and Norton state the BSC relies on four processes to bind short-term activities to long-term objectives: (1) Translating the vision, (2) Communicating and linking, (3) Business planning, and (4) Feedback and learning (See Figure 4).
16
FIGURE 4 - Managing Strategy: Four Processes Source: Kaplan & Norton (1996b)
All the measures in the BSC serve as translations of the organisation’s strategy. Vision and strategy are at the centre of the BSC system, not financial controls as in many organisations. The BSC is ideally created through a shared understanding and translation of the organisation’s strategy into objectives, measures, targets, and initiatives, in each of the four typical scorecard perspectives - Financial, Customer, Internal Processes and Employee Learning & Growth – providing answer to four basic questions (See Figure 5).
17
FIGURE 5 - Translating Vision and Strategy: Four Perspectives Source: Kaplan & Norton (1996b)
Before selecting metrics (or measures), companies should describe what they are attempting to achieve with their strategies, and the four BSC perspectives provide a robust structure for companies to express their strategic objectives (Kaplan, 2010). At the end of the business planning process (Figure 4), managers should have set targets for the long-term objectives they would like to achieve in all four scorecard perspectives, as well as identified the strategic initiatives required and allocated the necessary resources to those initiatives (Kaplan & Norton, 1993 and 1996b). Targets can be changed over time, allowing an evolution of performance linked to the strategic objectives (Kaplan & Norton, 2004b), as strategy itself may evolve in response to changes in the company’s competitive, market, and technological environments (Kaplan & Norton, 1996b).
18
By limiting information to only four perspectives, the BSC also limits the number of measures used, forcing managers to exclusively focus on those that are most critical to their business. The brevity and focus of the BSC was also presented as having value with respect to the need to efficiently and effectively communicate priorities within organisations (Kaplan & Norton, 1992). However, there’s a flexible approach to the Scorecard, as the number of perspectives may change and different perspectives can be added. Kaplan and Norton (1996a) themselves suggest that the four perspectives “should be considered a template, not a straitjacket”. Many organisations have followed this advice and developed perspectives for innovation, research and development, environment, suppliers, leadership, and community.
According to Kaplan and Norton (2001b), the BSC can be used to help create the strategy-focused organisation, as the tool has uses beyond performance measurement to strategic management. The strategy-focused organisation is based on a common set of five principles: (i) translate the strategy to operational terms; (ii) align the organisation to the strategy; (iii) make strategy everyone’s day job; (iv) make strategy a continual process; and (v) mobilise leadership for change.
Using the BSC as a strategic management system implies the alignment of every employee’s actions with overall organisational goals. When a scorecard is disseminated up and down the organisational chart, strategy becomes a tool available to everyone (Kaplan & Norton, 1996b). This “cascading” of the BSC is critical should organisations hope to enjoy the benefits of greater employee knowledge of, and focus on, key organisational strategies (Niven, 2002). The cascading process can result in different department scorecards, which derive from the organisational one, and even reach personal scorecards. “The personal scorecard helps to communicate corporate and unit objectives to the people and teams performing the work (Kaplan & Norton, 1996b).”
Since it became popular in the early 1990s, the BSC framework has undergone changes over time. Nowadays, academics recognise three distinct generations of BSC design, developments that have improved the utility of the BSC as a strategic management tool (Cobbold & Lawrie, 2002). These progresses to the initial framework will be addressed in the following subsections.
19
4.2.1 Second Generation Balanced Scorecards – Strategy Maps
While many organisations have used a combination of financial and non-financial measures in the past, what sets the BSC apart is the concept of cause-and-effect linkages. A well-constructed scorecard will tell the story of an organisation’s strategy through a series of linked performance measures weaving through the four perspectives (Niven, 2002). At this stage, the use of strategic-linkage models, often called the second generation of scorecards, are very useful to ensure that the objectives set for the four BSC perspectives support the organisation’s strategy (Kaplan & Norton, 2000).
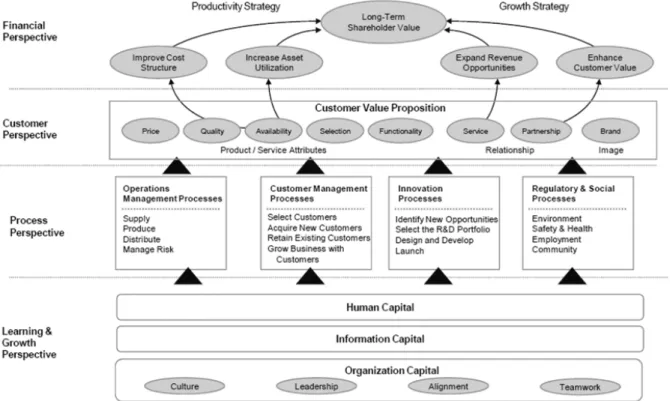
In “Conceptual Foundations of the Balanced Scorecard” (2010), Robert S. Kaplan acknowledges the importance of the establishment of the strategic objectives prior to the definition of the measures – “while our initial article had a subtitle, “Measures that derive Performance”, we soon learned that we had to start not with the measures but with descriptions of what the company wanted to accomplish. It turned out that the selection of measures was much simpler after company executives described their strategies through the multiple strategic objectives in the four BSC perspectives”. Furthermore, the BSC authors argue that the casual relationships should be defined between strategic objectives22 (Kaplan & Norton, 2000, 2001a, 2004b)23; Kaplan (2010) states “today, all BSC projects build a strategy map of strategic objectives first and only afterwards select metrics for each objective”. Figure 6 presents Kaplan and Norton’s strategy map template and provides a “normative checklist for a strategy’s components and interrelationships” (Kaplan & Norton, 2004b). According to the authors, the financial and customer perspectives in strategy maps and Balanced Scorecards describe the outcomes, that is, what the organisation hopes to achieve. Processes in the internal and learning & growth perspectives drive the strategy; they describe how the organisation will implement the strategy (Kaplan & Norton, 2004b). “The strategy map links intangible assets and critical processes to the value proposition and customer and financial outcomes (Kaplan, 2010).”
22
The terms strategic objectives (Kaplan and Norton, 1993) refers to short sentences which clarified the nature of the “goals” described in 1992.
23
The authors first introduced linkages between measures. One paper published at the beginning of 1996 illustrates and describes linkage as occurring between measures (Kaplan and Norton, 1996b). A second one published in the autumn of the same year illustrates and describes linkage as occurring between strategic objectives (Kaplan and Norton, 1996c).
FIGURE 6 - A Strategy Map Represents How the Organisation Creates Value Source: Kaplan & Norton (2004b
Though concurring with the definition of the strategic objectives before choosing the measures, some authors (
hypothesis reflecting strategy comes to life through the interplay and interdependencies among the financial and nonfinancial measures that relate to specific strategic objectives. Niven (2002) argues that the process of linking measures through a series of cause-and-effect relationships describes the organisation’s strategy, “the specific path you will follow to achieve your strategy”. “A good Balanced Scorecard should contain a mix of core outcome measures (lagging indicators) and the performance drivers that lead to improved performance on those metrics (leading indicators) (Niven, 2002)”. The same author (2002) says that when building the cause
start by creating the story from the lagging indicators of performance in each of the four perspectives, and then consider the leading indicators of performance for each. Be representing the lag and lead measures of performance and their interrelationships, Niven also includes the objectives from which the measures derive in the strategy map (See Figure 7).
20
A Strategy Map Represents How the Organisation Creates Value b)
Though concurring with the definition of the strategic objectives before choosing the measures, some authors (e.g. Nørreklit, 2000; Niven, 2002) advocate
hypothesis reflecting strategy comes to life through the interplay and interdependencies g the financial and nonfinancial measures that relate to specific strategic objectives. Niven (2002) argues that the process of linking measures through a series of effect relationships describes the organisation’s strategy, “the specific path u will follow to achieve your strategy”. “A good Balanced Scorecard should contain a mix of core outcome measures (lagging indicators) and the performance drivers that lead to improved performance on those metrics (leading indicators) (Niven, 2002)”. The author (2002) says that when building the cause-and-effect linkages one should start by creating the story from the lagging indicators of performance in each of the four perspectives, and then consider the leading indicators of performance for each. Be representing the lag and lead measures of performance and their interrelationships, Niven also includes the objectives from which the measures derive in the strategy map Though concurring with the definition of the strategic objectives before choosing Nørreklit, 2000; Niven, 2002) advocate that the hypothesis reflecting strategy comes to life through the interplay and interdependencies g the financial and nonfinancial measures that relate to specific strategic objectives. Niven (2002) argues that the process of linking measures through a series of effect relationships describes the organisation’s strategy, “the specific path u will follow to achieve your strategy”. “A good Balanced Scorecard should contain a mix of core outcome measures (lagging indicators) and the performance drivers that lead to improved performance on those metrics (leading indicators) (Niven, 2002)”. The effect linkages one should start by creating the story from the lagging indicators of performance in each of the four perspectives, and then consider the leading indicators of performance for each. Besides representing the lag and lead measures of performance and their interrelationships, Niven also includes the objectives from which the measures derive in the strategy map
21
FIGURE 7 - Cause-and-effect linkages on the Balanced Scorecard Source: Niven (2002)
Measure-based linkages provided a richer model of causality, but presented conceptual problems – for example, encouraging the use of various forms of analysis to validate measure selection based on numerical correlations between measures (Cobbold & Lawrie, 2004).
Cobbold and Lawrie (2004) summarize this second generation of BSCs in two main innovations: the new measure selection process helped particularly with the filtering issue – “the strategic objective itself gave a justification for the selection of one measure over another out of the many possible candidates for inclusion in each perspective” – and in causality. However, despite the developments and improvements in this second generation, there was still a concern with how the measures should be grouped (“clustering”). Arguments against the standard layout for a strategic linkage model24 have been advanced suggesting that for many organisations this causal flow is inappropriate, either because it leaves out one or more important clusters (e.g. Kennerley & Neely, 2000) or because the causality links cannot be justified (e.g.
24
“(...) causality flowing across the four perspectives ([) from learning and growth through internal business processes and customer and ending up at financial” (Cobbold and Lawrie, 2004)
22
Nørreklit, 2000). Moreover, organisations developing second-generation balanced scorecards found significant practical problems with measure selection and target setting (e.g. Barney, Radnor, Johnston & Mahon, 2004).
Aiming to overcome these flaws, a third generation of Scorecards is referred in the literature.
4.2.2 Third Generation Balanced Scorecards
The origin of the developments on third-generation balanced scorecard models stem from the issues relating to the validation of strategic objective selection and target setting, and intended to give better functionality and more strategic relevance to the framework.
Neely et al. (2003) outline the challenges of the third generation of performance measurement approaches:
(1) Models must reflect the static and dynamic realities of organisations but at the same time without losing appropriateness as a managerial tool;
(2) Must move from data to information and provide rigorous information especially for the intangible value drivers in organisations;
(3) The models must be practical and aligned with other organisational processes in order to allow actions to be taken;
(4) Must seek increasingly robust ways of demonstrating the cash flow implications of the non-financial and intangible organisational value drivers.
In order to keep any model relevant, third generation frameworks must evolve with the change that takes place in organisations (Neely et al., 2003).
23
Particularly in the BSC framework, third generation is characterized by two primary enhancements identified by Cobbold and Lawrie (2004): the destination statement and the strategic linkage model with only “activity” and “outcome” perspectives. A destination statement is a description, ideally including quantitative detail, of what the organisation is likely to look like at an agreed future date, aiming to identify inconsistencies in the profile of objectives chosen and act as a useful reference point for the target setting process (adapted from Cobbold & Lawrie, 2004). Typically the destination statement is sub-divided into descriptive categories that serve a similar purpose (but may have different labels) to the “perspectives” in first- and second-generation balanced scorecards (Cobbold & Lawrie, 2004). This different strategic linkage model is a simplification of the strategy map, “with a single “outcome” perspective replacing the financial and customer perspectives, and a single “activity” perspective replacing the learning & growth and internal business process perspectives” (Lawrie, Cobbold & Marshall, 2004; Barney et al., 2004). Third-generation balanced scorecard offers enhanced utility and practicality over previous designs (Cobbold & Lawrie, 2004).
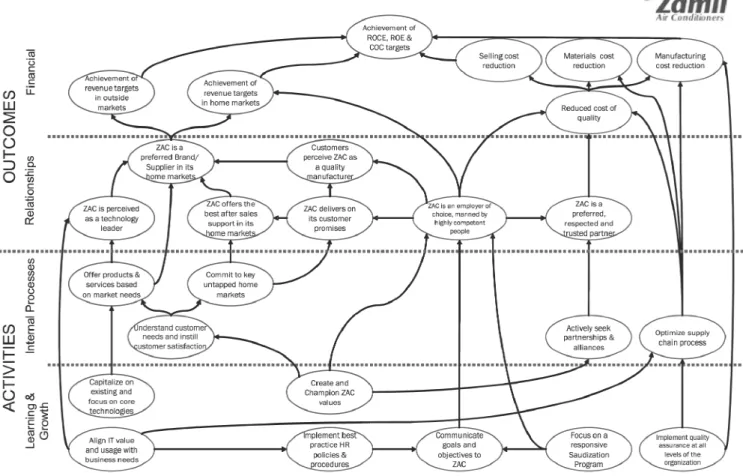
In their 2004 paper “Designing a strategic management system using the third-generation balanced scorecard - A case study”, Cobbold, Lawrie & Issa describe the development and implementation of a third-generation BSC within Zamil Air Conditioners (ZAC), a Saudi Arabian leading manufacturer of commercial and industrial air conditioning systems.
24
ZAC’s destination statement “consisted of about sixty distinct descriptive statements grouped in four headings: financial and market characteristics, external relationships, activities and processes and organisation and culture. The document described how the organisation would look in 2008 (i.e. five years ahead), and contained a mixture of qualitative and quantitative statements” (Cobbold et al., 2004). Regarding the strategic linkage model, “the objectives were grouped according to whether they related to activities to be carried out by ZAC (activity objectives), or hoped for consequences of these (or other) action (outcome objectives)” (Cobbold et al., 2004). Figure 8 shows the diagram with the representation of the short and medium term objectives organised into cause-and effect-linkages.
FIGURE 8 - ZAC strategic linkage model (draft) Source: Cobbold, Lawrie & Issa (2004)
25
For each objective, performance measures that would inform the management team whether or not the objective was being achieved were chosen, as well as targets and initiatives important to attain the agreed strategic goals. According to the authors it was interesting to note, at the end of the project, the extent to which the outputs of the process align with the strategic goals set out in the original plan developed by the business development director, as well as the clear change in management behaviour.
In “Effective quality management through third-generation balanced scorecard”, Andersen, Lawrie and Savic (2004) acknowledge third-generation BSCs role in quality initiatives success, and illustrate how it supports effective application of a number of popular quality management tools. This third-generation BSC has “shown to offer effective methods of linkage to a range of the most common quality management tools used by Western organisations: helping to close the divide between quality management and strategic control processes in an organisation” – “an explicit link between strategy and operational initiatives is a critical success factor in deriving long-term benefits from quality initiatives” (Andersen et al., 2004).
Despite the evolution and developments on the BSC framework since the early 1990s, several criticisms have been pointed out by both academics and practitioners over the years. Some of these will now be addressed.
4.2.3 Criticisms to the Balanced Scorecard Framework
The BSC has attracted much attention from both practitioners and academics over the years as it is presented as a useful management system for strategy execution, which integrates strategy and operations (Kaplan, 2010)25. The essence of the BSC is its focus, its simplicity, and its vision (Kaplan 2010 citing Larry Brady26). However, the literature notes some weaknesses in the design proposition, questions the veracity of
25
According to Kaplan (2010), the various activities for strategy development, planning, alignment, operational planning, operational control, and strategy control are integrated within a comprehensive management system.
26
26
key assumptions and relationships the framework relies on, and presents some difficulties in the BSC implementation.
Some authors (e.g. Bontis, Dragonetti, Jacobsen & Roos, 1999) consider the BSC a relatively rigid management tool, as the perspectives can limit the key success factors identification27, as well as the measures chosen. Considerations on the external environment are limited to customers (Bontis et al., 1999). Neely et al. (1995) point out a “serious flaw” concerning perspectives: “if a manager was to introduce a set of measures solely based on it, he would not be able to answer one of the most fundamental questions of all – what are our competitors doing (the competitor perspective)?”. Brignall (2002) says the BSC ignores two significant stakeholders: environment and social matters. Given the increasing tendencies to outsource, organisations become ever more dependent on their supply chain and/or networks (Neely, 2005) – hence the rise of research exploring the issue of how to measure supply chain performance (Neely, 2005 citing Beamon, 1999). Although Kaplan and Norton mention that the four perspectives “should be considered a template, not a straitjacket”, and organisations should fit the number of perspectives to their context (Kaplan & Norton, 1996a), Bontis et al. (1999) consider that by treating the perspectives like a comprehensive classification of all possible measures the authors contradict that statement. Some have also argued that there is a danger that organisations implementing BSCs can become too obsessed with performance measurement, potentially at the expense of performance management (Neely, Kennerley & Martinez, 2004).
Strategy maps, key tools for designing and deploying BSCs, have often been refer to have a very static and linear nature (Neely, 2005). They assume a logical and causal set of relationships between dimensions of organisational performance, yet in reality these relationships are recursive and dynamic (Brignall, 2002; Nørreklit, 2000). Nørreklit (2000) argues that the causality claimed to hold between perspectives is problematic and makes reference to the confusion of cause and effect with finality along
27
“([) because some KFSs (indeed, probably most of them) will be cross-perspective “(Bontis et al., 1999).
27
Kaplan and Norton’s literature28. The same author states there is not a causal but rather a logical relationship among the areas analysed – “Customer satisfaction does not necessarily yield good financial results” (Nørreklit, 2000). Therefore, “the BSC makes invalid assumptions, which may lead to the anticipation of performance indicators which are faulty, resulting in sub-optimal performance” (Nørreklit, 2000). Furthermore, the same author states the BSC is “not a valid strategic management tool, mainly because it does not ensure any organisational rooting, but also because it has problems ensuring environmental rooting. Consequently, a gap must be expected between the strategy expressed in the actions actually undertaken and the strategy planned” (Nørreklit, 2000). Nørreklit (2000), also alleges that the BSC concept is based on persuasive rhetoric rather than convincing theory based on empirical underpinnings.
The time dimension is also a concern referred by academics regarding the BSC. Nørreklit (2000) concluded the BSC model, as presented by Kaplan and Norton (1992, 1993, 1996b), lack a time-lag dimension because it measures different activities at the same point in time, and the various time scales of the different areas of the scorecard are not considered. “Whereas the effect of some activities (e.g. dismissal of several part-time employees) is almost immediate, the impact of others (e.g. investments in R&D processes) will be recognized only later, or gradually over time” (Johansen, Skoog, Backlund & Almqvist, 2006). However, producing measurements on a regular and systematized basis enables some of the time gaps between different activities to be taken into account even when they are measured at the same time (Johansen et al., 2006 citing Skoog, 2003a).
Another problem to the BSC identified is its consideration of employees and innovation. Employees are considered “almost as an afterthought, (...) lumped together with IT systems in the Learning & Growth perspective” (Bontis et al., 1999). However, Kaplan (2010) states the BSC deliberately did not label its fourth perspective the “employees” or “people” perspective (...) to signal they were not taking a pure
28
“The consequence of assuming finality is that the relationships among the various perspectives become more ambiguous and less simple, complexity increases and many of the techniques suggested for the balanced scorecard will be impracticable. Furthermore, if Kaplan and Norton are assuming finality instead of causality, then the balanced scorecard is no different from many other approaches. (Nørreklit, 2000)”
28
stakeholder approach – “Under the BSC approach, employee objectives always appear in the learning and growth perspective but they get there because they are necessary for the strategy, not because someone has labelled them as a stakeholder” (Kaplan, 2010). Additionally, it was often said companies didn’t have metrics that linked employees capabilities to the strategy (Kaplan, 2010), issue addressed by Norton on a research project (in 2002 and 2003) with human resources professionals to explore how to better link measurement of human resources to strategic objectives. The concept of strategic human capital readiness and the linkages to information capital and organisational capital (See Figure 6) resulted from this work (Kaplan & Norton, 2004b).
Innovation, the result of human learning and action, is part of the Internal Business Process perspective – “It feels almost as if innovation is considered a routine, something the organisation can do without the people, or at least independently of them. As a consequence, the specific challenge of managing people and their knowledge is underestimated by the BSC” (Bontis et al., 1999). Voelpel, Leibold and Eckhoff (2006) proposed five explanations about why the BSC fails to support innovation and employee empowerment. In that same year, Kaplan and Norton published “Response to S. Voelpel et al. “The tyranny of the Balanced Scorecard in the innovation economy””, with quotes from their published articles and books that directly contradict those positions.
Regarding implementation, it is important to take into account the dynamic nature of organisations. Studies of measurement system implementation suggest that typical implementations take between 18 and 24 months (Bourne, Mills, Wilcox, Neely & Platts, 2000), yet rarely are organisations stable for this length of time (Neely, 2005). Lipe and Salteiro argue the BSC is costly in terms of cash and time (2000) and that the volume of data may overload human decision-makers (2002).
Linking compensation to the scorecard to align organisational strategy carries risks - “does the company have the right measures on the scorecard? Does it have valid and reliable data for the selected measures? Could unintended or unexpected consequences arise from the way the targets for the measures are achieved?” (Kaplan & Norton, 1996b). Jensen (2001) argues the BSC “is flawed because it presents