Bergische University of Wuppertal
Faculty of Educational and Social Science
Institute of Sports Science
Department of Movement Science
Performance Diagnostics Quantitative Methods To
Provide Training Consequences
Empirical Study To Development And Evaluation
Field Team Sports
Submitted in fulfilment of the requirements for the degree of Doctor of Philosophy
By
M.Sc. Ibrahim Hamed Ibrahim Hassan Born in Sharkia - Egypt
E-mail: [email protected]
1. Supervisor: Prof. Dr. Jürgen Freiwald 2. Supervisor: Prof. Dr. Thomas Jöllenbeck
Declaration
I hereby declare that “Performance Diagnostics Quantitative Methods To Provide Training Consequences” is my own work and it has not been submitted before for any other degree in any other university. To the best of my knowledge and belief, the thesis contains no material previously published or written by other person except where due reference is made.
Signature ……….
Date ……….
Die Dissertation kann wie folgt zitiert werden: urn:nbn:de:hbz:468-20130227-164847-6
Abstract
Football codes sports have been many studies, which investigated the physical fitness profiles of these sports, but especially in the case of soccer. However, some physical fitness components of these sports are poorly understood. Furthermore, there are individuals who have competed at elite level in soccer and rugby union. There are a few studies have been compared the physical fitness characteristics of elite level players in each of the football codes. Therefore, the current study describe a physical fitness profile for soccer and rugby players, and determine if there are any differences in theses fitness characteristics between both field team sports.
Twenty-eight players participated in this study. Both field team sports play at high-level competitions. Fourteen of them are soccer players from a Bundesliga Club (age 24.57 ± 4.33 years; height 1.85 ± 0.07 m; weight 83.86 ± 8.5 kg; BMI 24.50 ± 1.45 kg.m-2), and the other fourteen are international rugby players from
DRV federation (age 24 ± 3.94 years; height 1.81 ± 0.05 m; weight 91.05 ± 12.16 kg; BMI 27.77 ± 2.33 kg.m-2). All players completed performance diagnostic tests in speed, strength and endurance aerobic capacity in the season break phase.
The results showed significant difference in BMI and physical fitness characteristics (speed, strength and endurance) between soccer and rugby players, although no significant difference observed in anthropometric (age, height, and weight), speed (non-linear sprint 8 m, 22 m and 2.Ch), strength (1RMbp and 1RMbs) and endurance aerobic capacity (VO2max test). In
conclusion, the results together with collected results from the literatures revealed significant differences between soccer and rugby union sports, and indicate that the demands of both field team sports are different. This difference should be considered by those designing the conditioning fundamentals of training programmes for these sports.
Acknowledgments
Firstly, I would like to take this chance to thank my country Egypt. The Egyptian scholarship gives me and my home country many opportunities for the future. I am heartily thankful to my supervisor, Prof. Dr. Jürgen Freiwald, who has provided guidance and encouragement during my study. My PhD experience has not always been easy, but Freiwald always believed in me and he deserve a special thanks for his support and excellence supervision, this was something that helped me through the more difficult times. I would also like to thank Prof. Dr. Thomas Jöllenbeck for accepting my PhD work for supervision and for his scientific experience, which added a lot of quality to my PhD thesis.
I would like to express my gratitude to several other people who played an important role during my PhD thesis:
The playing staff and coaches of Schalke 04 soccer Club, DRV rugby team and FLT co-works, in particular Volker Lange-Berlin, Christian Baumgart and Matthias Hoppe. Thank you for your help and cooperation throughout the process.
Finally, I would like to thank my father, mother and brotherly for their continued support, during my university career studying sports science and for giving me the possibility to start a career within sport.
Table of Contents
1. INTRODUCTION ... 14
2. THEORY REVIEW ... 20
2.1 Physical fitness testing ... 20
2.1.1 Definition of fitness testing ... 20
2.1.2 Benefits of fitness testing ... 22
2.1.3 Criteria of fitness testing ... 26
2.1.3.1 Test objectivity ... 26
2.1.3.2 Test validity ... 28
2.1.3.3 Test reliability ... 29
2.2 Physical characteristics of soccer and rugby players ... 31
2.2.1 Anthropometric and personal characteristics ... 32
2.2.1.1 Definition of anthropometric ... 32
2.2.1.2 Anthropometric and personal characteristics of soccer players ... 32
2.2.1.2.1 Age of soccer players ... 33
2.2.1.2.2 Height of soccer players ... 34
2.2.1.2.3 Body weight of soccer players ... 35
2.2.1.2.4 Body mass index (BMI) of soccer players ... 36
2.2.1.2.5 Anthropometric and personal characteristics review in previous soccer studies ... 37
2.2.1.3 Anthropometric and personal characteristics of rugby players ... 39
2.2.1.3.1 Age of rugby players ... 40
2.2.1.3.2 Height of rugby players ... 41
2.2.1.3.3 Body weight of rugby players... 41
2.2.1.3.4 Body mass index (BMI) of rugby players ... 42
2.2.1.3.5 Anthropometric and personal characteristics review in previous rugby studies ... 43
2.2.2 Speed ... 45
2.2.2.1 Definition and structure of speed ... 46
2.2.2.1.1 Definition of speed ... 46
2.2.2.1.2 Structure of speed ... 47
2.2.2.2 Speed characteristics of soccer players ... 50
2.2.2.2.1 Linear sprint in soccer ... 50
2.2.2.2.2 Non-Linear sprint in soccer ... 54
2.2.2.2.3 Speed review in previous soccer studies ... 59
2.2.2.2.3.1 Linear sprint review studies in soccer ... 59
2.2.2.2.3.2 Non-Linear sprint review studies in soccer ... 61
2.2.2.3 Speed characteristics of rugby players ... 62
2.2.2.3.1 Linear sprint in rugby ... 62
2.2.2.3.2 Non-Linear sprint in rugby ... 66
2.2.2.3.3.1 Linear sprint review studies in rugby ... 69
2.2.2.3.3.2 Non-linear sprint review studies in rugby ... 70
2.2.3 Strength ... 71
2.2.3.1 Definition and structure of strength ... 71
2.2.3.2 Strength characteristics of soccer players ... 74
2.2.3.2.1 Benefits of strength in soccer ... 74
2.2.3.2.2 Strength review in previous soccer studies ... 76
2.2.3.3 Strength characteristics of rugby players ... 77
2.2.3.3.1 Benefits of strength in rugby ... 77
2.2.3.3.2 Strength review in previous rugby studies ... 79
2.2.4 Endurance ... 81
2.2.4.1 Definition and structure of endurance ... 82
2.2.4.2 Endurance characteristics of soccer players ... 82
2.2.4.2.1 Covered distance of soccer players ... 83
2.2.4.2.2 Maximal oxygen uptake (VO2max) of soccer players ... 87
2.2.4.3 Endurance characteristics of rugby players ... 91
2.2.4.3.1 Covered distance of rugby players ... 92
2.2.4.3.2 Maximal oxygen uptake (VO2max) of rugby players ... 96
2.2.5 Summary ... 100
3. METHODOLOGY ...101
3.1 Research design ... 101 3.2 Participants ... 101 3.3 Study design ... 102 3.4 Research procedures ... 1053.5 Measurements and testing protocols ... 108
3.5.1 Anthropometrics measurements ... 108
3.5.2 Linear sprint (5 m, 10 m and 30 m) test ... 109
3.5.3 Non-linear (FLT Z-Run Sprint) test ... 110
3.5.4 One repetition maximum bench press (1RMbp) ... 111
3.5.5 One repetition maximum back squat (1RMbs) ... 112
3.5.6 Endurance tests ... 114
3.5.6.1 FLT (VO2max) protocol test ... 114
3.5.6.2 Three kilometers field run test ... 115
3.6 Statistical analysis ... 115
4. RESULTS ...117
4.1 Anthropometric and personal characteristics ... 117
4.2.1 Linear sprint ... 118 4.2.2 Non-linear sprint ... 118 4.3 Strength characteristics ... 119 4.3.1 Bench press ... 119 4.3.2 Back squat ... 119 4.4 Endurance characteristics ... 120
4.5 Correlation relationships between physical fitness variables for soccer and rugby players ... 120
5. DISCUSSION ...123
5.1 Anthropometric and age ... 123
5.1.1 Age ... 123
5.1.2 Height ... 125
5.1.3 Body weight ... 128
5.1.4 Body mass index (BMI) ... 132
5.2 Speed ... 135
5.2.1 Linear sprint (5 m, 10 m and 30 m) ... 135
5.2.2 Non-linear (FLT Z-Run) sprint ... 141
5.3 Strength ... 148
5.3.1 Bench press (1RMbp) ... 148
5.3.2 Back squat (1RMbs) ... 154
5.4 Endurance ... 155
5.6 Correlations between physical fitness variables for soccer and rugby players ... 160
5.6.1 Relationships between physical fitness variables in soccer ... 160
5.6.2 Relationships between physical fitness variables in rugby ... 162
6. CONCLUSIONS AND RECOMMENDATIONS ...167
6.1 Conclusions ... 167
6.2 Limitations of the study ... 170
6.3 Recommendations for future research ... 171
List of Tables
Tab. 1: Search results for scientific papers using PubMed database ... 18 Tab. 2: Evidence interpretation of the amount of correlation coefficients (Bös, et
al., 2000), page, 169. ... 27 Tab. 3: Comparison between anthropometric variables assessed in this study
with reported values from previous studies in elite and professional soccer players (mean ± SD). ... 38
Tab. 4: Comparison between anthropometric variables assessed in this study
with reported values from previous studies for elite and professional rugby players (mean ± SD) ... 44
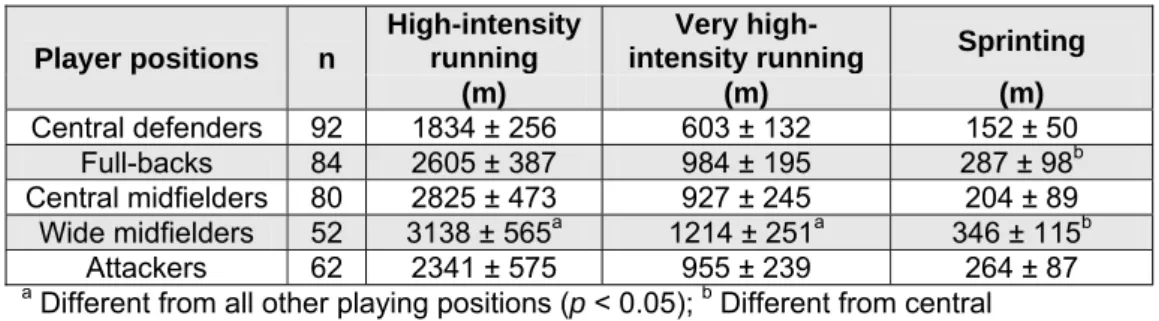
Tab. 5: Match activities in elite soccer players (Bradley, et al., 2009) ... 52 Tab. 6: Comparison covered distances of match performance activities between
positions in elite soccer players (mean ± SD) (Bradley, et al., 2009) ... 52
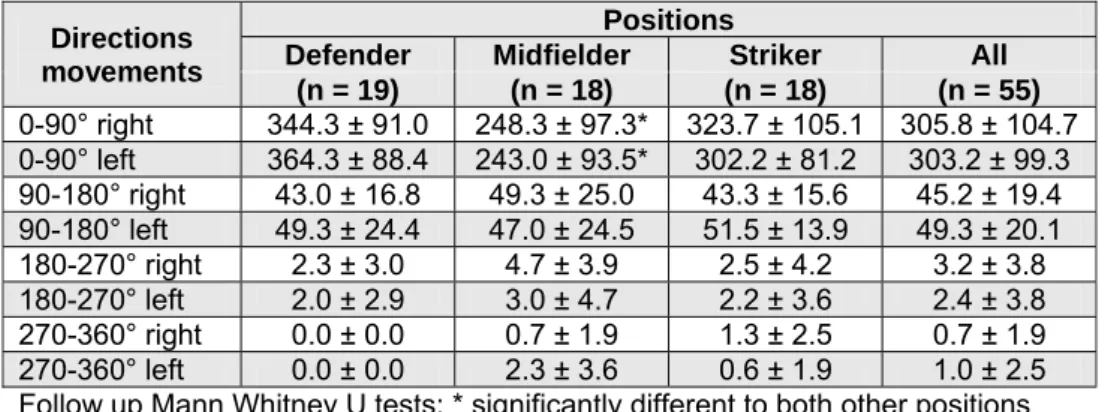
Tab. 7: Comparison % time of directions movements that travelled within
purposeful movement by player positions (mean ± SD) (Bloomfield, et al., 2007) ... 56
Tab. 8: Comparison frequency of turning that travelled within a match performed
by player positions (mean ± SD) (Bloomfield, et al., 2007) ... 56
Tab. 9: Comparison between linear sprint assessed in this study with reported
values from previous studies for elite and professional soccer players (mean ± SD) ... 60
Tab. 10: Classification performance sprint time levels for soccer players (Geese,
1990) ... 61
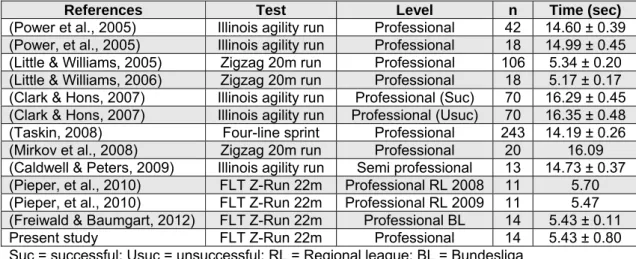
Tab. 11: Examples of (mean ± SD) non-linear test results in previous studies for
elite and professional soccer players ... 61
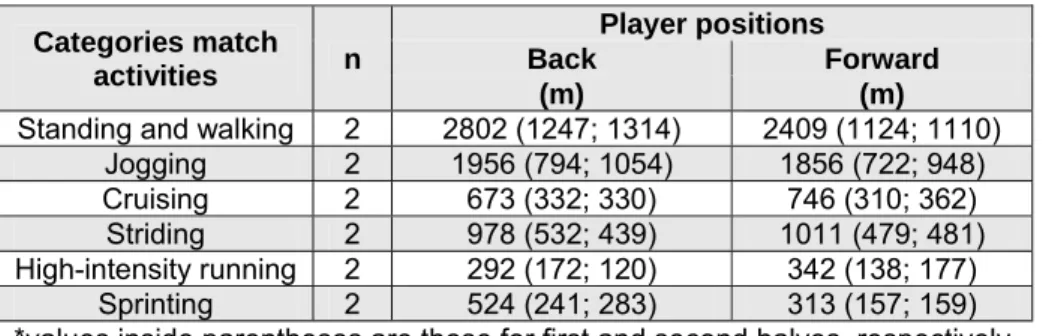
Tab. 12: Match activities in elite rugby players (Cunniffe, et al., 2009) ... 64 Tab. 13: Comparison covered distance of match performance activities between
positions for elite rugby players* (Cunniffe, et al., 2009) ... 65
Tab. 14: Comparison between linear sprints assessed in this study with reported
values from previous studies in elite and professional rugby players (mean ± SD) ... 69
Tab. 15: Classification performance sprint time levels over 10 m and 30 m for
professional rugby players ... 70
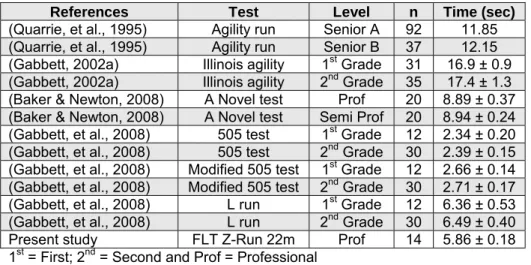
Tab. 16: Examples of (mean ± SD) non-linear test results in previous studies for
elite and professional rugby players ... 70
Tab. 17: Comparison between assessed upper and lower strength tests in this
study with reported values from previous studies in elite and professional soccer players (mean ± SD) ... 76
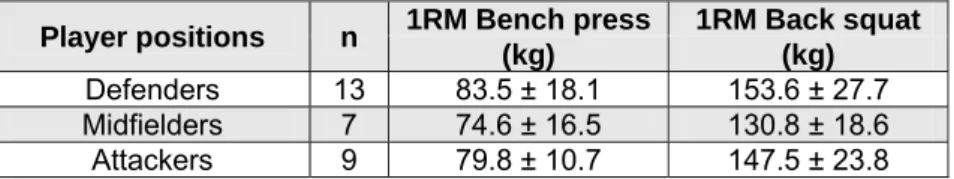
Tab. 18: Comparison 1RM bench press and back squat between positions in
elite soccer players (mean ± SD) (Wisloff, et al., 1998) ... 77
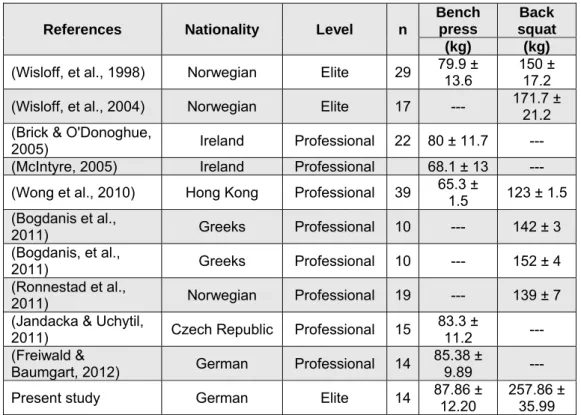
Tab. 19: Comparison between assessed upper and lower strength in this study
with reported values from previous studies in elite and professional rugby players (mean ± SD) ... 80
Tab. 20: Classification one repetition maximum tests of bench press and back
squat in amateurs British rugby players (Taplin, 2005) ... 81
Tab. 21: Comparison total covered distances by elite and professional soccer
players during soccer game according to (Stolen, et al., 2005; Tschan et al., 2001). ... 84
Tab. 22: Comparison covered distances in soccer match between player
positions in elite soccer players (mean ± SD) (Di Salvo, et al., 2007) ... 85
Tab. 23: Maximal oxygen uptake (VO2max) in elite and professional soccer
players (mean ± SD) according to (Carling, et al., 2009; Da Silva, et al., 2008) 89
Tab. 24: Comparison maximal oxygen uptake (VO2max) between players
positions in elite soccer players (mean ± SD) (Boone, et al., 2011; Wisloff, et al., 1998) ... 90
Tab. 25: Total mean covered distance by elite and professional rugby players 94 Tab. 26: Comparison covered distances in rugby union match between player
positions of elite rugby players (mean ± SD) (Cunniffe, et al., 2009; Roberts, et al., 2008) ... 95
Tab. 27: Maximal oxygen uptake (VO2max) in elite and professional rugby
players (mean ± SD)* according to (Duthie, et al., 2003; Nicholas, 1997; Reilly, 1997) ... 99
Tab. 28: Comparison maximal oxygen uptake (VO2max) between player positions
in elite and professional rugby players (mean ± SD)* (Nicholas, 1997; Reilly, 1997) ... 99
Tab. 29: Descriptive mean ± SD of participants ... 101 Tab. 30: Timing schedule of the season periods and testing sessions for soccer
and rugby players ... 102
Tab. 31: Performance test variables ... 103 Tab. 32: Correlation coefficient between tests data in seasons 2008 and 2009
... 104
Tab. 33: Measurements order testing session for soccer players ... 106 Tab. 34: Measurements order testing session for rugby players ... 106 Tab. 35: Interpretation significant classifications at 95% confidence interval .. 116 Tab. 36: Anthropometric (mean ± SD) and independent t-test (p) between
soccer and rugby players ... 117
Tab. 37: linear 5 m, 10 m and 30 m sprint (mean ± SD) and independent t-test
(p) between soccer and rugby players ... 118 Tab. 38: Non-linear (FLT Z-Run) sprint (mean ± SD) and independent t-test (p)
between soccer and rugby players ... 118
Tab. 39: Bench press (mean ± SD) and independent t-test (p) between soccer
and rugby players ... 119
Tab. 40: Back squat (mean ± SD) for soccer and rugby players ... 119 Tab. 41: Endurance characteristics (mean ± SD) for soccer and rugby players
... 120
Tab. 42: Correlation coefficients between physical fitness characteristics
variables for soccer players... 121
Tab. 43: Correlation coefficients between physical fitness characteristics
List of Figures
Fig. 1: The functional chain for developing the sport specific performance
(Martin, 1999), page 37. ... 21
Fig. 2: Block diagram of performance and function diagnostics in high elite soccer players (Freiwald, et al., 2008), page, 22. ... 24
Fig. 3: Comparison total number of match activities between play levels and positions in Netherlands soccer player leagues (Verheijen, 2000), page 18. .... 53
Fig. 4: Linear sprint test ... 109
Fig. 5: Non-linear (FLT Z-Run Sprint) test ... 110
Fig. 6: Olympic bar bench Fig. 7: Bench press test ... 111
Fig. 8: Olympic barbell squat machine ... 112
Fig. 9: Squat machine gym80 ... 113
Fig. 10: Back squat 90º protocol test ... 113
Fig. 11: H/P Cosmos motorized treadmill Fig. 12: Power Cube-Ergo with flow sensor ... 114
Glossary of terms
The following abbreviations have been used frequently throughout the text of this thesis:
1
1RMbp = One repetition maximum bench press 1RMbs = One repetition maximum back squat 1.Ch = First change turn
2
2.Ch = Second change turn
B
BMI = Body mass index
C
cm = Centimeter
D
DFB = German soccer federation
F
Fig. = Figure
FLT = Research center for performance diagnostics and training advice at University of Wuppertal
FLT Z-Run Sprint = Non-linear zigzag run sprint acyclic test designed by research center for performance diagnostics and training advice at University of Wuppertal
K
kg = Kilogram
kg.m-2 = Kilograms per square meter
M
min = Minutes
ml.min-1.kg-1 = Millilitres of oxygen per kilogram of body weight per minute
P p. = Page p = Significant level R r = Correlation coefficient S SD = Standard deviation sec = Seconds T Tab. = Table V
1. Introduction
Football refers to a number of sports that involve kicking a ball with the foot to score a goal. The most popular of these sports worldwide is association football that known as soccer. The word football applies to whichever form of football is the most popular in the regional context in which the word appears that including association football, as well as American football, Australian rules football, Gaelic football, rugby league and rugby union. These variations of football are known as football "codes" (Reilly & Gilbourne, 2003).
Soccer is the most popular sport in the world with approximately 200.000 professional and 240 million amateur players. A soccer match is played with two teams of 11 players and divided into four groups (goalkeepers, defenders, midfielders and forwards). A match comprises two halves of 45 min with an interval of 15 min (www.fifa.com).
Rugby union is a full body contact game, a popular sport and is second only to soccer in terms of the number of nations in which it is played. Two teams of 15 players play a rugby union match a side (eight forwards and seven backs). A match comprises two halves of 40 min with a 5-10 min half time break (www.irb.com).
Sports performance is an integrated approach to training players to reach peak levels of performance during the competition season. There are many important physical characteristics required to improve this performance for players in field team sports such as soccer and ruby union sports. Although each of these sports has different skills, tactics and movement patterns during match play but they have similar fitness demands such as speed, agility, strength and endurance, these components of physical fitness1 related to successes in matches in these field team sports.
In highlighted review in sports science research, soccer was compared to football codes such as Gaelic Football, American football and hurlers (McIntyre,
1 Physical fitness defined in this study as a combination of anthropometric and physical
performance characteristics. In addition, the physical performance characteristics defined in this study as the outcome of the following fitness components: speed, strength and endurance.
2005; Strudwick et al., 2002). A direct comparison between soccer and rugby sport has not been conducted in physical fitness except four studies, study by (Walsh et al., 2005) was purposed to develop sprint test batteries, study by (Junge et al., 2004) was to compare the characteristics and incidence of injuries in amateur soccer and rugby players, study by (Brick & O'Donoghue, 2005) was examined the fitness characteristics of players at an elite level between soccer, rugby and Gaelic football. In addition, (Kuhn, 2005) has determined whether any differences in physical fitness between soccer and rugby players.
The results of (Brick & O'Donoghue, 2005) demonstrated that rugby forward and back players relatively had higher means ± SD than soccer players in body weight 100.2 ± 9.2, 84.5 ± 4.7 and 81.4 ± 8 kg, respectively; one repetition maximum bench press (1RMbp) for upper body 109.7 ± 26.7, 88.6 ± 7 and 80 ± 11.7 kg, respectively; and maximal oxygen uptake VO2max of 20 m shuttle run
test 54.1 ± 2.6, 59.6 ± 4.7 and 51.3 ± 4.4 ml.min-1.kg-1, respectively. However
no significant difference observed between rugby forward players and soccer players in estimated VO2max, while rugby back players showed higher
significantly difference than soccer players. The authors in this study recommended that designing the conditioning elements of training programmes for soccer and rugby players should consider this difference.
In the same line, study of (Kuhn, 2005) reported that soccer players had lower means ± SD than rugby players in height 1.76 ± 8.8 and 1.84 ± 6.5 m and body weight 72.8 ± 7.9 and 88.2 ± 13.7 kg, respectively. However, in this study soccer players had better sprint time means ± SD in agility test than rugby players 7.5 ± 0.7 and 8.0 ± 0.6 sec. Rugby players had significantly higher absolute upper leg strength scores than soccer players, although both soccer and rugby players did not differ in their relative strength scores.
In context of development fitness test batteries, the study of (Walsh, et al., 2005) analyzed the correlation between three performance sprint tests for soccer and rugby players, which included a linear sprint 40 m, a course shaped like an 'L' run, which the players had to complete both 90 and 180 degree turns during the
sprint and a zigzag sprint test as non-linear sprint tests. The results of this study reported that the ability to run fast in a straight line does not seem to be the same as the ability to perform cutting moves or change directions in soccer and rugby game.
(Junge, et al., 2004) described the injuries in soccer and rugby union sports and reported that comparisons between soccer and rugby injuries clearly indicates that rugby sport is associated with a higher rate of injury than soccer. Specifically, the incidence of match injuries was more than twice as high in rugby players compared with soccer players.
The differences between reviewed results of the above few studies, which compared soccer and rugby players, could be explained by the demands different of both sports. Rugby union can be characterized as typical stop and go games, whereas soccer is a relatively continuous game that requires a higher degree of aerobic power. (Reilly & Borrie, 1992) suggested that sports such as soccer and rugby union could be described as intermittent sports, because their demands of bouts is high-intensity play combined with periods of sub-maximal effort over a long period that uses both aerobic and anaerobic energy systems. Soccer as a most competitive field team sports, is an intermittent based game. Performance in intermittent based sports has been linked to speed, power, strength, agility and the ability to repeat short high intensity bursts throughout a match, rather than the capacity to maintain a steady sub-maximal work rate (Bangsbo et al., 1991; Stolen et al., 2005).
Rugby union is a field team sport that has a variety of physiological responses as a result of repeated high-intensity sprints and a high frequency of contact. The physiological demands of rugby union require a high level of strength and powers, for example scrum2 and sprinting, are combined with periods of lower
2 The scrum skill in rugby is a way to restart play after a minor infringement or a stoppage. A
scrum is formed in the field of play when eight players from each team, bound together in three rows for each team, close up with their opponents so that the heads of the front rows are interlocked. This creates a tunnel into which a scrum half throws in the ball so that front row players can compete for possession by hooking the ball with either of their feet (www.irb.com).
intensity aerobic activity and rest (Duthie et al., 2003; Nicholas & Baker, 1995; Quarrie et al., 1995).
Physical characteristics demands and game strategy in soccer and rugby union are relatively similar for both sports. Tactical strategy generally involves isolating the defensive players and picking a place on the field to move the ball forwards towards a goal. The difference between soccer and rugby union is that rugby players need more power to drive the ball across the field through the opposing team. However, the basic skills for soccer and rugby players are also relatively similar when every player needs to be able to kick, tackle, pass and run fast. Nevertheless, there are some of different specializations in soccer game, where specific skills are necessary for given situations in the game.
Whether strategy game play in soccer and rugby union sports similar or not, (Walsh, et al., 2005) found one reason for the occurrence of acyclic sprints in rugby union and soccer. This reason is that in both sports there are opponents from the other team, which have to be avoided on the way towards the goal. Soccer and rugby players to successes in this tactical strategy game, players needs the ability to either run extremely fast in relatively straight line to run past the opposing player or to be able to change direction quickly and outmaneuver the opposing players.
The popularity of and participation in field team sports such as soccer and rugby union are extensive throughout many countries worldwide. In addition to the general interest in these field team sports, the sport scientists have investigated many aspects of actual and simulated performance in order to gain a greater understanding of the physiology of these complex games (Bangsbo, 1994a; Bangsbo, et al., 1991; Duthie, et al., 2003; Hoff & Helgerud, 2004; Nicholas & Baker, 1995; Reilly, 1997; Stolen, et al., 2005).
Soccer and rugby union as a football codes sports have been many studies that investigated the physical fitness characteristics of these sports, but especially in the case of soccer. However, some physical fitness components of these sports are poorly understood. Furthermore, there are individuals who have competed at
elite level in soccer and rugby union. It has previously been noted that there are a few studies have been compared the physical fitness characteristics of elite level players in each of the football codes (Strudwick, et al., 2002).
In recent years more sport scientific studies have focused on soccer sport in the anthropometric characteristics, aerobic fitness assessment, explosive power, and physiological responses of players during training and games. The survey search from recent to June 2012 of previous studies by Pubmed database showed, that rugby union sport has a few specific scientific studies Tab. 1. There are many of the current training methods demand on scientific research knowledge from other football codes and could be adapted for rugby union if this possible, as that reported between soccer and Gaelic football (Reilly & Doran, 1999).
Moreover, there are few studies that compared directly the physical fitness characteristics in soccer to rugby union and some of other football codes, except few studies, which reported by (Brick & O'Donoghue, 2005; Jardine et al., 1988; Kuhn, 2005; Strudwick, et al., 2002).
Tab. 1: Search results for scientific papers using PubMed database
Sport (Keyword search) Number of published studies
Soccer 4707
Rugby League 631
Rugby Union 391
Gaelic Football 30
A review of literature showed, that the physical fitness characteristics tests for field team sports such as soccer and rugby union are important to utilize tests, which demonstrate construct validity when conducting sport specific evaluation for field team sports players. Thus given the lack of research and the increasing number of participants in field team sports, there is a need to identify and develop a mechanism to profile, monitor, and evaluate these players.
The lack researches of physical fitness tests in rugby union Tab. 1 and also the development of the players profile are a motive to conduct current study. This is of great importance for coaches and players in order to identify the best
methods, which using to find the appropriate solutions to provide training and to control and guide the training process according to the general requirements in soccer and rugby union games.
Therefore, the primary aims of this empirical study were to describe and assess the physical fitness characteristics profile for German soccer and rugby players in order to:
1. Describe a physical fitness profile for soccer and rugby players.
2. Establish a normative data for German elites and non-elites male soccer and rugby players.
3. Determine if there are any differences in physical fitness characteristics between soccer and rugby players as recommendations of pervious studies.
2. Theory Review
This part of current study will focus on different aspects of soccer and rugby union in terms of the physical fitness characteristics and the general requirements game in both sports. The theory part begins with a background about the importance and benefits of used physical fitness tests in field team sports such as soccer and rugby union. Other topics that will be discussed include the demands of the game and physical fitness characteristics for soccer and rugby players will be compared with the international previous studies.
2.1 Physical fitness testing
Physical fitness testing for field team sports players is a very important and imperative part of research and development within a particular sport. It allows investigators to establish norms and thus make objective comparisons between players in different ages, genders, and level of leagues from other countries. Such information about fitness demands can be obtained by using fitness tests that evaluate physical performance capacity.
2.1.1 Definition of fitness testing
A physical fitness test is a test designed to measure physical speed, strength, agility and endurance. (Reiman & Manske, 2009) have defined a testing as using a set of problems to assess abilities. Therefore, performance testing means using a set or tool of tests to determine performance abilities or functional limitations. A functional limitation is the inability to perform a particular activity at a normal level.
In addition, (Coulson & Archer, 2009) have defined testing as a statement about the quality or value of what has been measured and thus involves the tester making a decision, so interpreting a score for each player. This mean, it is first necessary to define the intent of baseline testing and then develop a practical model for application.
The fitness testing means in German literatures “Leistungsdiagnostik”, this word means performance diagnostic. There are several German authors have been defined the physical fitness testing as a process that use some tools to control
International peak performance competition analysis Training Complex performance diagnostic Training diagnostic Training decision Implementation methodology of training Training objectives Training conception
and advise coaches or players to reach a peak performance during the game. (Thiess & Schnabel, 1995) have defined fitness testing as „The performance diagnostics includes the methodology of training, methods of control, performance assessment, sport motor tests, observation and analysis procedures and the test methods of biomechanics, biochemistry, physiology, sports medicine and sports psychology”. (Martin, 1980) has distinguished five types of performance diagnostics tests, which includes the motor skills tests, biomechanics performance diagnostic, standardized competition or game observation, sports medicine and biochemical function tests and psychological tests.
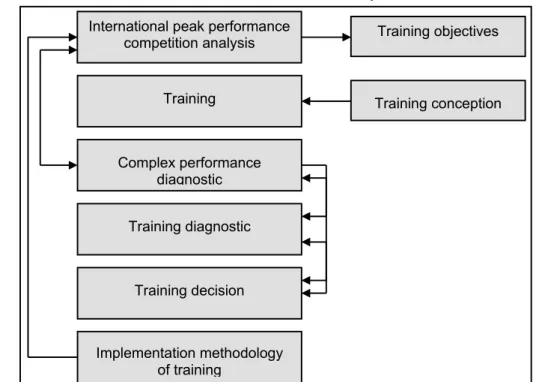
(Reinhold, 2008) also defined the performance diagnostic as a term and identify of the individual components, a level of player performance or a performance condition and it is used to training management and control. According to (Schiffer, 1993) who showed that performance diagnostic, performance control and training plan have a very close relationship to each other. Therefore, these components could not be isolated in the complex training control. The below Fig. 1 present the internal relations between various components to each other.
Fig. 1: The functional chain for developing the sport specific performance (Martin, 1999), page 37.
A review of different fitness tests definitions shows that the determination of performance status for sport players related with more factors as demands of every sport, age and gender. Furthermore, the influence of these factors size on player performance will be influencing the results of the complex performance tests.
2.1.2 Benefits of fitness testing
It is important to optimize and develop player performance and this process to assess a player performance requires a determination of requirements and the continuous determination of physical performance using appropriate methods and procedures. The aim is to assess the performance achieved as quickly as the players.
Performance tests for sport players can be designed to cover the physical fitness components, technical and tactical of the game. Fitness testing is used throughout players to document, assess and predict sports performance (Bangsbo, 2003).
It is important that the players and coaches obtain objective information about the player’s physical fitness characteristics to clarify the objectives of training. A successful training program for these players is one that will maximize all of the required skill and fitness components of the game. An essential part to any training program is fitness performance testing, which can help identify weaknesses, monitor progress, provide feedback, educate coaches and players, and predict performance potential (Bangsbo, 2003; Carling et al., 2009).
Fitness tests are the only effective and objective way to evaluate a training program. The use of post testing data permits accurate evaluation of many qualities. A coach will be able to see progress since the player’s previous tests or compare data with a previous group of players of the same age, position, or experience (Bisanz & Gerisch, 2008a; Schmid & Alejo, 2002). The particular test mode and outcome measures chosen must therefore be selected carefully in order to meet the objective of monitoring the effectiveness of player’s physical preparation (Cronin & Hansen, 2005).
Physical fitness characteristics of player in top sports depends on the players technical, tactical and physiological characteristics. These components are closely linked to each other. In sports such as soccer and rugby union, players perform different types of exercise ranging from standing still to maximal running with varying intensity. Therefore, Competitive naturally provides the best test for players, but it is difficult to isolate the various components within the sport and get objective measures of sport performance without performance testing for all players. Fitness testing can provide relevant information about specific parts of a sport (Bangsbo, Mohr, Poulsen, et al., 2006).
Thus performance diagnostic is important tool for both players and coaches, who would uses it as a predict factor for their training process and consequences, weather in top level elite sports or to improve non-elite players and for identification talent in field team sports as soccer and rugby union.
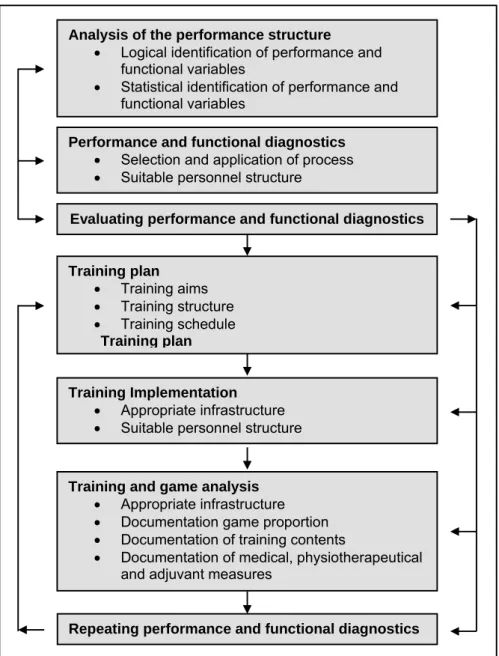
(Freiwald et al., 2008) have identified, how coaches and players in high elite soccer levels take advantages from performance diagnostics data, as an important feedback and consequences for their training monitors and process Fig. 2, and also reported that training aims will be achieved from documented (databank) performance diagnostics tests through each of special training sessions, physiotherapy, adjuvant medical, psychological and nutritional measures.
Fig. 2: Block diagram of performance and function diagnostics in high elite soccer players (Freiwald, et al., 2008), page, 22.
The recommendation of (Freiwald, et al., 2008) about the advantages of performance diagnostics data as a feedback and consequences for training process consistent with (Baechle & Earle, 2008) who suggested that the end of the competitive season, coaches should assist each players in establishing training goals for the off-season and help develop the using programs needed to achieve those goals.
Analysis of the performance structure
Logical identification of performance and functional variables
Statistical identification of performance and functional variables
Performance and functional diagnostics Selection and application of process
Suitable personnel structure
Evaluating performance and functional diagnostics
Training plan Training aims Training structure Training schedule Training plan Training Implementation Appropriate infrastructure
Suitable personnel structure
Training and game analysis Appropriate infrastructure
Documentation game proportion
Documentation of training contents
Documentation of medical, physiotherapeutical and adjuvant measures
There are many reasons for performance testing and evaluating training processes. (Bangsbo, 2003; Carling, et al., 2009; Dick, 2007; Ebben, 1998; Gamble, 2010; Reiman & Manske, 2009; Reinhold, 2008; Sayers et al., 2008; Thiess & Schnabel, 1995) demonstrated the next reasons for performance tests, which all field team sports as soccer and rugby players and coaches need it to be successes in their sport:
to assess the current physical state of the players,
to study the effect of a training programme,
to motivate players to train harder,
to give players objective feedback,
to make players more aware of the objectives of the training,
to evaluate whether a players are ready to play a competitive matches,
to plan short and long term training programmes,
to determining players positions placement and ranking them,
to establish homogeneous groupings for training and place players in small sides training,
to establish the physical characteristics demanded of a given sport,
to identify a relationship between individual performance capacities and demands of competition,
to monitor progress during rehabilitation or determine whether an athlete is ready to compete and monitor his health status,
to examine the development of performance from year to year,
to enable future performance to be predicted, and
to provide data for scientific research on the limitations of performance. Fitness tests results provide baseline scores on various measures of player’s ability, so that realistic goals can be set and degree of improvement quantified. The following points should be considered when establishing aims for the player:
the coach must be aware of the basic physical abilities required for performance at the competitive level of the team and how can make training for this,
the coach must have enough knowledge about exercise science to have a good idea of what a training program can achieve for each individual on the team and also designed for every time in season,
the coach should encourage players to internalize the goals to promote the physical, mental, and emotional commitment necessary to work toward the goals,
players should keep one or more copies of the goals in places where they will be seen daily, and
players should make their goals known to their training partners so they can work together and motivate each other to achieve their goals (Baechle & Earle, 2008).
Physical fitness tests will be useful if it is repeated at regular intervals and same procedures. In this way can progress be monitored or issues affecting performance be identified. Therefore, the accurately physical fitness tests must be selected tests that are valid, reliable and objective. From this background, it is necessary to present and understand the scientific criteria of measurement methods.
2.1.3 Criteria of fitness testing
There is a need for a review of quality criteria and the feasibility of physical fitness characteristics tests in field team sports. (Baechle & Earle, 2008; Dick, 2007) demonstrated that the fitness testing procedure must be objective (consistency of result and irrespective of tester), reliable (consistency of reproduction) and valid (testing what it purports to test). These three characteristics are the key factors in evaluating test quality and must be present for the test to be beneficial.
2.1.3.1 Test objectivity
Objectivity is known as intertester reliability. A test that is objective will produce the same results for the same players, regardless of the tester, or technician administering the test. Objectivity is quantified by calculating the correlation between pairs of test scores measured on the same individuals by two different
technicians. The value of correlation is known as the objectivity coefficient. The most of physical fitness tests have high objectivity coefficients (r > 0.90), especially when technicians are highly trained, practice together and carefully follow standardized testing procedures (Heyward, 2006). The correlation coefficient used as a measure of objectivity, which is calculated from the collected test findings of various investigators on a sample of subjects.
The following Tab. 2 according to (Bös et al., 2000) present the evidence interpretation of correlation coefficients:
Tab. 2: Evidence interpretation of the amount of correlation coefficients (Bös, et al., 2000), page, 169. r – value Significant = 0.00 No correlation 0.00 ≤ 0.39 Low correlation 0.40 ≤ 0.69 Moderate correlation 0.70 ≤ 0.99 High correlation = 1.00 Perfect correlation
The choice and quality of fitness tests equipments are essential factors in measuring and assessing key components of physical fitness performance. (Carling, et al., 2009) according to (Katz, 2001) showed, that the criteria for success of the various applications and resources used to assess contemporary performance in sport should:
be based on techniques that are currently being used and for which there is clear evidence of success,
address clearly defined and measurable needs,
be interactive and responsive, in real time, to client needs,
be transferable yet customizable across sporting environments,
result in positive changes which may impact on attitudes, performance and/or costs, and,
integrate technology with easy to use interfaces that are reliable, effective, efficient and transparent to the user.
2.1.3.2 Test validity
Fitness tests must measure the component of fitness that they are supposed to. Validity refers to the degree to which a test or test item measures what it is supposed to measure and it is the most important characteristic of testing. Thus, validity refers to the ability of the interpretation of scores from a fitness test and the most important consideration in measurement (Baechle & Earle, 2008; Thomas et al., 2011).
With regard to physical fitness testing, test validity is the ability of a test to measure accurately, with minimal error and a specific physical fitness component. Reference and criterion methods are used to obtain direct measures of fitness components. However, some fitness components cannot always be measured directly and requiring the use of indirect measures for estimation of the value of the reference measure (Heyward, 2006).
According to (Baechle & Earle, 2008; Thomas, et al., 2011) who considered that the validity involves four types that known as face, content, criterion and construct validity:
1. Face Validity is the degree to which a measure obviously involves the
performance being measured and also known as logical validity. If a fitness test item has face validity, the player is more likely to respond to it positively.
2. Content validity is the assessment by experts that the fitness test covers
all relevant subtopics or components abilities in appropriate proportions. Examples of component abilities in players are jumping ability, sprinting ability and muscular strength of the arms.
3. Criterion validity is the degree to which scores on a fitness test are
related to some recognized standard or criterion. There are three types of criterion validity: concurrent, predictive and discriminate validity. The
concurrent validity is the extent to which test scores are associated with
those of other accepted tests that measure the same ability. Predictive validity is the extent to which the test score corresponds with future
test score with some measure of success in the sport itself. Discriminate validity is the ability of a test to distinguish between two different
constructs and is evidenced by a low correlation between the results of the test and those of tests of a different construct.
4. Construct validity is the ability of a test to represent the underlying
construct and refers to overall validity, or the extent to which the test actually measures what it was designed to measure.
In addition to test validity, test sensitivity and specificity are often reported. Sensitivity refers to the probability of correctly identifying individuals who have risk factors. Specificity is a measure of the ability to correctly identify individuals with no risk factors (Heyward, 2006).
2.1.3.3 Test reliability
Reliability is a measure of the degree of consistency or repeatability of a test. If a player his ability does not change, when measured two times with a perfectly reliable test, the same score is obtained both times. In an unreliable test, the player could obtain a high score on one day and a low score on another, thus a reliable test produces must be gave the same results if repeated (Baechle & Earle, 2008).
It is important to know that the fitness test reliability affects test validity. Tests with poor reliability will be also having poor validity because unreliable tests fail to produce consistent test scores. Also it is possible for a fitness test to have excellent reliability but poor validity. Even, when a test yields stable and precise values across trials or between days (Heyward, 2006).
There are several ways to determine the reliability of a fitness test. The most obvious one is to administer the same test twice to the same group of players. Statistical correlation of the scores from the two administrations provides a measure of test-retest reliability. Any difference between the two sets of scores represents measurement error, which can arise from any of the following factors:
intrasubject (within subjects) variability,
intrarater (within raters) variability, and
failure of the test itself to provide consistent results.
Intrasubject variability is a lack of consistent performance by the person tested. Interrater reliability, also referred to as objectivity or interrater agreement is the degree to which different raters agree (Baechle & Earle, 2008).
(Reiman & Manske, 2009) has been defined the two main forms of reliability: 1. Intrarater reliability is the reliability of a test of measurement based on
the degree of similarity of results obtained by one rater during different performances of the given test.
2. Interrater reliability is the reliability of a test of measurement based on
the degree of similarity of results obtained from different researches using the same equipment and methods.
Finally, fitness tests to be valid it must be reliable, but a reliable tests may not be valid because the test may not measure what it is supposed to measure. For more details and descriptions of reliability specifications methods, it will be found in (Baechle & Earle, 2008; Reiman & Manske, 2009; Thomas, et al., 2011).
2.2 Physical characteristics of soccer and rugby players
The aim of sport training for every high level sport requires an understanding of the physical and physiological characteristics that demands of the game, which motivated the players in competition. The scientific studies that investigated the differences between field team sports such as all football codes sports very important to describe the trends of modern training methods.
The physical fitness demands in field team sports and training are closely dependent on the physical capacity of the player, technical abilities, and tactical role, playing position, style of playing, the opponent, as well as numerous environmental and internal factors. These elements are closely linked to each other, for example the technical quality of players may not be utilized if the player’s tactical knowledge is low. The physical fitness characteristics demands in sports games are related to the activities of the players during their matches (Mohr et al., 2003). In some sports as soccer and rugby union, it is very important for the players to have a very high physical capacity at least in one of the categories to perform at a top level and players may need an all-round fitness level (Bangsbo, et al., 2006).
Physical fitness and physiological profile investigations in field team sports have been conducted in soccer (Hoff & Helgerud, 2004; Pieper et al., 2010; Reilly & Williams, 2003; Reinhold, 2008; Sporis et al., 2009; Stolen, et al., 2005; Svensson & Drust, 2005; Tumilty, 1993) and in rugby union (Deutsch et al., 2007; Duthie, et al., 2003; Maud, 1983; Nicholas & Baker, 1995; Reilly, 1997; Rigg & Reilly, 1988; Roberts et al., 2008). In addition, a direct comparisons in some physical characteristics between soccer and rugby players have been also investigated by (Brick & O'Donoghue, 2005; Kuhn, 2005).
In general, soccer and rugby players require; moderate aerobic capacity between 55-65 ml·kg-1·min-1 depending on their positions, a high anaerobic
power, quick recovery between high intensity work bouts, high acceleration rate from different position at speed, the ability to change their directions and a superior vertical jump performance.
In addition, rugby union as contact football codes require players to have a high degree of muscularity, combined with exceptional levels of upper and lower body strength and power. Thus, an understanding of the components of the physical fitness characteristics in soccer and rugby players is very important to describe and profile these players at high top levels.
2.2.1 Anthropometric and personal characteristics
Anthropometric and personal characteristics involve more factors such as age, height, weight and body mass index (BMI). In this section, only age, height and body weight and (BMI) of soccer and rugby players would be focused on.
2.2.1.1 Definition of anthropometric
(Reiman & Manske, 2009) define anthropometry as, the science of measuring the physical parameters of the human body. Anthropometry is often used to evaluate a player’s size, shape, body proportions, body composition and degree of asymmetry between the dominant and non-dominant limbs.
(Heyward, 2006) has defined also the anthropometry, as the measurement of body size and proportions. The measurement includes body weight, height, circumference, skinfold thickness, bone widths and lengths.
Anthropometry includes the measurements of age, weight, height, specific segment lengths, skeletal breadths, limb circumferences and skinfold thickness. And it is a series of systematized measuring techniques that express quantitatively the dimensions of the human body (Maud & Foster, 2006).
Different field team sports have different anthropometric characteristics, therefore specific anthropometric variables should be used for talent identification in different sports and describe the elite top levels players such as soccer and rugby players.
2.2.1.2 Anthropometric and personal characteristics of soccer players
For many sports, there are specific physical characteristics, which indicate suitability for, or potential to compete in this sport at the highest level. Anthropometric characteristics of players have been shown to be responsible
predictors for participation at the highest level in sports such as soccer. (Hazir, 2010) reported that, In order to compete at an elite level, soccer players are expected to possess morphological and physiological characteristics, that are applicable both for the sport of soccer and specifically to their playing position. The assessment and determination of the anthropometric characteristics is essential to a successful achievement of a soccer team not only during a game but also during the whole season. This information about anthropometric characteristics can and must be used by the coach to change the player’s function or even the tactical formation of the whole team, with the purpose to maximize the performance, once each positioning presents specific features (Shephard, 1999). In addition, there are anthropometric and fitness predispositions for the different playing positions within soccer.
Significant differences in a variety of anthropometric characteristics such as height and body weight have previously been reported across soccer players, suggesting that these variables denote a morphological optimization within soccer and that anthropometric measurement of players should therefore be an integral part of a performance profiling program (Da Silva et al., 2008; Reilly et al., 2000).
2.2.1.2.1 Age of soccer players
(Reilly, 1996) stated that world top class soccer players tended to have an average age of 26-27 years with a standard deviation of about 2 years. Goalkeepers seem to have a longer career life than players in other positions. (Bangsbo, 1994c) discovered that the average age of goalkeepers were higher than other positions in the teams. As (Reilly, 1996) explained the age difference might be because the goalkeepers had a relatively lower possibility of chronic injuries and degenerative trauma.
Players in elite levels are generally at their peak playing power in the age of 25 years. In this age they have been exposed to high level training or practice for ± 10 years in accordance with the 10 year rule to achieve an exceptional standard of performance. Their peak playing ability generally lasts for 5-6 years, because
at this age the player has acquired the peak levels of fitness that the game requires combined with the time spent training and honing their specific skills (Helsen et al., 2000).
The optimal peak playing age for an elite soccer or individuals players, at which they perform their best is said to be in the range of 24-27 years. In this study, the mean age of the soccer players is 24.57 ± 4.33 years, current study relatively confirmed the results of (Bloomfield et al., 2005) who reported mean age for Bundesliga players of 23.2 ± 1.1 years and 23 ± 1.2 years from 4 European soccer leagues.
In any case, (Shephard, 1999) shows that the mean difference age years between soccer players at elite levels is unclear however, the increase in average age range of the soccer team versus the peak playing age range, is determined by an accumulation of skills, incipient deterioration in physical characteristics or loss of personal motivation. However, with the advancement in training methods and the continued exposure of elite skills and playing tactics to players at a younger age, it would not be unexpected of elite soccer players to reach their peak playing potential one or two years earlier, which could enable them to perform optimally for longer.
2.2.1.2.2 Height of soccer players
Height might be a factor to determine which position a player played. Obviously, the tall players tended to have advantages in certain positions such as goalkeepers. (Reilly, et al., 2000) stated that there were likely to be anthropometric predisposition for positional roles, the taller players were seems the most suitable for central defensive positions and for the target player among the strikers or forwards. (Matkovic et al., 2003) suggested that body height is favorable for defenders in actions in which the ball is received or fought for by the head and on the jump or standing on the ground. Body height is, therefore, definitely important when directing a player towards specific position related or tactical roles in the game.
(Al-Hazzaa et al., 2001; Bangsbo, 1994c) reported that in order to a team to be successful, it is essential that both its center backs and the goalkeepers have a privileged height, as they perform a higher amount of vertical jumping, and thus, they are willing to be successful in their movements. Opposite to this, running backs, midfielders and strikers are lower and rather run with the ball, and they are quicker, and this fact grants to them an additional advantage against the center backs.
In a study by (Bangsbo, 1994b) of 65 elite Danish players, goalkeepers and central defenders were the tallest 1.90 ± 0.06 and 1.89 ± 0.04 m, respectively. However, the mean height of full-backs, midfield and forwards players were relatively similar 1.79 ± 0.06, 1.77 ± 0.06 and 1.78 0.07 m, respectively. Within each group of Danish soccer players, a large range was observed (e.g. the tallest forward was 1.90 m and the shortest was 1.67 m). This variability of height mass may be influence the tactical role allocated to the individual players. The tall forward might be used as a target player for high balls, whereas the short forward may prefer to run for balls played deep into the opponent’s defense.
(Matkovic, et al., 2003) stated that, it is highly probable that the height itself does not guarantee the success in the game. Nevertheless, it is also likely that a particular body height at a younger age has an important role in the selection of players as for determining their position in play even before entering the senior competition level and accordingly the adaptation of training. Additionally, when dealing with body height, the fact that it is connected with the ethnic component should be taken into consideration. For instance, the Asian players are on the average significantly shorter than European or American players.
2.2.1.2.3 Body weight of soccer players
(Reilly, 1996) has been noted that a particular body size usually results in a player acquiring certain skills and gravitation towards a specific playing position or role within the team. (Reilly, 1990) pointed out that body mass played an important role in fitness for soccer player. Also, excess mass in form of fat might
be detrimental to player’s performance. Furthermore, reported that low percentage body fat would generate higher forces for jumping, kicking and tackling. (Bangsbo, 1994b) observed that, goalkeepers and central defenders elite soccer players were the heaviest, while the mean body mass of full-backs, midfield players and forwards were relatively similar in body weight.
Regional differences in the physical make-up of soccer teams across Four European professional soccer leagues are shown to exist with players from the German Bundesliga, reporting higher values for body mass and BMI than players from the English Premier League, Spanish La Liga Division and Italian Serie A (Bloomfield, et al., 2005), and reported, it could be suggested that play in the Bundesliga is based on power and athleticism. (Reilly & Williams, 2003) found that the soccer player accumulated body fat during off-season period. Therefore, it was important for the players to maintain certain physical activity levels and suitable diets during off-season.
2.2.1.2.4 Body mass index (BMI) of soccer players
The relation between height and body mass is equally important due to the fact that modern football implies duel play, jump head play, fast activities (alternating offense and defense), all of which are linked to efficient realization and the obligatory playing time during the entire match (Hazir, 2010; Matkovic, et al., 2003; Reilly & Williams, 2003).
Soccer is an aerobic-anaerobic (stop-go) type of sport with alternate phases of high load as sprints, fast zigzag running, jumps and sudden stops. Practically in all activities a player carries his mass, moves it against the force of gravity so that each excess of body fat represents an overload which additionally burdens the energy mechanisms and makes the execution of a whole series of activities, especially the jumps and sprints, more difficult (Matkovic, et al., 2003).
Study by (Ostojic, 2003) has recorded body fat percentage levels over the course of an entire season which includes values at pre-season, start of the season, mid-season and at the end of the season. The results of this study found that the estimated body fat percentage at the end of the season 9.6 ± 2.5
% was significantly lower than levels recorded at preseason 11.5 ± 2.1%, the start of the season 10.9 ± 2.4%, as well as at the mid-season period 10.2 ± 2.9%.
There were however, no significant differences between measurements performed during the season. The main reason for lower values at the end of the season is as a result of both the effect of competition as well as the continued intensity of training that occurs during the playing season. (Ostojic & Zivanic, 2001) have also demonstrated that in addition to obvious benefits associated with decreased levels of body fat percentage for soccer players, the main benefits experienced by is improvements in sprint times, which continue to decrease as the intensity of the season increases.
2.2.1.2.5 Anthropometric and personal characteristics review in previous soccer studies
The literature reviewed in the following Tab. 3 includes studies published from the recent years to the present, which tested and reported anthropometric measurements of elite and professional soccer players. These data were compiled with the anthropometrics data that was collected in this study from professional soccer players in the Bundesliga to contribute to the final soccer specific table of updated normative values.
Tab. 3: Comparison between anthropometric variables assessed in this study with reported values from previous studies in elite and professional soccer players (mean ± SD).
References Nationality Level n Age Height Weight BMI*
(year) (m) (kg) (kg.m-2)
(Aziz et al., 2000) Singaporean Professional 23 21.9 ± 3.6 1.75 ± 0.06 65.5 ± 6.1 21.39 (Rienzi et al., 2000) South American Elite 11 26.1 ± 4.0 1.77 ± 0.06 76.4 ± 7.0 24.39 (Al-Hazzaa, et al., 2001) Saudi Arabian Elite 154 25.2 ± 3.3 1.77 ± 0.06 73.1 ± 6.8 23.33 (Casajus, 2001) Spanish Professional 15 26.3 ± 3.1 1.80 ± 0.07 78.5 ± 6.4 24.23 (Cometti et al., 2001) French Elite 29 26.1 ± 4.3 1.80 ± 0.04 74.5 ± 6.2 22.99 (Strudwick, et al., 2002) English Elite 19 22.0 ± 2.0 1.77 ± 0.06 77.9 ± 8.9 24.87 (Matkovic, et al., 2003) Croatian Elite 57 23.2 ± 3.5 1.81 ± 0.06 77.6 ± 5.7 23.69
(Ostojic, 2003) Serbian Elite 30 23.5 ± 3.1 1.83 ± 6.0 76.8 ± 6.1 22.93
(Mohr, et al., 2003) Italian Professional 18 26.4 ± 0.9 1.80 ± 0.01 75.4 ± 1.5 23.27 (Wisloff et al., 2004) Norwegian Elite 17 25.8 ± 2.9 1.77 ± 4.1 76.5 ±7.6 24.42 (Bloomfield, et al., 2005) English Professional 578 26.3 ± 4.8 1.81 ± 0.06 75.3 ± 7.3 22.90 (Bloomfield, et al., 2005) German Professional 480 26.6 ± 4.4 1.83 ± 0.06 77.5 ± 6.4 23.20 (Bloomfield, et al., 2005) Italian Professional 499 26.4 ± 4.4 1.81 ± 0.05 74.3 ± 5.4 22.80 (Bloomfield, et al., 2005) Spanish Professional 528 26.5 ± 4.0 1.80 ± 0.06 75 ± 5.6 23.10 (Bloomfield, et al., 2005) Europeans Professional Total 2085 26.4 ± 4.4 1.81 ± 0.06 75.5 ± 6.3 23.00 (Kalapotharakos et al., 2006) Greek Elite 19 26.0 ± 4.0 1.80 ± 5.0 78.0 ± 4.5 24.07 (Reinhold, 2008) German Professional 53 24.9 ± 4.3 1.83 ± 7.0 78.6 ± 7.1 23.47
(Dellal et al., 2008) French Elite 10 26.0 ± 2.9 1.81 ± 5.9 78.3 ± 4.4 23.90
(Hazir, 2010) Turkish Elite 161 25.7 ± 3.73 1.78 ± 5.66 76.1 ± 6.18 24.02
(Hazir, 2010) Turkish Professional 144 24.1 ± 4.27 1.78 ± 5.90 73.9 ± 6.34 23.32 (Hoppe et al., 2012) German Professional 11 23.8 ± 3.0 1.79 ± 8.9 76.6 ± 8.6 23.91 (Silva et al., 2012) Portuguese Professional 13 25.7 ± 4.6 1.78 ± 5.7 76.5 ± 9.2 24.14 (Freiwald & Baumgart, 2012) German Professional 14 24 ± 3.95 1.82 ± 0.04 80.60 ± 6.38 24.18 Present study German Professional 14 24.57 ± 4.33 1.85 ± 0.07 83.86 ± 8.5 24.50 * BMI based on mean values of height and body weight
According to previous studies in Tab. 3, the anthropometric profile in elite and professional soccer players reported range of average age between 21.9 ± 3.6 to 26.5 ± 4.0 years, height 1.75 ± 0.06 to 1.83 ± 6.0 m, body weight 65.5 ± 6.1 to 78.6 ± 7.1 kg and (BMI) between 21.39 to 24.87 kg.m-2.
The anthropometric profiles difference between elite and professional soccer players of previous studies may be caused by several reasons such as morphological factors of players, strategies for talent selection and the system nation leagues in their federations. For example, the study by (Bloomfield, et al., 2005) indicates that top leagues in Spain and Italy had a shorter and lighter players compared to those in England and Germany, especially in midfield and forward positions.
Generally, anthropometric profiles of elite and professional soccer players around different leagues don’t wide to each others and not significantly differ from the normal population as for their morphological characteristics body height and body weight. The difference between them in (BMI) is result of a specific training process and related to the body fat between them.
2.2.1.3 Anthropometric and personal characteristics of rugby players
Descriptive anthropometric characteristics offer information that can be used to analysis the size, proportionality and body composition of rugby players. This players profile can be used in rugby union sport to design an exercise and nutrition interventions for improving health and performance, for talent identification, analysis specific physical characteristics to the sport, work rate, evolutionary trends, injuries and comparisons between countries (Holway & Garavaglia, 2009).
Because of the game physical requirements and its relatively recent development in 1995, the size characteristic of rugby players has increased substantially. Most likely due to a combination of factors such as higher selection pressures and improved talent identification, nutritional and training (Olds, 2001).
With the evolution of rugby union sport development, factors such as sport training, greater access to sport science, full-time training staff and coaches and desire for more physical players. For these factors, there is a need to greater player development and a marked increase in player size such as height, body weight and body mass index.
The differences between specific positions in these anthropometrical measures demonstrate the heterogeneous nature of contact team sport players such as rugby union. A high degree of variation in the size of players exists due to each positions unique role and requirements within competition (Holway & Garavaglia, 2009; Reilly, 1997).
2.2.1.3.1 Age of rugby players
There are lack researches that described the age difference between countries or play levels in top elite and professional rugby players. (Nicholas, 1997) in descriptive anthropometric and physiological study for rugby players, demonstrate that the age ranges mean between 21 to 28.5 years for 15 teams from United States, South Africa, Germany and England, also reported age mean for forward players between 23 to 30 years and for back players between 22 to 26 years.
The study of (Brick & O'Donoghue, 2005) reported age mean of 28.8 ± 3.9 years for forward players and 21.2 ± 2.2 for back players, as same as study of (Kuhn, 2005) reported age mean of 23 ± 3.0 years for forward players and 22.4 ± 3.5 years for back players in rugby union team, who competed in highest national league in Germany.
The optimal peak playing age for elite rugby players, at which they perform their best is said to be in the range of 24-27 years. In this study, the mean age of the rugby players was 24 ± 3.94 years, and relatively confirmed the results of (Appleby et al., 2011) who reported mean age of 24.4 ± 3.4 years for rugby players.
2.2.1.3.2 Height of rugby players
Height as an anthropometrical factor is useful in sports involving jumping, while body mass is useful in contact sports such as rugby union and American football. Height differences among the various positional groups in rugby union are unclear (Duthie, et al., 2003). Previous studies have demonstrated that county and international forwards and backs have similar height (Olds, 2001). On the other hand, others have shown that forwards are markedly taller than backs of the same level (Nicholas, 1997; Nicholas & Baker, 1995; Quarrie et al., 1996). It would be fair to assume that elite level rugby players have greater height than non-elite players, since height is an essential at higher levels of performance, especially in the forwards.
In contrast, the Bledisloe cup study (1972 to 2004) shows that forwards have become slightly shorter, whereas backline players have become taller. It may be reasoned that the decrease in height of the forwards associated with the introduction of the law permitting line-out3 jumpers to be supported in the line-out. This law allows good lifters to overcome slight disadvantages in the height of the jumper. This law also introduced new requirements for successful line-out play, such as visual acuity, timing, and the ability to coordinate between the jumpers, lifters and hooker throwing in the ball (Quarrie & Hopkins, 2007). These differences in height factor are all based on the positional roles and requirements of the players.
2.2.1.3.3 Body weight of rugby players
There has been a significant change in the body weight of elite rugby players over the past 20 years, with the increase being greater than what would be expected for the normal upward trend in the population (Olds, 2001). Consequently, literature older than ten years may have limited application to current day rugby players (Duthie, et al., 2003), especially with increased professionalism and the physical demand of top professional level rugby union constantly progressing.
3 Line-out: It is a way to restart play, after the ball has gone into touch, with a throw-in between
The Bledisloe cup study (1972 to 2004) showed that, body weight of both forward and back players increased significantly 7.1% and 12.3%, respectively. The most successful teams had greater mass in the forwards. A greater body mass confers an advantage in the contact phases of the sport, because of the great momentum players are able to generate (Quarrie & Hopkins, 2007).
An increased focus on weight training and usage of nutritional supplements may also have contributed to the increase changes in body mass (Duthie, et al., 2003). It is logical to assume that the accelerated increase in body mass over the past 30 years can be attributed to better knowledge and implementation of programmes invol