1- PhD Student, Regional Knowledge Hub and WHO Collaborating Centre for HIV Surveillance, Institute for Futures Studies in Health, Kerman University of Medical Sciences, Kerman, Iran
2- Professor, Regional Knowledge Hub and WHO Collaborating Centre for HIV Surveillance, Institute for Futures Studies in Health, Kerman University of Medical Sciences, Kerman, Iran
3- Associate Professor, Research Center for Modeling in Health, Institute for Futures Studies in Health, Kerman University of Medical Sciences, Kerman, Iran
Correspondence to: Mohammad Reza Baneshi PhD, Email: [email protected]
Saiedeh Haji-Maghsoudi MSc
1, Ali Akbar Haghdoost PhD
2,
Mohammad Reza Baneshi PhD
3Abstract
Background:Prisoners, compared to the general population, are at greater risk of infection. Drug injection is the main route of human immunodeficiency virus (HIV) transmission, in particular in Iran. What would be of interest is to determine variables that govern drug injection among prisoners. However, one of the issues that challenge model building is incomplete national data sets. In this paper, we addressed the process of model development when missing data exist.
Methods: Complete data on 2720 prisoners was available. A logistic regression model was fitted and served as gold standard. We then randomly omitted 20%, and 50% of data. Missing date were imputed 10 times, applying multiple imputation by chained equations (MICE). Rubin’s rule (RR) was applied to select candidate variables and to combine the results across imputed data sets. In S1, S2, and S3 methods, variables retained significant in one, five, and ten imputed data sets and were candidate for the multifactorial model. Two weighting approaches were also applied.
Findings: Age of onset of drug use, recent use of drug before imprisonment, being single, and length of imprisonment were significantly associated with drug injection among prisoners. All variable selection schemes were able to detect significance of these variables.
Conclusion:We have seen that the performances of easier variable selection methods were comparable with RR. This indicates that the screening step can be used to select candidate variables for the multifactorial model.
Keywords:Missing data, Multiple imputation, Drug injection, Prison, Variable selection
Citation:
Haji-Maghsoudi S, Haghdoost AA, Baneshi MR. Selection of Variables that Influence Drug
Injection in Prison: Comparison of Methods with Multiple Imputed Data Sets. Addict Health 2014;
6(1-2): 36-44.
Received:
11.07.2013
Accepted:
09.10.2013
Introduction
Human immunodeficiency virus (HIV) is an important public health concerns.1 It has been shown that about 10% of new HIV infections
occur in an injecting drug user (IDU).2
Furthermore, the prevalence of HIV infection was very high among IDUs, especially when harm reduction initiatives were not available.1,3 In addition, other countries' experiences suggest that the incidence and prevalence of HIV infection can increase rapidly among IDUs.1,3 In Iran, about 65% of reported HIV cases have been attributed to drug injection.4 In the Middle East and North Africa (MENA) region, the main route of HIV transmission is through drug injection.5
Evidence in the last three decades indicates that a group which is at high risk of HIV infection, and therefore needs careful attention, is prisoners. Use of non-sterile injecting equipment in prisons is one of the most important, independent determinants of HIV infection.6,7 In many countries, a considerable proportion of prisoners are drug dependent.8 In addition, the prevalence of HIV among prisoners has been reported at 10% to 25%.9 Turnover of the prison population, paves the way for widespread infection in the general population as well.
It has been shown that the rate of sharing injection equipment in prisons is much higher than the community.7 This might partially justify the high rate of HIV infection among prisoners. Other influential factors are sexual activities, tattooing, and sharing of contaminated razor blades.10
What would be of interest is to identify the variables that persuade the prisoners to inject drugs in prison. This allows the development of a prediction tool to identify groups which are at high risk of drug injection.
Regression models are frequently used to assess the association between potential risk factors and a clinical outcome.11,12 Clearly predictions drive would be valid if the assumptions of models are satisfied by the data. One of the issues that challenge model building is incomplete records.
Missing data are common in national data sets due to several reasons. For example, people might refuse to respond to some questions, or blood samples taken from patients might be lost.13-15 Disadvantages of omission of incomplete records
have been addressed extensively in the
literature.16-19
The standard approach to impute the missing data is multiple imputations via chained equations (MICE). This process replaces each missing datum by different values, and therefore creates multiple data sets, typically 10.19-21 To identify the risk factors of the outcome (in our application drug injection in prison), the process follows by fitting separate regression models to each of 10 imputed data sets (10 models in total). Rubin’s rule (RR) provides a formula to combine regression coefficients and standard deviation (SD) across 10 data sets, to get aggregated odds ratios (OR), and to calculate a P-value for each variable. To apply backward elimination (BE) approach, the variable with the highest P-value is removed. Based on the remaining variables the whole process is repeated iteratively until all variables remain significant. Clearly, in RR the process of variable selection and combination of results are done simultaneously.11,22
The RR approach is time demanding. Therefore, alternative strategies have been proposed. In these approaches the process of variable selection is performed in each data set independently. In other words, after fitting of separate regression models to each data set, in a screening round, candidate variables for the multifactorial model are finalized. This is followed by the aggregation of estimates of selected variables across 10 data sets.22
An alternative is to combine all 10 imputed data sets to get one single data. Here the classic BE can be used to fit the final model and to identify significant variables. However, the sample size would be 10 times that of the original data. This artificially reduces SD and increases the chance of variables being significant. To tackle this problem, weighted regression methods can be implemented.22
There are few studies comparing the
performance of alternative variable selection methods. This manuscript has two interrelated aims; to identify the variables that govern drug injection in prison, and to compare alternative variable selection methods in presence of missing data.
Methods
In the present study, information of the national HIV Bio-Behavioral Surveillance Survey (BBSS)
among prisoners in 2009 was used. The dependent variable was history of drug injection (yes/no question). Independent variables were: history of imprisonment (in months); the onset of drug use; the main cause of recent incarceration including drug smuggling, murder, rape/sexual assault, violence/aggression, theft, smuggling of illegal goods, and financial crimes (all yes/no questions); dominant drug used in the last month before recent imprisonment [grass, ecstasy, heroin-crack, crystal, methadone, and alcohol (all
yes/no questions)]; education level; job
(4 categories); marital status (married, single,
divorced/widowed); and knowledge about
acquired immunodeficiency syndrome (AIDS). Information on 2720 prisoners was available. Using all data, a logistic regression model with BE variable selection was fitted to identify variables which influence the outcome. Results were considered as gold standard.
Then, missing data was generated at 20%, and 50%. Missing data were imputed 10 times. Applying standard RR approach, final estimates were derived. We then tried some alternative variable selection algorithms (S1, S2, and S3) as follows. In S1, based on the results of logistic regression in each imputed data set, only variables which retained significance at least in one imputed data set were candidate for the multifactorial model. In S2 and S3, variables which retained significance in more than 5 and in all 10 data sets were selected to be offered to the multifactorial model.
We also examined the performance of weighted regression approaches. We merged 10 imputed data sets to get one single set. Data were analyzed by fitting weighted logistic regression. Two weighting schemes were implemented (W1 and W2). In W1 weight of 0.1 was used. In W2 weight (1-f)/10 was applied where f is the mean of fraction of missing rate for all variables.22
To address the impact of event per variable (EPV), a random sample from the data was taken corresponding to an EPV of 5.23,24 All processes explained above were applied to this data set. Results of W1, W2, S1, S2, S3, and RR methods were compared in terms of estimated, OR, confidence interval (CI), and significance of variables. All analyses were done using Stata
Statistical Software (Vesrion 10), Release
(Stata Corporation, College Station, TX, USA), and
R package mice.
Results
The mean ± SD of age was 32.82 ± 8.56 years. Mean ± SD of time spent in prison was 26.20 ± 28.70 months. Around 52.0% of subjects were married. The majority of subjects had preliminary education. Only 3.7% were unemployed (Table 1). The most important reasons for being in prison were drug trafficking (52.6%) and robbery (25.8%). In total, 22.7% had a history of drug injection. The main drugs misused were heroin (51.5%), and crystal (13.3%). Mean ± SD of age of onset of drug use was 20.79 ± 6.36 years (Table 1).
Table 1. Descriptive statistics of demographic information
Variable Frequency
(Percentage) Education
Literate/illiterate 367 (13.5)
Primary school/guidance school 1790 (65.8) High school diploma/university degree 563 (20.7) Job Transit driver 148 (5.4) Seasonal worker 347 (12.8) Unemployed 100 (3.7) Other jobs 2125 (78.1) Marital status Single 946 (34.8) Married 1418 (52.1)
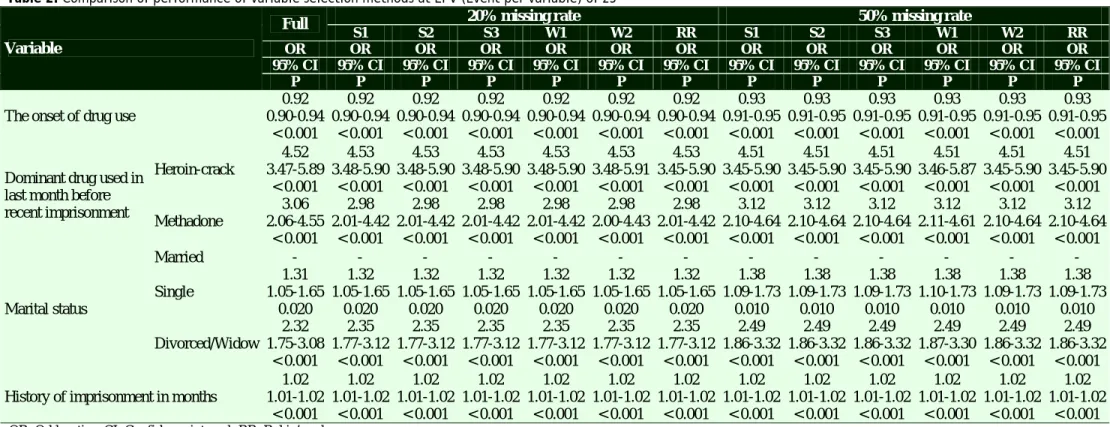
Other (widow, divorce, …) 356 (13.1) Of 2720 prisoners, 618 subjects had a history of drug injection in prison. This gave an EPV of about 25. After fitting logistic regression to complete data, 5 variables remained significant in the model (full model). The onset of drug use, drug use in the last months before imprisonment (heroin-crack and methadone), marital status, and length of stay in prison significantly influenced the outcome. Recent drug users were less likely to inject drugs in prison (Table 2). One year decrease in onset of drug use was associated with 8.0% reduction in risk of drug injection in prison (P < 0.001). Those who used drugs in the last month before imprisonment were at least 3 times more likely to inject drugs (OR = 4.52 in the case of heroin-crack, and 3.06 in the case of methadone). In comparison to married prisoners, single and divorced subjects were 31.0% and 132% more likely to inject drugs in prison (Table 2).
Table 2. Comparison of performance of variable selection methods at EPV (Event per variable) of 25
Variable
Full 20% missing rate 50% missing rate
S1 S2 S3 W1 W2 RR S1 S2 S3 W1 W2 RR
OR OR OR OR OR OR OR OR OR OR OR OR OR
95% CI 95% CI 95% CI 95% CI 95% CI 95% CI 95% CI 95% CI 95% CI 95% CI 95% CI 95% CI 95% CI
P P P P P P P P P P P P P
The onset of drug use
0.92 0.92 0.92 0.92 0.92 0.92 0.92 0.93 0.93 0.93 0.93 0.93 0.93
0.90-0.94 0.90-0.94 0.90-0.94 0.90-0.94 0.90-0.94 0.90-0.94 0.90-0.94 0.91-0.95 0.91-0.95 0.91-0.95 0.91-0.95 0.91-0.95 0.91-0.95 < 0.001 < 0.001 < 0.001 < 0.001 < 0.001 < 0.001 < 0.001 < 0.001 < 0.001 < 0.001 < 0.001 < 0.001 < 0.001 Dominant drug used in
last month before recent imprisonment Heroin-crack 4.52 4.53 4.53 4.53 4.53 4.53 4.53 4.51 4.51 4.51 4.51 4.51 4.51 3.47-5.89 3.48-5.90 3.48-5.90 3.48-5.90 3.48-5.90 3.48-5.91 3.45-5.90 3.45-5.90 3.45-5.90 3.45-5.90 3.46-5.87 3.45-5.90 3.45-5.90 < 0.001 < 0.001 < 0.001 < 0.001 < 0.001 < 0.001 < 0.001 < 0.001 < 0.001 < 0.001 < 0.001 < 0.001 < 0.001 Methadone 3.06 2.98 2.98 2.98 2.98 2.98 2.98 3.12 3.12 3.12 3.12 3.12 3.12 2.06-4.55 2.01-4.42 2.01-4.42 2.01-4.42 2.01-4.42 2.00-4.43 2.01-4.42 2.10-4.64 2.10-4.64 2.10-4.64 2.11-4.61 2.10-4.64 2.10-4.64 < 0.001 < 0.001 < 0.001 < 0.001 < 0.001 < 0.001 < 0.001 < 0.001 < 0.001 < 0.001 < 0.001 < 0.001 < 0.001 Marital status Married - - - - Single 1.31 1.32 1.32 1.32 1.32 1.32 1.32 1.38 1.38 1.38 1.38 1.38 1.38 1.05-1.65 1.05-1.65 1.05-1.65 1.05-1.65 1.05-1.65 1.05-1.65 1.05-1.65 1.09-1.73 1.09-1.73 1.09-1.73 1.10-1.73 1.09-1.73 1.09-1.73 0.020 0.020 0.020 0.020 0.020 0.020 0.020 0.010 0.010 0.010 0.010 0.010 0.010 Divorced/Widow 2.32 2.35 2.35 2.35 2.35 2.35 2.35 2.49 2.49 2.49 2.49 2.49 2.49 1.75-3.08 1.77-3.12 1.77-3.12 1.77-3.12 1.77-3.12 1.77-3.12 1.77-3.12 1.86-3.32 1.86-3.32 1.86-3.32 1.87-3.30 1.86-3.32 1.86-3.32 < 0.001 < 0.001 < 0.001 < 0.001 < 0.001 < 0.001 < 0.001 < 0.001 < 0.001 < 0.001 < 0.001 < 0.001 < 0.001 History of imprisonment in months
1.02 1.02 1.02 1.02 1.02 1.02 1.02 1.02 1.02 1.02 1.02 1.02 1.02
1.01-1.02 1.01-1.02 1.01-1.02 1.01-1.02 1.01-1.02 1.01-1.02 1.01-1.02 1.01-1.02 1.01-1.02 1.01-1.02 1.01-1.02 1.01-1.02 1.01-1.02 < 0.001 < 0.001 < 0.001 < 0.001 < 0.001 < 0.001 < 0.001 < 0.001 < 0.001 < 0.001 < 0.001 < 0.001 < 0.001 OR: Odds ratios; CI: Confidence interval; RR: Rubin’s rule
In addition, duration of stay in prison was positively associated with risk of drug injection. One month increase in imprisonment time was associated with 2% increase in risk of drug injection (OR = 1.02, P < 0.001).
At EPV of 25, with 20% and 50% missing rates, all variable selection methods provided results almost the same as the full model (Table 2). No considerable bias was observed in estimation of OR and its associated SD. Even the performance of S1 approach was satisfying.
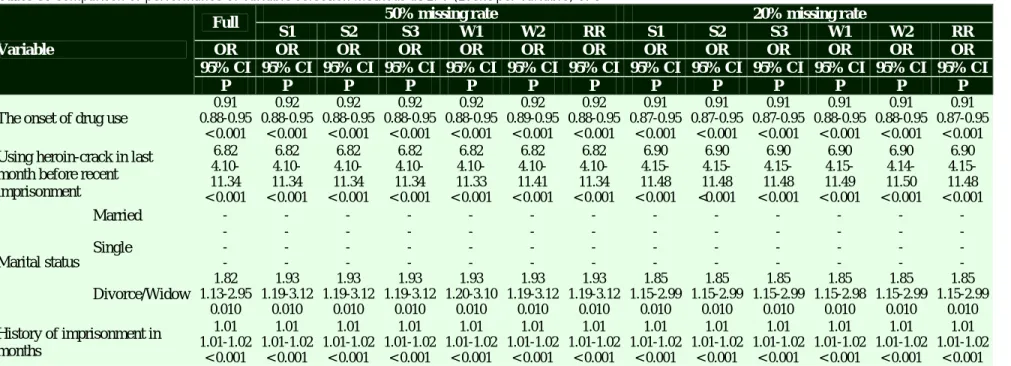
At EPV of 5, only the significance of marital status was lost in the full model (Table 3). However, performances of all variable selection methods were comparable. Both RR and less time demanding approaches were able to detect significance of all 5 variables.
Discussion
It has been argued that drug use among prisoners is prevalent, and quality of inmate programs inside prisons is much poorer than those for the general population.8,10,25 Evidence from studies in Iran showed that those who had a history of imprisonment in the past year had 38% rise in risk on needle and syringe sharing.4 In addition, a local study in Fars province revealed that the prevalence rates of HCV infection among incarcerated drug users was about 78%.26 This indicates that prisoners are at greater risk for some of the harms associated with drug use, and need a special care system.
The first aspect of our work was to reveal variables linked to drug injection in prison. Based on these result, age of drug initiation has a negative effect on drug injection. This means that the longer the period of the drug use, the higher the chance to inject drugs in prison; in addition, the longer the period of imprisonment, the greater the risk of drug injection. Being single, and use of heroin or methadone in the last month before imprisonments were also positively associated with the outcome.
Studies in different regions of the world, such as western and southern Europe, Russia, Canada, Brazil, Iran, and Thailand, have shown that a history of imprisonment is associated with HIV, HCV, or hepatitis B virus (HBV) infection among IDUs.7
The negative relationship between age of drug initiation and drug injection has also been confirmed in a Northern Thailand study.27 In a similar study in Germany, it has been found that a
history of imprisonment is associated with 50% increase in risk of HBV seropositivity.28 Moreover, a history of syringe sharing in prison is significantly associated with HBV, hepatitis B virus (HCV), and HIV infections.7 Another study in Nigeria showed that the duration of imprisonment and history of previous incarceration were significantly associated with HBV seropositivity.29
The second aspect of our work was to compare alternative variable selection methods when multiple imputed data sets exist. RR is the standard tool to analyze the missing data. However, application of this method in conjunction with BE variable selection method is time demanding. This highlights the importance of other algorithms to do the process of modeling.
Comparing imputation approaches, our results showed that performance of S1, S2, S3, W1, and W2 were similar to that of RR. S1 and S2 methods suggest that, in a screening round, variables reached significance level in at least 10% or 50% of generated data sets, and can be selected as candidate for multifactorial model. S3 is more conservative as it selects variables significant in all 10 data sets for multifactorial modeling. In addition, performance of weighed regression models was similar to RR. This hugely decreases the burden of the modeling process.
Wood et al. compared performance of RR, S1, S2, S3, W1, W2, and some other variable selection methods through a simulation study. The main criterion used to compare the models were power (the probability that a method correctly selects a given variable from the true model) and ‘type 1 error’ (the probability that a method wrongly selects a given variable not from the true model). Under logistic regression model simulations, results of RR were similar to the true model. S1 had highest type one error while performance of S3 was similar to the true model. The authors concluded that S3 works better than S1 and S2. In addition, it has been suggested that merging of data and application of weighted regression models is a good approximation of RR.22
One of the limitations of the study by Wood et al.22 was that only monotonic forms of associations were studied. The majority of studies showed that while standard regression models failed to detect significance of a variable, non-linear regression models were able to identify complex forms of association. Fractional polynomial (FP)
Table 3. Comparison of performance of variable selection methods at EPV (Event per variable) of 5
Variable
Full 50% missing rate 20% missing rate
S1 S2 S3 W1 W2 RR S1 S2 S3 W1 W2 RR
OR OR OR OR OR OR OR OR OR OR OR OR OR
95% CI 95% CI 95% CI 95% CI 95% CI 95% CI 95% CI 95% CI 95% CI 95% CI 95% CI 95% CI 95% CI
P P P P P P P P P P P P P
The onset of drug use
0.91 0.92 0.92 0.92 0.92 0.92 0.92 0.91 0.91 0.91 0.91 0.91 0.91
0.88-0.95 0.88-0.95 0.88-0.95 0.88-0.95 0.88-0.95 0.89-0.95 0.88-0.95 0.87-0.95 0.87-0.95 0.87-0.95 0.88-0.95 0.88-0.95 0.87-0.95 < 0.001 < 0.001 < 0.001 < 0.001 < 0.001 < 0.001 < 0.001 < 0.001 < 0.001 < 0.001 < 0.001 < 0.001 < 0.001 Using heroin-crack in last
month before recent imprisonment 6.82 6.82 6.82 6.82 6.82 6.82 6.82 6.90 6.90 6.90 6.90 6.90 6.90 4.10-11.34 4.10-11.34 4.10-11.34 4.10-11.34 4.10-11.33 4.10-11.41 4.10-11.34 4.15-11.48 4.15-11.48 4.15-11.48 4.15-11.49 4.14-11.50 4.15-11.48 < 0.001 < 0.001 < 0.001 < 0.001 < 0.001 < 0.001 < 0.001 < 0.001 <0.001 < 0.001 < 0.001 < 0.001 < 0.001 Marital status Married - - - - Single - - - - - - - - - - - - Divorce/Widow 1.82 1.93 1.93 1.93 1.93 1.93 1.93 1.85 1.85 1.85 1.85 1.85 1.85 1.13-2.95 1.19-3.12 1.19-3.12 1.19-3.12 1.20-3.10 1.19-3.12 1.19-3.12 1.15-2.99 1.15-2.99 1.15-2.99 1.15-2.98 1.15-2.99 1.15-2.99 0.010 0.010 0.010 0.010 0.010 0.010 0.010 0.010 0.010 0.010 0.010 0.010 0.010 History of imprisonment in months 1.01 1.01 1.01 1.01 1.01 1.01 1.01 1.01 1.01 1.01 1.01 1.01 1.01 1.01-1.02 1.01-1.02 1.01-1.02 1.01-1.02 1.01-1.02 1.01-1.02 1.01-1.02 1.01-1.02 1.01-1.02 1.01-1.02 1.01-1.02 1.01-1.02 1.01-1.02 < 0.001 < 0.001 < 0.001 < 0.001 < 0.001 < 0.001 < 0.001 < 0.001 < 0.001 < 0.001 < 0.001 < 0.001 < 0.001 OR: Odds ratios; CI: Confidence interval; RR: Rubin’s rule
model is a powerful tool to capture the optimum form of association between variables and outcome. This method applies a range of power transformations to independent variables and selects the one with the highest goodness of fit.30-33
If we analyze 10 imputed data sets independently, shape of association between independent variable and outcome can be checked across data sets. If shapes are not the same, ad hoc decision about combination of shapes across data sets should be made. Therefore, application of S1, S2, and S3 might not be valid. Another limitation of the study by Wood et al.22 was that the majority of scenarios were implemented for continuous outcome. In the case of binary outcome, missing data were generated under missing completely at random (MACR). In addition, 10% of information of each independent variable was dropped out. However, final attrition rate and EPV was not given.
One of the limitations of our study was that a limited number of independent variables which can predict the outcome were available. Another limitation of this study was the nature of variables. The majority of independent variables were dichotomous. Therefore, the issue of impact of continuous independent variables and the shape of association remains to be addressed. We should also highlight that we only generated one data set
at two EPVs and compared their performance under two missing rates (4 scenarios in total). We believe that under each scenario multiple data sets should be generated to address the impact of sampling variation. This can be an issue to be addressed in independent studies.
Conclusion
Besides these limitations, results of our study suggest that alternative variable selection methods, for example S1, S2, and S3, provide results which are comparable with RR. Application of such
methods and comparison of results is
recommended. This provides the opportunity to understand the scenarios in which easier variable selection methods provide results comparable with complicated methods.
Conflict of Interests
The Authors have no conflict of interest.
Acknowledgements
We would like to thank Dr. Abbas Sedaghat, Dr. Ehsan Mostafavi, and Dr. Soodabeh Navadeh who facilitated our access to data. We also express our thanks to the Center for Disease Control (CDC), and the Ministry of Health and Medical Education. This work has been granted by the research deputy of Kerman University of Medical Sciences.
References
1. Imani R, Karimi A, Rouzbahani R, Rouzbahani A. Seroprevalence of HBV, HCV and HIV infection among intravenous drug users in Shahr-e-Kord, Islamic Republic of Iran. East Mediterr Health J 2008; 14(5): 1136-41.
2. UNAIDS. Injecting drug use: focused HIV prevention works [Online]. [cited 2007 May 11]; Available from: URL:
http://www.unaids.org/en/Resources/PressCentre/Feat urestories/2007/May/20070511BPHighcoveragesites/ 3. Day C, Nassirimanesh B, Shakeshaft A, Dolan K.
Patterns of drug use among a sample of drug users and injecting drug users attending a General Practice in Iran. Harm Reduct J 2006; 3: 2.
4. Rafiey H, Narenjiha H, Shirinbayan P, Noori R, Javadipour M, Roshanpajouh M, et al. Needle and syringe sharing among Iranian drug injectors. Harm Reduct J 2009; 6: 21.
5. Razzaghi EM, Rahimia Movaghar A, Craig Green T, Khoshnood K. Profiles of risk: a qualitative study of injecting drug users in Tehran, Iran. Harm
Reduct J 2006; 3: 12.
6. World Health Organization. Effectiveness of Interventions to Manage HIV in Prisons Needle and syringe programmes and bleach and decontamination strategies. Geneva, Switzerland: World Health Organization; 2007.
7. Jürgens R, Ball A, Verster A. Interventions to reduce HIV transmission related to injecting drug use in prison. The Lancet Infectious Diseases 2009; 9(1): 57-66.
8. Stöver H, Ilja Michels I. Drug use and opioid substitution treatment for prisoners. Harm Reduction Journal 2010; 7: 17.
9. Kerr T, Jurgens R. Methadone maintenance therapy in prisons: reviewing the evidence [Online]. [cited 2004]; Available from: URL:
http://www.ohsutp.ca/uploads/Methadone_in_priso ns_-Legal_network.pdf
10.Simooya OO. Infections in prison in low and middle income countries: prevalence and prevention strategies. The Open Infectious Diseases
Journal 2010; 4: 33-7.
11.Chen Q, Wang S. Variable selection for multiply-imputed data with application to dioxin exposure study. New Jersey, NJ: John Wiley & Sons; 2011. 12.Ziegler ML. Variable Selection when Confronted
with Missing Data. Pittsburgh, PA: University of Pittsburgh; 2006.
13.Marlin BM. Missing data problems in machine learning. Ontario, CA: Library and Archives Canada; 2008.
14.Donders AR, van der Heijden GJ, Stijnen T, Moons KG. Review: a gentle introduction to imputation of missing values. J Clin Epidemiol 2006; 59(10): 1087-91.
15.Barzi F, Woodward M. Imputations of missing values in practice: results from imputations of serum cholesterol in 28 cohort studies. American Journal of Epidemiology 2004; 160(1): 34-45. 16.Zhang X. A study of methods for missing data
problems in epidemiologic studies with historical exposures. Los Angeles, CA: University of Southern California; 2009.
17.Langkamp DL, Lehman A, Lemeshow S. Techniques for handling missing data in secondary analyses of large surveys. Acad Pediatr 2010; 10(3): 205-10.
18.He Y. Missing data analysis using multiple imputation: getting to the heart of the matter. Circ Cardiovasc Qual Outcomes 2010; 3(1): 98-105. 19.Baneshi MR, Talei AR. Does the missing data
imputation method affect the composition and performance of prognostic models? Iran Red Crescent Med J 2012; 14(1): 31-6.
20.Azur MJ, Stuart EA, Frangakis C, Leaf PJ. Multiple imputation by chained equations: what is it and how does it work? Int J Methods Psychiatr Res 2011; 20(1): 40-9.
21.White IR, Royston P, Wood AM. Multiple imputation using chained equations: Issues and guidance for practice. Stat Med 2011; 30(4): 377-99.
22.Wood AM, White IR, Royston P. How should variable selection be performed with multiply imputed data? Stat Med 2008; 27(17): 3227-46. 23.Peduzzi P, Concato J, Kemper E, Holford TR,
Feinstein AR. A simulation study of the number of events per variable in logistic regression analysis. J Clin Epidemiol 1996; 49(12): 1373-9.
24.Vittinghoff E, McCulloch CE. Relaxing the rule often events per variable in logistic and Cox regression. Am J Epidemiol 2007; 165(6): 710-8. 25.Daneshmand D, Nokhodian Z, Adibi P, Ataei B.
Risk Prison and Hepatitis B Virus Infection among Inmates with History of Drug Injection in Isfahan, Iran. The Scientific World Journal 2013; 2013: 4. 26.Mirahmadizadeh AR, Kadivar MR, Hemmati AR,
Javadi A. Infection with HIV and hepatitis C and B viruses among injecting drug users in Shiraz, Southern Iran. Proceedings of the 15th International Congress of AIDS; 2004 Jul 11-16; Bangkok, Thailand; 2004.
27.Cheng Y, Sherman SG, Srirat N, Vongchak T, Kawichai S, Jittiwutikarn J, et al. Risk factors associated with injection initiation among drug users in Northern Thailand. Harm Reduct J 2006; 3: 10. 28.Stark K, Bienzle U, Vonk R,
Guggenmoos-Holzmann I. History of syringe sharing in prison and risk of hepatitis B virus, hepatitis C virus, and human immunodeficiency virus infection among injecting drug users in Berlin. Int J Epidemiol 1997; 26(6): 1359-66.
29.Adoga MP, Banwat EB, Forbi JC, Nimzing L, Pam CR, Gyar SD, et al. Human immunonodeficiency virus, hepatitis B virus and hepatitis C virus: sero-prevalence, co-infection and risk factors among prison inmates in Nasarawa State, Nigeria. J Infect Dev Ctries 2009; 3(7): 539-47.
30.Holländer N, Schumacher M. Estimating the functional form of a continuous covariate's effect on survival time. Computational Statistics & Data Analysis 2006; 50(4): 1131-51.
31.Royston P, Altman DG. Regression using fractional polynomials of continuous covariates: parsimonious parametric modelling. Journal of the Royal Statistical Society 1994; 43(3): 429-67.
32.Royston P, Sauerbrei W. Building multivariable regression models with continuous covariates in clinical epidemiology--with an emphasis on fractional polynomials. Methods Inf Med 2005; 44(4): 561-71.
33.Royston P, Sauerbrei W. Multivariable Model - Building: A Pragmatic Approach to Regression Anaylsis based on Fractional Polynomials for Modelling Continuous Variables. New Jersey, NJ: John Wiley & Sons, 2008.
1 ! "#$ %& ' ( ) * HIV + " $ ,-+ .* $ ,-! / + 0 ' 12 " -. 2 ! "#$ ) * ' ( %& HIV + " $ ,-+ .* $ ,-! / + 0 ' 12 " -. 3 -! 5 6 5 78 9 ! / + " $ ,-+ .* $ ,-! / + 0 ' 12 " -. : :! #7 Email: [email protected]