Attentional priority determines working memory precision
Zuzanna Klyszejko
a, Masih Rahmati
a, Clayton E. Curtis
a,b,⇑a
Department of Psychology, New York University, United States b
Center for Neural Science, New York University, United States
a r t i c l e
i n f o
Article history:Received 25 June 2014
Received in revised form 4 September 2014 Available online 18 September 2014 Keywords:
Visual working memory Attention
Psychophysics Capacity
a b s t r a c t
Visual working memory is a system used to hold information actively in mind for a limited time. The number of items and the precision with which we can store information has limits that define its capac-ity. How much control do we have over the precision with which we store information when faced with these severe capacity limitations? Here, we tested the hypothesis that rank-ordered attentional priority determines the precision of multiple working memory representations. We conducted two psychophys-ical experiments that manipulated the priority of multiple items in a two-alternative forced choice task (2AFC) with distance discrimination. In Experiment 1, we varied the probabilities with which memorized items were likely to be tested. To generalize the effects of priority beyond simple cueing, in Experiment 2, we manipulated priority by varying monetary incentives contingent upon successful memory for items tested. Moreover, we illustrate our hypothesis using a simple model that distributed attentional resources across items with rank-ordered priorities. Indeed, we found evidence in both experiments that priority affects the precision of working memory in a monotonic fashion. Our results demonstrate that representations of priority may provide a mechanism by which resources can be allocated to increase the precision with which we encode and briefly store information.
Ó2014 Elsevier Ltd. All rights reserved.
1. Introduction
Our ability to accurately remember what we have just seen is surprisingly vulnerable to massive failures (Rensink, 2000). Even using simple stimuli, we can only reliably remember three to four items after a very short intervening delay (Luck & Vogel, 2013), and using more complex stimuli, capacity shrinks even further. The amount of visual information or details places limits on the capac-ity of visual working memory (Alvarez & Cavanagh, 2004; Fougnie, Asplund, & Marois, 2010). Moreover, the precision of working memory representations declines as the number of items that are currently being maintained increases (Anderson, Vogel, & Awh, 2011; Bays & Husain, 2008; Wilken & Ma, 2004). Less precise encoding or noisy sustained representations may underlie the loss of precision that accompanies near capacity loads (Anderson, Vogel, & Awh, 2011; Bays & Husain, 2008; Wilken & Ma, 2004). Overall, there appears to be a tradeoff between the quality of an internal representation and the amount of information repre-sented. Although the dominant models of visual working memory capacity differ on how they propose that short-term memory
resources are distributed, they share the notion that precision is sacrificed as capacity limits are approached (Bays & Husain, 2008; Zhang & Luck, 2008).
The precision of visual working memory may depend on how we distribute our attentional resources. Endogenous attention can indeed be flexibly controlled depending on task goals (Sperling & Melchner, 1978). For example, changes in the validity of an endogenous cue cause equivalent changes in visual discrim-inability and speed of information accrual at the cued location (Giordano, McElree, & Carrasco, 2009). Therefore, how we allocate attentional resources may represent a shared mechanism that drives the variability observed in visual working memory precision (Melcher & Piazza, 2011) and the variability in more basic visual acuity (Herwig, Beisert, & Schneider, 2010).
Previous working memory studies have shown that spatial cues that predict which single item from an array of items is likely to be later tested increases the likelihood that the cued item will be cor-rectly recalled (Bays & Husain, 2008; Gorgoraptis et al., 2011; Zhang & Luck, 2008). Allocating more resource to the cued item, which is prioritized, is thought to result in a representation with greater precision. However, we need to make an important distinc-tion between the use of the word priority and the theory of priority maps. The previous studies suggest that an item can be given pri-ority, which may be akin to shifting a ‘‘spotlight’’ of attention to http://dx.doi.org/10.1016/j.visres.2014.09.002
0042-6989/Ó2014 Elsevier Ltd. All rights reserved.
⇑Corresponding author at: 6 Washington Place, New York, NY 10003, United States.
E-mail address:[email protected](C.E. Curtis).
Contents lists available atScienceDirect
Vision Research
that item. However, priority map theory posits that bottom-up salient visual properties combine with top-down goals to form an integrated map of a continuous rank-ordered representation of all stimuli in the visual field (Bisley & Goldberg, 2010; Itti & Koch, 2001; Serences & Yantis, 2006; Thompson & Bichot, 2005). Based on this theory, we predict that working memory precision will be proportional to the rank-ordered priorities of items and not just the single most prioritized item. This distinction has important theoretical implications for how we model the effects of priority on working memory.
Here, we ask how we control the precision with which we store information when faced with severe capacity limitations. How does prior knowledge or task demands help prioritize the precision with which we encode and store information? We test the hypoth-esis that prioritizing a set of items results in rank-ordered preci-sions in the quality of the working memory representations. We conducted two psychophysical working memory experiments that manipulated the attentional priority of items (Fig. 1). In Experi-ment 1, we varied priority by varying the probabilities with which memorized items were likely to be tested. Previous studies have only used cueing to give an item special status. We aimed to extend the effects of priority beyond simple cueing. In Experiment 2, we varied priority by varying monetary incentives contingent upon successful memory for items tested. In both experiments, despite differences in experimental manipulation, working mem-ory precision tracked the priority of the multiple items.
2. Materials and methods
We conducted two psychophysical experiments that manipu-lated priority in two different ways. Both experiments were
designed to test how changes in attentional priority affect the pre-cision of working memory representations (Fig. 1). We formalized our hypotheses using a simple signal detection model that limits the precision of working memory representations as a function of priority. We use the output of this model to make predictions about our empirical data. In Experiment 1, we varied the learned
probability with which an item in working memory would later be tested. In Experiment 2, we varied the monetaryincentives asso-ciated with correctly remembering different items in working memory.
2.1. Model simulation
We hypothesize that priority has a direct influence on the pre-cision of the working memory representation of the target’s loca-tion. We formalize this hypothesis with a simple signal detection model of task performance that assumes two independent vari-ables, the actual location of the target, L1, and the difference between the target and the probe,D(see Figs.1and2A). The loca-tion of the probe is simply calculated as L2=L1+D. Target and probe locations,s1ands2respectively, were drawn from noisy dis-tributions of the actual locations to simulate internal neural repre-sentations of these locations. Thus, we generated s1 and s2 by drawing samples from a normal distribution centered at L1 and
L2, respectively. Importantly, we set the variance around the target location to be equal to 1 minus the priority of that target, as instructed in the experiment. For example, the variance of the Gaussian distribution for a low priority target (i.e., cue probability of 0.25; incentive value of $0.25) was set to 0.75. For a high priority target (i.e., cue probability of 1.0; incentive value of $1) the vari-ance was set to 0.1, to avoid 0. We also assumed a lower varivari-ance
+ + + + + + + Correct Incorrect Timeout Ready 200ms Cued Location 1 200ms Cued Location 2 200ms Cued Location 3 200ms Cued Location 4 200ms Retention Delay 500-1500ms
Probe & Response 1200ms Feedback 500ms ITI 1000ms 1.0 0.75 0.25 0.0 $1.0 $0.75 $0.25 $0.0 Probability Incentive Exp. 1 Exp. 2 Priority Cue
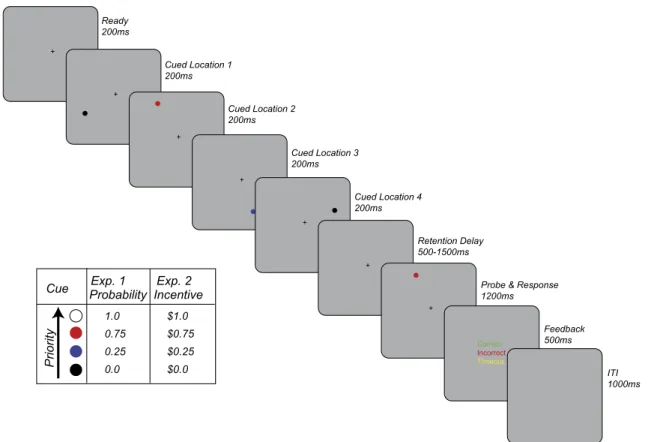
Fig. 1.Schematic of working memory tasks. In both Experiments 1 and 2, participants encoded the locations of four sequentially and randomly presented dot locations. After a retention interval during which the items were maintained in working memory, the memory for one of the locations was tested. A probe dot was presented near one of the cued locations and participants decided whether the probe was displaced to the left or right of the cued location. Feedback was given. The table inset details how dot color was used to cue the priority of the item in Experiments 1 and 2. In Experiment 1, the color indicated the probability with which the dot’s location would be later probed. In Experiment 2, the color indicated the monetary reward if that item was tested and correctly answered.
of 0.1 for the probe’s location since its representation does not depend on memory given that it is visible at the time of the deci-sion. The differences between s1 and s2 were used to generate response decisions. For each condition, we sampled from the model 1000 times for each of the 41 bins acrossDfrom 2°to 2°. In line with our hypothesis, we assumed that the precision with which the location is encoded (and/or maintained) is directly pro-portional to the variance of the Gaussian distribution from which
s1 and s2 were sampled. Since the variance is proportional to the slope of the psychometric function, the slope is a measure of the precision of the working memory representation. Note that the model is a simplified one of the full task structure. It does not model the priorities of all four cued locations, and only models the probed locations. This simplification reduces the calculations while it still allows us to make specific predictions based on our hypothesis.
2.2. Experiment 1 2.2.1. Participants
We recruited 9 participants (six females) ranging in age from 24 to 44 years with normal or corrected to normal vision that were neurologically healthy. All participants gave informed consent in accord with the Human Subjects Institutional Review Board at the New York University, and were remunerated for their time at rate $10 per hour. One participant was excluded from the analysis due to technical problems with eye movement recording.
2.2.2. Apparatus
We presented stimuli on a gray background in a dimly lit room on 20-in. screen with refresh rate 75 Hz (Samsung 205BW). Partic-ipants sat 70 cm from the screen with their head in a chin rest while we recorded their eye movements at a frequency of 1000 Hz (EyeLink 1000, SR Research, Mississauga, ONT) and responded using two keys. The procedures were programmed in
MATLAB (The Math Works, Natick, MA) using the MGL toolbox (http://gru.brain.riken.jp/mgl).
2.2.3. Working memory task – probability manipulation
We first briefly presented four colored dots, and then after a short retention interval, we tested the subject’s memory for the precise location of one of the dots (Fig. 1). The colors of the dots indicated the probability with which a dot’s location would later be tested and was our manipulation of priority. White, red, blue and black circles (0.2°diameter; RGB color space) were associated with 1, 0.75, 0.25 and 0 probability, respectively. On each trial, a red cue [0.75] was always accompanied by a blue [0.25] and two black [0] ones, or a white cue [1] was accompanied by three black [0] ones. In both cases the probabilities sum to one. The locations of black dots were never tested, since they were associated with a zero probability. Each of the four dots appeared in separate quadrants at an average of 9°radius (±1°jitter) from central fixation. Cardinal locations (20° from the horizontal and vertical axes) were excluded to reduce the chance that the locations would be converted into verbal representations (e.g., ‘‘left’’).
Each trial commenced with a 200 ms fixation cross that alerted the participant of a new trial. Then, four colored dots were each briefly presented for 200 ms in sequence. They were presented in a random sequence to reduce the chance that a gestalt shape would be used to represent the locations of the dots (Jiang, Olson, & Chun, 2000). The dots were followed by a variable 500– 1500 ms retention interval during which participants were asked to maintain in working memory the dot locations while taking into account the relative probability of the cues being probed. Four dots were chosen as this number is right at the typical border of capac-ity limits in visual working memory (Luck & Vogel, 1997). We rea-soned that a load near capacity limits would motivate the participant to allocate their attentional resources necessary to pre-cisely encode and maintain the locations in a manner that matched 7
5 3
1
Horizontal Distance (deg) + L1 L2 Δ L1 8 6 4 2 + L1 L2 Δ σ =0.75 L1 L2 Δ σ =0.1 σ =0.252 2 2 0.75 0.25 7 5 3 1
Horizontal Distance (deg)
8 6 4 2 Probability Probability
(B)
s1 −2 −1 0 1 2 0.0 0.2 0.4 0.6 0.8 1.0 1.00 0.75 0.25 0.00 0.00 0.25 0.75 1.00 1 2 3 4 Priority Slope PriorityTarget-to-Probe Distance Δ (deg)
Probability of Rightward Response
(C)
L2 Δ σ 2=0.1 s2 s1 s2(A)
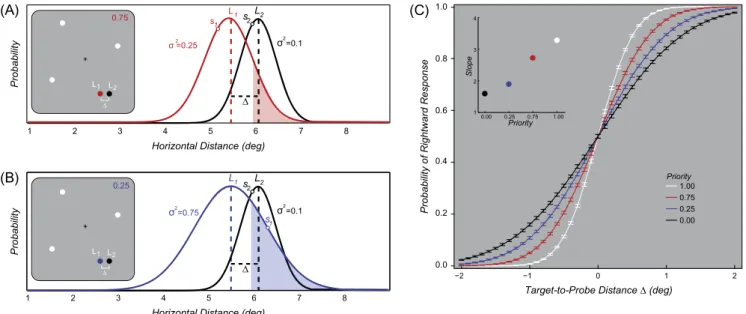
Fig. 2.Model of how priority affects working memory precision. (A) Example where a target item (red dot,L1) has a priority of 0.75, and must be compared to the probe’s location (L2; note that for illustration purpose the probe is black, but in the experiment is was the same color as the target). The model assumes that the internal representation of the target location is a Gaussian probability distribution whose variance (r2
) is a function of the item’s priority. Performance is determined by comparing a sample from the target’s internal representation (s1) and a sample from the probe’s internal representation (s2) to decide whether the probe is to the left or right of the target. (B) For comparison, consider a trial in which the target (blue dot) has a lower priority of 0.25. Assuming the location ofs2, anys1in the shaded area would result in an error. Notice how the probability of making an error is a function of the variance, which is directly related to precision. (C) Model data showing the mean (±SD) probability of a rightward response given that the probe was to the right of the target, separately for each priority. The inset plots the slopes of the cumulative Gaussian functions.
the probability with which the locations would be tested. To test working memory precision, we used a two alternative forced choice (2AFC) procedure. After the delay, participants indicated with a button press whether a probe dot was located to the left or right of one of the cued locations. The locations probed veridi-cally matched the probability structure of the color cues associated with the dots. Participants had 1200 ms to respond. After this time, feedback was given (i.e., ‘‘Correct’’, ‘‘Incorrect’’ or ‘‘Timeout’’ if the response was not recorded within the deadline) followed by a 1000 ms long inter-trial interval (ITI).
Participants were instructed to keep their gaze on the fixation point. Compliance was monitored with an eye tracker and trials in which participants broke fixation during the trial were excluded. Three independent staircases (3-up 1-down) controlled the dis-tance between the target and probed locations and were designed to bring participants’ performance to79% correct responses sep-arately for non-zero probability cues, that is white (1), red (0.75) and blue (0.25). Participants were informed that the distance between targets and the probe might vary depending on their per-formance, but were encouraged to respond as quickly as possible while maintaining the best possible performance. Before the experiment, participants took part in a training session during which they learned the associations between the colors cues and probabilities. After training, participants completed 600 trials in two separate sessions held at maximum 1 week apart. Each session was approximately 1 h long.
2.2.4. Analysis
Before performing the main analysis, we removed trials with missing responses and those with reaction times below 100 ms. Next, for each probability condition, we measured the proportion of trials of which the observer reported that the probe was to the right of the cue as a function of the distance between the cue and the probe. The exact bins were chosen to maximize the num-ber of observation in each bin across the range of target-to-probe distances. Because of the separate staircases, this resulted in differ-ent bins across the differdiffer-ent conditions. Next, for each individual participant, we fit logistic psychometric functions to the response data using maximum likelihood estimation to recover the thresh-old (a) and slope (b) parameters (Wichmann & Hill, 2001). We used bootstrapping procedures to estimate the standard errors (SE) associated with these estimated parameters (Prins & Kingdom, 2009). To do so, we first generated simulated performance data for across the target-to-probe distance bins based on the logistic functions derived from the experiments. Then, we refit logistic functions to the simulated data to obtain sampling distributions of the parameters. We repeated this procedure 1000 times to cre-ate a distribution from which we derived the SE of estimcre-ate. We then used the group averages of these parameters estimated from individual participant data to derive the logistic functions and slope parameters inFig. 3. Here, we focus on the slope and not threshold parameters as our index of working memory precision similar to past investigations (Bays & Husain, 2008). The slope parameter of the psychometric function is a dynamic index of the rate with which performance changes as a function of target-to-probe distance. As the slope increases, performance improves faster across increasing target-to-probe distances. This means that larger slopes indicate greater working memory precision. To assess whether the slope value increases monotonically with cue proba-bility we fit a first order polynomial using least squares regression to mean slope values for each condition and each observer. Signif-icance was based on a randomization test where we generated a null distribution of responses to which we compared our experi-mental results. For each observer, we randomly shuffled the labels (e.g., 1.0, 0.75, 0.25) of the cue probabilities that were probed and recomputed the linear fit to the slope parameters. We repeated this
procedure 1000 times to generate the permuted null distribution for hypothesis testing.
2.3. Experiment 2 2.3.1. Participants
In the second study, we studied six participants (three females) ranging in age from 24 to 44 years of age with normal or corrected to normal vision that were neurologically healthy. All participants gave informed consent in accord with the Human Subjects Institu-tional Review Board at the New York University, and were remu-nerated for their time at rate $10 per hour plus a bonus based on their performance (see details below).
2.3.2. Apparatus
We used the same hardware, eye tracking, and software as in Experiment 1.
2.3.3. Working memory task – incentive manipulation
As in the first experiment, after a short retention interval, we tested the precise location of one of several briefly presented col-ored dots (Fig. 1). However, in the second experiment the colors indicated the monetary incentive associated with correctly remembering an item. Overall, the experiment was very similar in structure to the cue probability experiment in Experiment 1. The stimuli were identical physically. Participants underwent extensive practice. An eye tracker was used to ensure fixation com-pliance. Participants were given the same instructions as those in Experiment 1, except for the interpretation of cue colors. The dot colors were now associated with monetary rewards (white = $1, red = $0.75, blue = $0.25 and black = $0) contingent upon correct performance. On each correct trial, participants gained the dollar amounts associated with the target’s cued value. On incorrect tri-als, they received no amount. Each dot, regardless of its value, had an equal probability of being tested. In Experiment 2, we better sampled the full range of target-to-probe distances including large and small values to better cover the ends and middle of the psy-chometric curves. For each block of trials, we began with target-to-probe distances initialized to either 2.2°or 0.1°. We again used independent staircases (3-up, 1-down) that ensured an overall accuracy of79% correct within each value condition. Participants were encouraged to allocate their attentional resources in a man-ner that maximized their economic gain. Feedback regarding whether the response was ‘‘Correct,’’ ‘‘Incorrect,’’ or ‘‘Timeout’’ was given after each trial, and at the end of blocks of 50 trials, the total amount of won dollars for that block was displayed to the participant. After the experiment (400–500 total trials), we randomly chose one of the blocks as a bonus to be paid to the par-ticipant. Since the performance level was held approximately con-stant with the staircase procedures, the average bonus across participants was always just over $20 and averaged $24.
2.3.4. Analysis
For each incentive condition, we measured the proportion of tri-als in which the observer reported a probe on the right side of the target as a function of the distance between the target and the probe. Our procedures for measuring the effect of the target cue’s incentive on working memory precision were identical to Experi-ment 1.
3. Results
First, we illustrated our hypothesis that priority affects the pre-cision of working memory representations by predicting task per-formance based on a signal detection model. Then, we conducted
two psychophysical experiments that were designed to test how changes in attentional priority affect the precision of working memory representations. In both experiments, the precision of working memory representations was greater for items with higher priority, in accord with the predictions from our simulation. Attentional priority had clear effects on working memory precision both when priority was manipulated by changes in probability and incentive.
3.1. Model simulation
We modeled working memory representations as probability distributions centered on the target’s location. The variance of the distribution controlled the precision of the representation. Pri-ority was proportional to precision, where items associated with greater importance were encoded/maintained with greater fidelity (Fig. 2A and B, for detailed description of the model see Section2.1). The model simulations produced choice behavior that we used to make specific predictions about the empirical results from our two psychophysical studies. The model predicted that performance accuracy would increase in each condition as the target-to-probe distance increased. As modeled, priority affected the slope of the fitted responses (Fig. 2C). Slope steepness increased as priority increased. Since the variance is proportional to the slope of the psychometric function, the slope is a measure of the precision of the working memory representation. A smaller variance is equiva-lent to a steeper psychometric function, which indicates a more precise memory for the location.
3.2. Experiment 1
We varied theprobabilitywith which an item in working mem-ory would later be tested as a manipulation of priority. Overall, participants performed the task well based on simple descriptive statistics of their choice behavior (Table 1). Our main hypothesis, however, depends on measuring the precision with which items
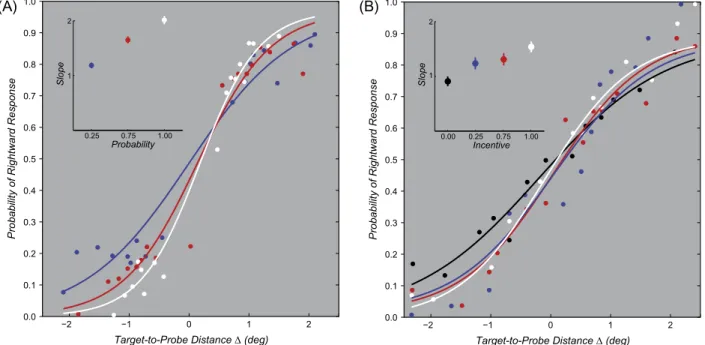
are represented in working memory. To this end, we first fit logistic functions to the response data for each individual participant sep-arately for each cue probability. We use the slopes of these func-tions as our measure of precision. Larger slopes are proportional to greater working memory precision. As illustrated inFig. 3A, in each condition performance improved as the distance between tar-get and probe locations increased. Importantly, the fitted psycho-metric functions differed in their slope estimates (Fig. 3A, inset). The precision of probed items increased linearly as a function of the probability that an item would be later tested. The slope of this linear function was significant based on a randomization test (p< 0.001; none of the 1000 randomizations yielded a slope greater than the actual slope).
One caveat with Experiment 1 stems from the fact that the probabilities associated with the presented items during each trial summed to 1. This introduced differences in working memory load between experimental conditions. For instance, when a stimulus was associated with a 100% probability of being tested, observers could ignore the other three dots possibly resulting in an effective load of one. On other trials, when the probabilities were 25% and 75%, the load was effectively two. Therefore, better performance on 100% probability trials could be due to a lower load. However, load cannot explain the differences in performance between the 75% and 25% conditions, as these were matched for load. Another minor caveat stems from the fact that participants found the experiment challenging and had difficulty discriminating the direction of the displacement when the probe was less than a 1/2 of a degree from the target. The staircase procedure, which focuses on sampling around the threshold to optimize estimation of the psychometric function’s parameters, resulted in few obser-vations for very small target-to-probe distances where behavior is typically at chance levels. Although data well below 79% thresh-olds may have had less influence on the slope estimates than data around and above thresholds, it is highly unlikely that the relative slopes across conditions would possibly change if this small area had been better sampled. Nonetheless, we controlled for these
−2 −1 0 1 2 0.0 0.1 0.2 0.3 0.4 0.5 0.6 0.7 0.8 0.9 1.0 0.25 0.75 1.00 1 2 Probability Slope
Target-to-Probe Distance Δ (deg)
Probability of Rightward Response
−2 −1 0 1 2 0.0 0.1 0.2 0.3 0.4 0.5 0.6 0.7 0.8 0.9 1.0 0.00 0.75 1.00 1 2 Incentive Slope
Target-to-Probe Distance Δ (deg)
Probability of Rightward Response
0.25
(A)
(B)
Fig. 3.Performance on the working memory tasks. (A) Experiment 1. The probability that a displacement to the right would be judged rightward as a function of the actual target-to-probe distance (D). Psychometric curves for each of the cue probabilities of 1.0 (white), 0.75 (red), and 0.25 (blue) are estimated from logistic functions constructed by averaging each participant’s slope and threshold parameters. Each dot represents the mean probability of a rightward response across participants at bins of the difference in the target-to-probe distance. The inset plots the mean slopes (±1 SE) of these functions. (B) Experiment 2. Same as in 2A, however, the curves are fit to the separate reward incentives of $1 (white), $0.75 (red), $0.25 (blue), and $0 (black). In both experiments, the slopes of the functions increase with increasing priority indicating that precision increases as a function of the priority of items in the display.
potential problems in a second experiment where we improved our staircase procedures and kept the working memory load con-stant, but still manipulated the priority of multiple items.
3.3. Experiment 2
In Experiment 2, we varied the monetaryincentiveassociated with correctly remembering an item in working memory as a manipulation of priority. Similar to Experiment 1, participants per-formed the task well based on simple descriptive statistics of their choice behavior (Table 1). Again following the same procedures, we use the slopes of fitted logistic functions as a measure of the preci-sion with which items are represented in working memory. As depicted inFig. 3B, performance improved as the distance between the target and probe locations increased for each condition. As in Experiment 1, we find that the slopes of the fitted functions differ across the conditions (Fig. 3B, inset), even though the memory load remained constant. The precision of the probed items increased linearly as a function of the reward values associated with those items. Although the slope is not as steep as in Experiment 1, it was significant based on a randomization test (p< 0.003), and therefore replicates the finding.
4. Conclusions
The capacity of visual working memory is severely limited (Ma, Husain, & Bays, 2014). In two psychophysical experiments, we tested the hypothesis that prioritizing a subset of items determines the precision of their representation in working memory. We manipulated priority in different ways in each study. In Experi-ment 1, we varied the probabilities with which memorized items were likely to be tested. In Experiment 2, we varied rewards con-tingent upon successful memory for items tested. Both experi-ments showed that priority determined working memory precision. We also formalized our hypothesis using a simple gener-ative computational model whose output matched our empirical data. Our results demonstrate that priority can affect the precision with which we store information and may be a means by which we offset the costs of this limited capacity system. In essence, we found that our observers were able to prioritize the precision with which they encoded and stored information about multiple items in a way that tracks the relative priorities of the array of items.
4.1. Relationship to previous studies
Few studies have directly investigated the influence of priority on the precision of visual working memory. Indeed, spatial cues
that predict which single item from an array of items is likely to be later tested increases the probability that the cued item will be correctly recalled (Bays & Husain, 2008; Maxcey-Richard & Hollingworth, 2013; Zhang & Luck, 2008). For instance, cueing that one item is more likely to be tested leads to a recall advantage for that item, and that advantage comes at a cost for other items (Gorgoraptis et al., 2011). These previous results are consistent with two possible alternatives. First, memory precision may scale with priority, as we advocate here. Alternatively, since the past studies contrasted only two items with differing priorities (e.g., high versus low probability of being tested), memory precision may simply be high for the most prioritized item and low for all other items regardless of their relative priority. Here, we demon-strate that variability in the priorities of multiple items affects memory precision in a matching fashion. As priority increases, so does memory precision.
Using monetary incentives,Zhang and Luck (2011)failed to find evidence that such incentives affected the precision of visual work-ing memory. In contrast, we observed differences in the fidelity of recall, which tracked the incentive associated with each item in the memory array. We argue that these differences may be due to dif-ferences in experimental procedures. Zhang and Luck (2011) rewarded correct performance in general to test if motivation could affect the precision or amount of information in working memory. We provided incentives associated with individual items in the memory array. In our experiment, to maximize gain one should allocate memory resources proportional to the money asso-ciated with each item. Our results support this strategy. Moreover, the reward schedules for each experiment were different. In our experiment, we explicitly asked observers to treat each trial inde-pendently, since their total earnings were based on a fixed number of randomly chosen trials. In Zhang and Luck’s experiment, observ-ers were able to track accumulating rewards during feedback after each trial. Therefore, the amount of incentive at stake on a given trial was a variable fraction of the total earnings, which may decrease motivation to respond accurately at the end of the block. Together, these studies indicate that we cannot memorize more items or items with greater precision by simply increasing our effort. In other words, we cannot at will increase the seemingly finite resources associated with capacity limits. However, our find-ings demonstrate that we can distribute these resources flexibly based on priors (e.g., cue probability) and goals (e.g., incentive) to best compensate for capacity limitations in working memory. Importantly, differences in priority across the visual field may be the means by which we sculpt the allocation of resources that sup-port memory. With that said, we do not believe such strategic allo-cation can completely overcome resource limitations, but is an
Table 1
Descriptive statistics for Experiment 1 and Experiment 2.
Priority 0 0.25 0.75 1 Cue probability Exp. 1 Accuracy Mean (SD) N/A 0.79 (0.40) 0.81 (0.38) 0.82 (0.39) Reaction time [ms] Mean (SD) N/A 669.9 (171.9) 617.8 (145.4) 599.3 (141.4) Target-to-Probe distance [°] Mean (SD) N/A 1.16 (0.42) 0.94 (0.32) 0.82 (0.21) Incentive Exp. 2 Accuracy Mean (SD) 0.67 (0.47) 0.69 (0.46) 0.67 (0.47) 0.69 (0.46) Reaction time [ms] Mean (SD) 712.9 (138.1) 733.1 (149.6) 725.0 (146.3) 666.1 (151.3) Target-to-Probe distance [°] Mean (SD) 0.96 (0.50) 0.91 (0.52) 0.83 (0.47) 0.76 (0.47)
important mechanism to best compensate for these limits in capacity.
4.2. Potential neural mechanisms
There have been several theoretical accounts of the mecha-nisms by which priority is represented in the brain (Bisley & Goldberg, 2010; Gottlieb, 2007; Ptak, 2012; Serences & Yantis, 2006; Thompson & Bichot, 2005). Recently, we defined spatial topographic maps in the frontal and parietal cortices of humans and showed that neural responses in these spatial maps tracked the priority of items defined by either the location of an item in working memory, the locus of attention, or the goal of a saccade plan (Jerde et al., 2012). The activity in prioritized maps of space may bias the precision with which visual information is encoded in the brain through its top-down influences over visual neurons whose receptive fields match the prioritized locations (Jerde & Curtis, 2013). Recently, Bays created a computational model in which populations of neurons tuned to features encoded in spiking activity represent working memory items (Bays, 2014). In this model, a simulated top-down signal increases drive in the neurons representing a prioritized item, which in turn mimics the tradeoff in memory precision. Therefore, a read-out of representations of priority may provide a mechanism by which resources can be dynamically and flexibly reallocated to increase the precision with which we encode and store information in working memory. The reallocation may be particularly important as capacity is taxed in a limited resource systems like working memory.
4.3. Summary conclusions
We measured visual working memory precision for multiple items associated with rank ordered priorities and found that preci-sion consistently increased monotonically with priority. Based on these results, we conclude that visual working memory resources may be flexibly allocated across multiple items. Follow-up studies should investigate how priority’s influence on precision changes as working memory load varies across capacity limits. This will allow one to characterize how dynamic the influence of priority is in response to the demands of reaching and surpassing working memory capacity.
Acknowledgment
The current work was supported by NIH R01 EY016407 and R03 MH097206 to CEC.
References
Alvarez, G. A., & Cavanagh, P. (2004). The capacity of visual short-term memory is set both by visual information load and by number of objects.Psychological Science, 15, 106–111.
Anderson, D. E., Vogel, E. K., & Awh, E. (2011). Precision in visual working memory reaches a stable plateau when individual item limits are exceeded.Journal of Neuroscience, 31, 1128–1138.
Bays, P. M. (2014). Noise in neural populations accounts for errors in working memory.Journal of Neuroscience, 34, 3632–3645.
Bays, P. M., & Husain, M. (2008). Dynamic shifts of limited working memory resources in human vision.Science, 321, 851–854.
Bisley, J. W., & Goldberg, M. E. (2010). Attention, intention, and priority in the parietal lobe.Annual Review of Neuroscience, 33, 1–21.
Fougnie, D., Asplund, C. L., & Marois, R. (2010). What are the units of storage in visual working memory?Journal of Vision, 10, 27.
Giordano, A. M., McElree, B., & Carrasco, M. (2009). On the automaticity and flexibility of covert attention: A speed-accuracy trade-off analysis.Journal of Vision, 9(3) (article 30).
Gorgoraptis, N., Catalao, R. F., Bays, P. M., & Husain, M. (2011). Dynamic updating of working memory resources for visual objects. Journal of Neuroscience, 31, 8502–8511.
Gottlieb, J. (2007). From thought to action: The parietal cortex as a bridge between perception, action, and cognition.Neuron, 53, 9–16.
Herwig, A., Beisert, M., & Schneider, W. X. (2010). On the spatial interaction of visual working memory and attention: Evidence for a global effect from memory-guided saccades.Journal of Vision, 10, 8.
Itti, L., & Koch, C. (2001). Computational modelling of visual attention.Nature Reviews Neuroscience, 2, 194–203.
Jerde, T. A., & Curtis, C. E. (2013). Maps of space in human frontoparietal cortex. Journal of Physiology – Paris, 107, 510–516.
Jerde, T. A., Merriam, E. P., Riggall, A. C., Hedges, J. H., & Curtis, C. E. (2012). Prioritized maps of space in human frontoparietal cortex. Journal of Neuroscience, 32, 17382–17390.
Jiang, Y., Olson, I. R., & Chun, M. M. (2000). Organization of visual short-term memory.Journal of Experimental Psychology. Learning, Memory, and Cognition, 26, 683–702.
Luck, S. J., & Vogel, E. K. (1997). The capacity of visual working memory for features and conjunctions.Nature, 390, 279–281.
Luck, S. J., & Vogel, E. K. (2013). Visual working memory capacity: From psychophysics and neurobiology to individual differences.Trends in Cognitive Sciences, 17, 391–400.
Ma, W. J., Husain, M., & Bays, P. M. (2014). Changing concepts of working memory. Nature Neuroscience, 17, 347–356.
Maxcey-Richard, A. M., & Hollingworth, A. (2013). The strategic retention of task-relevant objects in visual working memory.Journal of Experimental Psychology. Learning, Memory, and Cognition, 39, 760–772.
Melcher, D., & Piazza, M. (2011). The role of attentional priority and saliency in determining capacity limits in enumeration and visual working memory.PLoS ONE, 6, e29296.
Prins, N., & Kingdom, F.F.A. (2009). Palamedes: Matlab routines for analyzing psychophysical data.www.palamedestoolbox.org.
Ptak, R. (2012). The frontoparietal attention network of the human brain: Action, saliency, and a priority map of the environment.Neuroscientist, 18, 502–515. Rensink, R. A. (2000). Seeing, sensing, and scrutinizing. Vision Research, 40,
1469–1487.
Serences, J. T., & Yantis, S. (2006). Selective visual attention and perceptual coherence.Trends in Cognitive Sciences, 10, 38–45.
Sperling, G., & Melchner, M. J. (1978). The attention operating characteristic: Examples from visual search.Science, 202, 315–318.
Thompson, K. G., & Bichot, N. P. (2005). A visual salience map in the primate frontal eye field.Progress in Brain Research, 147, 251–262.
Wichmann, F. A., & Hill, N. J. (2001). The psychometric function: I. Fitting, sampling, and goodness of fit.Perception & Psychophysics, 63, 1293–1313.
Wilken, P., & Ma, W. J. (2004). A detection theory account of change detection. Journal of Vision, 4, 1120–1135.
Zhang, W., & Luck, S. J. (2008). Discrete fixed-resolution representations in visual working memory.Nature, 453, 233–235.
Zhang, W., & Luck, S. J. (2011). The number and quality of representations in working memory.Psychological Science, 22, 1434–1441.