RADIATION DAMAGE IN FERRITIC STEELS PRODUCED BY VARIOUS PROCESSING METHODS
A Dissertation by
EDA AYDOGAN
Submitted to the Office of Graduate and Professional Studies of Texas A&M University
in partial fulfillment of the requirements for the degree of DOCTOR OF PHILOSOPHY
Chair of Committee, Lin Shao
Committee Members, Ibrahim Karaman Haiyan Wang Karl T. Hartwig Head of Department, Ibrahim Karaman
August 2016
Major Subject: Materials Science and Engineering
ii ABSTRACT
Next generation fast spectrum reactors require structural materials that can tolerate higher temperature and radiation damage compared to the currently used metal alloys. It has been discovered that the ferritic steels having bcc structure have higher swelling and creep resistance than the fcc austenitic steels. However, once the ferritic steels reach the steady state swelling regime, they can end up with considerable swelling. Radiation damage resistance in metals is directly correlated with the microstructure. In terms of microstructure tailoring to reduce radiation damage, the density of sinks (dislocations, grain boundaries, phase boundaries, twin boundaries etc.) can be increased. In this research, engineering alloys were produced with increased sink densities by various processing methods in order to improve swelling resistance. Various alloys of EK-181, HT-9 and 14YWT were processed by high pressure torsion (HPT), high rate shock deformation and hydrostatic extrusion, respectively. The effects of the resultant microstructures on the irradiation response of the materials were investigated with special interest paid to the influence of grain boundaries, phase boundaries and dislocations on swelling. In this study, we reported that initial stable and homogenous microstructure is the key to determine swelling resistance. Homogenously distributed nano-sized oxide dispersoids act as sinks for defects and help to stabilize microstructures through pinning dislocations and grain boundaries. The stability of oxide dispersoids is determined by irradiation conditions and key parameters influencing dispersoids’ stability are identified. The study is important for development of accident tolerant components for fast reactors.
iii DEDICATION
To my husband, Gokhan Gungor To my mom, Inci Aydogan To my dad, Necati Aydogan
iv
ACKNOWLEDGEMENTS
Firstly, I would like to thank my advisors Dr. Lin Shao and Dr. Stuart A. Maloy for their invaluable advice, endless encouragement and financial support for this Ph.D. dissertation. I also thank other committee members, Dr. Karl Ted Hartwig, Dr. Haiyan Wang and Dr. Ibrahim Karaman for their guidance and suggestions throughout the course of entire research.
Thanks also go to my mentor at Los Alamos National Laboratory, Dr. O. Anderoglu for his guidance and endless support. A sincere “thank you” to Dr. F.A. Garner who was always helpful for the interpretation of the data with his constructive discussions. I would like to give my appreciation to Dr. G.R. Odette for his fruitful discussions on atom probe tomography studies. I am grateful to Dr. K.G. Field for his aid in high resolution transmission electron microscopy experiments at Oak Ridge National Laboratory. I also want to extend my gratitude to Dr. S.C. Vogel for providing the opportunity of using HIPPO instrument for neutron diffraction experiments.
I am also grateful to my teammates at Texas A&M University, T. Chen, J.G. Gigax, L. Price, D. Chen, X. Wang, W. Kinnison. I appreciate their help on continuous days-long overnight irradiations. I would like to give my special thanks to MST-8 family at Los Alamos National Laboratory for their helps, advice and support.
Finally, thanks to my mother and father for their encouragement and to my husband for his patience, support and love.
v
NOMENCLATURE
APT Atom probe tomography
BCC Body centered cubic
BF Bright field
BSE Back scattered electrons
CSLB Coincidence site lattice boundary
DBH Dispersed barrier hardening
DPA Displacements per atom
EBSD Electron back scatter diffraction ECAP Equal channel angular pressure
EDS Energy dispersive spectroscopy
EFTEM Energy filtered transmission electron microscopy
F/M Ferritic/martensitic
FCC Face centered cubic
FIB Focused ion beam
FWHM Full width at half maximum
GB Grain boundary
HAADF High annular angular dark field
HAB High angle boundary
HE Hot extrusion
vi
HPT High pressure torsion
HRTEM High resolution transmission electron microscopy
HVOF High velocity oxy-fuel
LAB Low angle boundary
LANL Los Alamos National Laboratory
NF Nanofeature
NFA Nanostructured ferritic alloy ODF Orientation distribution function
OIM Orientation imaging microscopy
OR Orientation relationship
ORNL Oak Ridge National Laboratory
PKA Primary knock-on atom
RAGB Random grain boundary
RED Radiation enhanced diffusion
REP Radiation enhanced precipitation
RID Radiation induced depletion
RIP Radiation induced precipitation
RIS Radiation induced segregation
RMS Root mean square
Rp Projected ion range
SE Secondary electrons
vii
SIA Self-interstitial atoms
SPD Severe plastic deformation
STEM Scanning transmission electron microscopy
TEM Transmission electron microscopy
TMS Tempered martensitic steel
UCSB University of California Santa Barbara
VAR Vacuum arc remelting
VIM Vacuum induction melting
viii TABLE OF CONTENTS Page ABSTRACT ...ii DEDICATION ... iii ACKNOWLEDGEMENTS ... iv NOMENCLATURE ... v
TABLE OF CONTENTS ... viii
LIST OF FIGURES ...xii
LIST OF TABLES ... xxi
1. INTRODUCTION AND LITERATURE REVIEW ... 1
1.1 Motivation ... 1
1.2 Radiation effects in materials ... 2
1.2.1 Radiation damage ... 2
1.2.1.1 Primary knock-on atom (PKA) displacement and displacement energies ... 4
1.2.2 Radiation effects on microstructure and mechanical properties ... 6
1.2.2.1 Radiation induced segregation (RIS) ... 8
1.2.2.2 Radiation induced precipitation (RIP) ... 10
1.2.2.3 Dislocation loops ... 11
1.2.2.4 Void swelling ... 13
1.2.2.5 Radiation hardening ... 15
1.3 Radiation resistance of materials: Effect of phase content, initial dislocation density, orientation and precipitate stability ... 17
1.4 Materials for nuclear applications and radiation resistance of ferritic steels . 24 1.5 Production methods of ferritic steels ... 26
1.5.1 Production methods of precursor slab ... 26
1.5.1.1 Casting by vacuum induction melting (VIM) and vacuum arc remelting (VAR) ... 26
1.5.1.2 Powder metallurgy methods: Mechanical alloying ... 27
1.5.2 Further processing methods ... 28
1.5.2.1 Tube production methods ... 28
ix
1.5.2.1.2 Pilger processing ... 28
1.5.2.1.3 Spray forming ... 29
1.5.2.2 Severe plastic deformation (SPD) ... 31
1.5.2.3 High rate shock loading ... 32
2. EXPERIMENTAL METHODS ... 34
2.1 Specimen materials ... 34
2.2 Heavy ion irradiations ... 35
2.3 Microstructure characterization ... 37
2.3.1 Scanning electron microcopy (SEM) ... 37
2.3.2 Neutron diffraction ... 38
2.3.3 X-ray diffraction (XRD) ... 40
2.3.4 Transmission electron microscopy (TEM) ... 40
2.3.5 Atom probe tomography (APT) ... 43
2.4 Mechanical property testing by hardness tests ... 44
3. EFFECTS OF HIGH DOSE IRRADIATION ON MICROSTRUCTURE DEVELOPMENT IN EK-181 ... 46
3.1 Overview ... 46
3.2 Introduction ... 46
3.3 Experimental procedure ... 48
3.4 Results and discussion ... 51
3.4.1 Swelling ... 52
3.4.1.1 Temperature dependent swelling... 52
3.4.1.2 Dose dependent swelling ... 54
3.4.1.3 Swelling comparison ... 58
3.4.2 Grain growth in severely deformed EK-181 ... 61
3.5 Conclusions ... 65
4. EFFECT OF SHOCK LOADING ON THE MICROSTRUCTURE, MECHANICAL PROPERTIES AND GRAIN BOUNDARY CHARACTERISTICS OF HT-9 FERRITIC/MARTENSITIC STEELS ... 67
4.1 Overview ... 67
4.2 Introduction ... 68
4.3 Experimental procedure ... 70
4.4 Results and discussion ... 72
4.4.1 Effect of shock loading on the microstructure and mechanical properties ... 72
4.4.1.1 Effect of shock loading on the microstructure ... 73
4.4.1.2 Effect of shock loading on the mechanical properties ... 81
4.4.2 Effect of shock loading on the substructure boundaries: EBSD study... ... 83
x
4.5 Conclusions ... 88
5. INVESTIGATION ON EFFECTS OF SHOCK LOADING ON THE IRRADIATION RESPONSE OF HT-9 STEEL ... 90
5.1 Overview ... 90
5.2 Introduction ... 91
5.3 Experimental procedure ... 93
5.4 Results ... 93
5.4.1 Effect of irradiation on the substructure boundaries ... 93
5.4.2 Effect of irradiation on microstructure ... 96
5.5 Discussion ... 99
5.6 Conclusions ... 104
6. EFFECT OF TUBE PROCESSING METHODS ON THE TEXTURE AND GRAIN BOUNDARY CHARACTERISTICS OF 14YWT NANOSTRUCTURED FERRITIC ALLOYS ... 106
6.1 Overview ... 106
6.2 Introduction ... 107
6.3 Experimental procedure ... 109
6.4 Results ... 113
6.4.1 Tube processing by Process I ... 113
6.4.2 Tube processing by Process II ... 118
6.5 Discussion ... 124
6.6 Conclusions ... 129
7. EFFECT OF TUBE PROCESSING METHODS ON MICROSTRUCTURE, MECHANICAL PROPERTIES AND IRRADIATION RESPONSE OF 14YWT NANOSTRUCTURED FERRITIC ALLOYS ... 130
7.1 Overview ... 130
7.2 Introduction ... 131
7.3 Experimental procedure ... 132
7.4 Results and discussion ... 134
7.4.1 Microstructural investigation and mechanical properties before irradiation ... 134
7.4.1.1 Microstructural investigation ... 134
7.4.1.2 Mechanical properties ... 146
7.4.2 Microstructural investigation and mechanical properties after irradiation ... 152
7.4.2.1 Microstructural investigation ... 152
7.4.2.2 Mechanical properties ... 156
xi
8. STABILITY OF NANOSIZED OXIDES IN FERRITE UNDER EXTREMELY
HIGH DOSE SELF ION IRRADIATIONS ... 162
8.1 Overview ... 162
8.2 Introduction ... 162
8.3 Experimental procedure ... 164
8.4 Results ... 167
8.4.1 Microstructure before irradiation ... 167
8.4.2 Microstructure after irradiation ... 176
8.5 Discussion: Stability of NFs under irradiation ... 186
8.6 Conclusions ... 191
9. SUMMARY AND CONCLUSIONS ... 192
xii
LIST OF FIGURES
Page Figure 1.1 Schematic illustration of ion-mater interaction [12] ... 3 Figure 1.2 Graphical representation of Kinchin-Pease model [13] ... 6 Figure 1.3 (a) Displacement cascade and generation of vacancies and
self-interstitial atoms (SIAs) (b-e) Annihilation of defects either by recombination or at sinks (f) Radiation-induced segregation (RIS) and radiation-induced precipitation (RIP) at sinks. Jv: flux of vacancies, Ji:
flux of SIAs, Jsolute: flux of solutes and Jsolvent: flux of solvents (g)
Growth of the bubbles at the grain boundaries under stress-driven
creep conditions [19] ... 8 Figure 1.4 RIS by (a) vacancy mechanism and (b) interstitial mechanism. The
length of the arrows represent the magnitude of the fluxes for A and B
atoms [21].. ... 9 Figure 1.5 Radiation-induced segregation of Ni, Si, P; depletion of Cr at the grain
boundary of a 300 series stainless steel neutron irradiated to several
dpa at ~300 °C [22] ... 10 Figure 1.6 Dislocation loop size and density with increasing irradiation dose up to
13 dpa at 300 °C in various austenitic steels [25] ... 12 Figure 1.7 TEM image showing dislocation loops and networks in HT-9 neutron
irradiated (a) at 28 dpa, 384 °C (along g=200) (b) at 443 °C and 155
dpa (along g=110) [26] ... 13 Figure 1.8 (a) Void formation in 304 austenitic stainless steel after neutron
irradiation at 500 °C up to 10 dpa [27]. (b) Volume change in 316 stainless steel rods irradiated at 533 °C to a fluence of 1.5 ×10²³/m2 in
the EBR-11 reactor [28] ... 14 Figure 1.9 Swelling vs. irradiation temperature curve in nickel for a neutron
fluence of 5x10²³ n/m2 [30] ... 15
Figure 1.10 Effect of neutron irradiation on stress-strain curves of (a) fcc structure
(austenitic steels) (b) bcc structure (ferritic steels) [17]... 16 Figure 1.11 (a) vacancy and (b) interstitial concentrations in an irradiated metal as
xiii
low defect production rates, respectively. Upper curves of the solid
and dashed lines represent higher dislocation density [17] ... 19 Figure 1.12 Micrographs illustrating the microstructures of (a) solution annealed
austenitic stainless steel irradiated to 36 dpa at 520 °C and (b) 20% cold worked stainless steel irradiated to 54 dpa at 550 °C in HFIR [55]
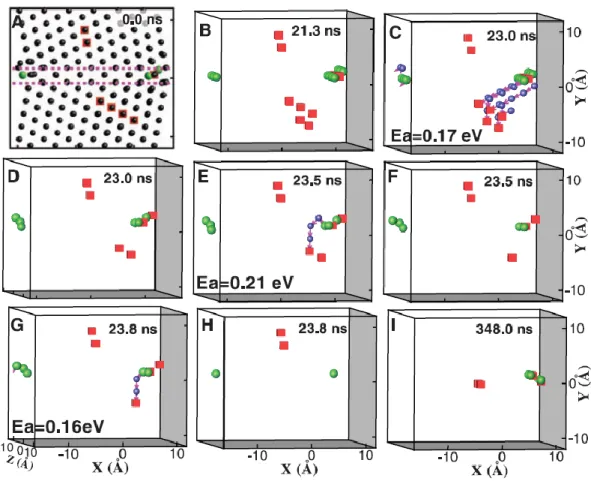
[55]... 20 Figure 1.13 Temperature accelerated dynamics simulations of damage self-healing
near the GB (within 10 Å of the GB). Smaller black spheres in A: nondefective atoms; larger green spheres: interstitials; red cubes: vacancies; smaller blue spheres: atoms that move more than 1 Å during an event; purple vectors: the moving directions and distances of
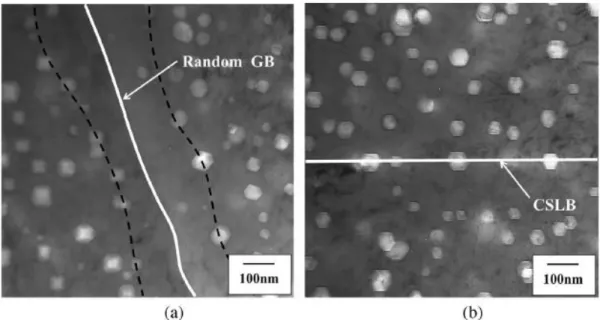
moving atoms [59] ... 21 Figure 1.14 Void distributions in the Fe–15Cr–15Ni steel neutron-irradiated at 749
K to 18 dpa near the (a) random GB (b) CSLB. The black dashed lines
represent the region of void denuded zone [63] ... 22 Figure 1.15 Under-focused bright field TEM images of the dual ion beam
irradiated cavity structures in (a) F82H and (b) MA957 irradiated to 42 dpa and 2100 appm He at 500 °C (at 1000 nm from the surface)
[64] ... 23 Figure 1.16 Schematic of irradiation effects in (a) nanostructured ferritic alloys
(NFAs) (b) 9Cr normalized and tempered martensitic steels (TMSs)
[19] ... 25 Figure 1.17 Typical mechanical alloying process for the production of ODS alloys
[72] ... 27 Figure 1.18 (a) A typical spray forming set up and principle [81] (b) tubular
preform produced by spray forming [83] ... 30 Figure 1.19 Schematic diagram of (a) HPT process; (b) shear geometry in HPT
process [89] ... 32 Figure 1.20 Micrographs showing the evolution of microstructure with increasing
shock loading pressures in Nickel and 304 stainless steel [95] ... 33 Figure 2.1 SRIM-calculated depth profiles of dpa and implanted atoms in pure Fe
xiv
Figure 2.2 Schematic view of the HIPPO diffractometer showing the structure of the instrument and arrangement of detectors panels. A person is used
for a scale. The distance between 10° and 150° panel is 3 m [104] ... 39 Figure 2.3 Schematic illustration of optics of transmission electron microscopy
[107] ... 41 Figure 2.4 Schematic of a typical loading-unloading curve during indentation
[113] ... 45 Figure 3.1 SEM images of (a) annealed EK-181 (b) HPT processed, severely
deformed EK-181, showing the non-homogenous distribution of carbides along the grain boundaries on both variants. Typical M23C6
type carbides in bright contrast along the grain boundaries are shown
by arrows. Note difference in scale of the two micrographs... 52 Figure 3.2 TEM micrographs of (a) annealed EK-181 samples and (b) severely
deformed EK-181 samples, irradiated to 100 peak dpa at 400 °C, 425 °C, 450 °C, 475 °C, 500 °C, and their corresponding summary plot of swelling as a function of dpa values. Arrows refer to the beam
bombardment direction.. ... 53 Figure 3.3 TEM images of annealed EK-181 samples irradiated to (a) 100 peak
dpa, (b) 200 peak dpa, (c) 300 peak dpa, and (d) 400 peak dpa at 475 °C; and (e) swelling vs. depth profiles. Arrows refer to the beam
bombardment direction... ... 55 Figure 3.4 Plots of (a) void size and (b) void density as a function of local dpa for
annealed EK-181. Measurements were performed at the depth region
between 400 to 700 nm.. ... 56 Figure 3.5 TEM micrographs of severely deformed EK-181 after irradiation to (a)
100 peak dpa, (b) 200 peak dpa, (c) 300 peak dpa, and (d) 400 peak dpa at 475 °C, and (e) corresponding depth profiles of swelling.
Arrows refer to the beam bombardment direction ... 57 Figure 3.6 Plots of (a) void size and (b) void density as a function of local dpa for
severely deformed EK-181. Measurements were performed at a depth
region between 400 to 700 nm ... 57 Figure 3.7 Swelling curves of (a) annealed and (b) severely deformed EK-181
xv
Figure 3.8 (a) Depth dependent swelling of annealed specimen after 400 peak dpa irradiation and (b) swelling of the same sample as a function of its
local dpa values ... 61 Figure 3.9 TEM micrographs showing extensive grain growth in the irradiated
regions (a) for 100 peak dpa irradiation at different temperatures, and (b) for different dose levels at 475 °C. Arrows refer to the beam
bombardment direction ... 62 Figure 3.10 (a) Temperature dependence of mean grain size at 100 peak dpa (b)
dose dependence of mean grain size at 475 °C in irradiated and
unirradiated regions of severely deformed EK-181 samples ... 63 Figure 4.1 TEM bright field images of the (a) as-received sample (b) shocked
loaded sample with the peak pressure of 11 GPa at room temperature ... 73 Figure 4.2 TEM bright field images of (a) as-received (b) as-shocked conditions
along (110) direction showing the structure of dislocations ... 74 Figure 4.3 TEM bright field image of the as-shocked sample showing the
dislocation structure and dislocation loops (red dashed circles) on
g=(110) ... 75 Figure 4.4 TEM bright field images of shock loaded HT-9 sample showing (a&b)
the destruction of continuous parallel lath structure at different locations and magnifications (c) the large aspect ratio as a result of
shock loading ... ... 76 Figure 4.5 The modified Williamson–Hall plots of the FWHM for (a) as-received
(b) as-shocked specimens. The Miller indices of the reflections are also
indicated ... 79 Figure 4.6 EBSD images of the as-received HT-9 steel showing the misorientation
angles of (a) 2°-15° (LAB), (b) 15°-50° (RGB) and (c) 50°-65° (special boundaries); as-shocked HT-9 steel showing the misorientation angles of (d) 2°-15° (LAB), (e) 15°-50° (RGB) and (f)
50°-65° (special boundaries) ... 84 Figure 4.7 Histogram of misorientation fraction inside single primary austenite
grains for the as-received and as-shocked HT-9 samples ... 85 Figure 4.8 Misorientation angles between the packets of (a) received (b)
xvi
Figure 5.1 EBSD images of the as-received HT-9 steel showing the misorientation angles of (a) 2°-15° (LAB), (b) 15°-50° (RGB) and (c) 50°-65° (special boundaries); as-shocked HT-9 steel showing the misorientation angles of (d) 2°-15° (LAB), (e) 15°-50° (RGB) and (f)
50°-65° (special boundaries) after irradiation to 600 dpa ... 94 Figure 5.2 Misorientation angle distribution of as-received and as-shocked
samples (a) before irradiation (b) after 600 dpa irradiation ... 95 Figure 5.3 Bright field STEM images of (a) as-received (b) as-shocked conditions
after 600 dpa irradiation along g=(110) direction ... 97 Figure 5.4 Stitched BFTEM images of (a) as-received (b) as-shocked samples
irradiated to 600 dpa. Images were taken at ~1 µm under-focus
condition ... 97 Figure 5.5 Swelling vs. depth profiles of the as-received and as-shocked HT-9
steels after 600 dpa irradiations. Swelling curves were superimposed
on the SRIM-calculated dpa and injected Fe ion profiles ... 98 Figure 5.6 HAADF images of (a) as-received (b) as-shocked samples after 600 dpa
irradiation. Arrows show the needle-like precipitate formation as a
result of irradiation ... 99 Figure 5.7 STEM EDS mapping of (a) as-received (b) as-shocked HT-9 samples
irradiated to 600 dpa ... 101 Figure 6.1 Processing steps of Process I ... ... 110 Figure 6.2 Processing steps of Process II (RD: rolling direction, TD: transverse
direction, ED: extrusion direction) ... 111 Figure 6.3 Photos showing the final dimensions of the tubes produced by (a)
Process I, and (b) Process II ... 111 Figure 6.4 An OIM showing (a) the crystallographic orientation of the grains; (b)
the corresponding band contrast gray scale map of the grain structure; (c) the grain area distribution as a function of the grain size; and, (d) the grain boundary misorientation angle distribution in 14YWT
samples produced by Process I ... ... 114 Figure 6.5 Pole figures of 14YWT samples produced by Process I and obtained by
(a) Neutron diffraction and (b) EBSD techniques. (ED: extrusion
xvii
Figure 6.6 Schematic illustration of the important texture components in bcc
materials (Reproduced from Ref [257]) ... 116 Figure 6.7 The neutron diffraction produced ODF, represented as sections in Euler
space, for the 14YWT tube produced by process I at φ2 values of 0°
and 45° ... ... 117 Figure 6.8 EBSD characterization of the intermediate tube alloy condition showing
(a) an orientation map of the crystallographic distribution of the grains; (b) a band contrast map of the grain structure in gray scale; (c) the grain area distribution as a function of size; and, (d) the grain boundary
misorientation angle distribution ... 119 Figure 6.9 Coordinate system of the intermediate tube transformed from the plate
form ... 119 Figure 6.10 Pole figures of intermediate 14YWT tube obtained by (a) Neutron
diffraction, and (b) EBSD techniques ... 120 Figure 6.11 ODF, represented as sections through Euler space, of the intermediate
14YWT tube at constant φ2 values of 0° and 45° ... 121 Figure 6.12 (a) Orientation map showing the crystallographic distribution of the
grains; (b) band contrast map showing the microstructure in gray scale; (c) grain size distribution plot; and, (d) grain boundary misorientation
angle distribution in 14YWT final tube produced by Process II ... ... 122 Figure 6.13 Pole figures of 14YWT final tube after hydrostatic extrusion obtained
by (a) Neutron diffraction, and (b) EBSD techniques ... 123 Figure 6.14 ODF, represented as sections through Euler space, of the 14YWT final
tube after hydrostatic extrusion at constant φ2 values of 0° and 45° ... 124 Figure 6.15 Neutron diffraction produced inverse pole figures of (a)
hydrostatically extruded final tube in Process I, (b) intermediate tube
in Process II and (c) hydrostatically extruded final tube in Process II ... 127 Figure 6.16 Grain boundary misorientation angle distribution of three different
tubes produced by Process I and II ... 128 Figure 7.1 Band contrast maps showing the grain distribution for 14YWT tubes
xviii
Figure 7.2 Bright field TEM images showing the second phase particle size and distribution in 14YWT tubes produced by (a) Process I and (b) Process
II ... 136 Figure 7.3 High-angle annular dark field (HAADF) scanning transmission electron
microscopy (STEM) image showing large, medium and small size particles in 14YWT tubes produced by (a) Process I and (b) Process II
... 137 Figure 7.4 SEM-EDS mapping of various elements in 14YWT tubes produced by
(a) Process I and (b) Process II. Large oxide particles are located at the
grain boundaries and elongated in extrusion direction ... 138 Figure 7.5 Composition analysis of 5 different dark rectangular particles having
size ranging between 10-250 nm in Process I tube ... 139 Figure 7.6 Composition analysis of ellipsoidal or polygonal dark particles having
sizes between 10 nm and up to 1 μm in Process I tube ... 140 Figure 7.7 Composition analysis of rectangular bright particles having a size
between 10-250 nm in Process I tube ... 141 Figure 7.8 Composition analysis of polygonal shaped bright particles having a size
ranging between 10 nm and up to 1 μm in Process I tube ... 141 Figure 7.9 Composition analysis of polygonal shaped dark particles having a size
ranging between 10-250 nm in Process II tube ... 142 Figure 7.10 Composition analysis of polygonal shaped bright particles having a
size ranging between 10-250 nm in Process II tube ... 143 Figure 7.11 EFTEM Ti and Fe elemental maps obtained from the tubes produced
by (a) Process I and (b) Process II ... 144 Figure 7.12 NF size (<10 nm) distribution of (a) Process I and (b) Process II alloys
... 145 Figure 7.13 TEM bright field images of (a) Process I and (b) Process II tubes along
g(110) direction showing the distribution of dislocations ... 149 Figure 7.14 Microstructures of (a) Process I tube after 500 and 900 dpa (b) Process
II tube after 500, 700, 900 and 1100 dpa irradiations with Fe2+ at 450
°C. Arrows indicate the direction of ion beam. Images were taken at 1
xix
Figure 7.15 BFTEM images of Process II tube after (a) 500 dpa (b) 700 dpa (c) 900 dpa and (d) 1100 dpa irradiations. Arrows indicate the direction
of ion beam. Images were taken at ~3 µm under focus condition ... 154 Figure 7.16 Swelling vs. depth profiles of the (a) Process I tube after 500 and 900
dpa (b) Process II tube after 500, 700, 900 and 1100 dpa irradiations
with Fe2+ at 450 °C. Note the difference in the scale of swelling (%) ... 156
Figure 7.17 Hardness as a function of penetration depth for (a) Process I tube after 500 and 900 dpa (b) Process II tube after 500, 700, 900 and 1100 dpa irradiations with Fe2+ at 450 °C. Shaded regions between 300-400 nm
depth shows the region of investigation ... 157 Figure 7.18 BF-STEM images showing dislocation loop distribution in two-beam
condition (g(110)) for (a) Process I tube irradiated up to 500 and 900 peak dpa doses (b) Process II tubes irradiated up to 500 and 1100 peak
dpa dose ... 159 Figure 8.1 SRIM-calculated depth profiles of damage and implanted Fe atoms for
1100 peak dpa irradiation in pure Fe ... 165 Figure 8.2 Distribution of particles before irradiation. (a) Low magnification BF
TEM image showing both larger particles together with NFs (b) high
magnification image showing the NF distribution ... 168 Figure 8.3 HRTEM images of (a) coherent small NF having the size ~1.5 nm (b)
semicoherent larger ~5 nm NF showing misfit Moiré fringes ... 168 Figure 8.4 HRTEM micrographs and their corresponding FFTs along [100]α in
particles having the OR of (a) (002) (044)Y Ti O2 2 7 and (b) 2 2 7
(002) (004)Y Ti O ... 169 Figure 8.5 (a) HRTEM micrograph of a region and its corresponding FFT diagram
along [110]α; HRTEM images and corresponding FFTs from (b)
region 1, (c) region 2, (d) region 3 as labelled in (a) ... 171 Figure 8.6 (a) HRTEM micrographs and corresponding FFT diagrams of (a)
Y2Ti2O7 particle having OR of (400) (200)Y Ti O2 2 7 and
2 2 7
[011] [011]Y Ti O ; (b) Y2Ti2O7 particle having OR of
2 2 7
(011) (222)Y Ti O and [011] [110]Y Ti O2 2 7; (c) Y2TiO5 particle
having OR of (002) (210)Y TiO2 5 and [110] [001]Y TiO2 5; (d) an
xx
Figure 8.7 APT 3D reconstruction of unirradiated 14YWT samples showing
distribution of various elements and ions ... 174 Figure 8.8 TEM images of samples collected from the depth region of 400 nm to
600 nm, after irradiation to (a) 270 dpa (b) 375 dpa (c) 480 dpa and (d)
585 dpa at 450 °C ... 177 Figure 8.9 HRTEM image showing the NF distribution along [110] zone axis of
the matrix after 480 dpa irradiation ... 179 Figure 8.10 HRTEM micrographs and their corresponding FFTs along [100]α in
particles (a) with unknown OR as it lacks extra diffraction spots in FFT diagram (b) having the OR of (002) (440)Y Ti O2 2 7,
2 2 7
(110) (400)Y Ti O along [001] [001]Y Ti O2 2 7 ... 180 Figure 8.11 (a) HRTEM micrographs and corresponding FFT diagrams of Y2Ti2O7
particles having OR of (a) (400) (200)Y Ti O2 2 7 and 2 2 7
[011] [011]Y Ti O ; (b) (011) (222)Y Ti O2 2 7 and 2 2 7
[011] [110]Y Ti O ... 181 Figure 8.12 APT 3D reconstructions showing the distribution of various elements
and ions in 14YWT samples irradiated to (a) 270 dpa (b) 480 dpa and
(c) 585 dpa at 450 °C ... 183 Figure 8.13 NF size distribution in unirradiated and various dose irradiated
samples obtained by (a) APT and (b) TEM analyses ... 184 Figure 8.14 Nr2 vs. T plot showing the behaviour of the dispersoids in the present
xxi
LIST OF TABLES
Page
Table 1.1 Irradiation induced defect evolution at different temperatures [18] ... 7
Table 2.1 Composition of supplied EK-181 samples (wt %) ... 34
Table 2.2 Composition of the HT-9 samples (wt %) ... 34
Table 2.3 Composition of the 14YWT samples (wt %) ... 35
Table 2.4 Summary of the processing methods of the materials ... 35
Table 4.1 The XRD data of each reflection of the as-received and as-shocked HT-9 steels ... 77
Table 4.2 Dislocation densities of the as-received and as-shocked HT-9 samples obtained by different methods ... 83
Table 4.3 CSL boundaries existing in the HT-9 as-received and as-shocked samples and corresponding misorientation angles ... 87
Table 4.4 CSL boundary fractions before and after shock loading ... 88
Table 5.1 CSL boundary fractions of as-received and as-shocked samples before and after irradiation ... 96
Table 5.2 Calculated sink strengths of G-phase, M2X, dislocations and boundaries together with total sink strength in as-received and as-shocked HT-9 samples ... 103
Table 6.1 Important fiber textures and orientations for bcc materials [257] ... 116
Table 7.1 Summary of measured grain and NF sizes, as well as volume fraction and number density in 14YWT tubes produced by different processes ... 145
Table 7.2 Microhardness and yield stress values of the 14YWT tubes ... 146
Table 7.3 Summary of direct, indirect, dislocation forest and matrix strengthening as well as a comparison between measured and calculated yield stresses by both linear superposition and RMS approaches... 152
Table 7.4 Summary of dislocation and void size and densities as well as hardening for the irradiated samples at various dose levels ... 160
xxii
Table 8.1 Compositions (at%) of the matrix and NFs in unirradiated condition as
determined by APT analyses ... 175 Table 8.2 Summary of NF size and density obtained from TEM and APT
characterizations ... 178 Table 8.3 Compositions (at%) of the matrix and NFs in irradiated 14YWT samples
at 450 °C up to 270, 480 and 585 local dpa doses at the depth of
1
1. INTRODUCTION AND LITERATURE REVIEW
1.1 Motivation
There is a worldwide need of nuclear energy due to the increase in the world’s population and the desire to reduce greenhouse gasses from burning of fossil fuels. Therefore, the fission and fusion reactors are important to meet the need for clean sources of energy [1]. However, nuclear energy systems operate under high temperatures and stresses, chemically corrosive environments, and high neutron fluxes which can produce displacement damage levels up to 400 displacements per atom (dpa) for the next generation reactors. Thus, the operation of nuclear energy systems under above stated hostile conditions requires the development of high performance structural materials [2-5].
In the United States, 316L austenitic stainless steel was initially chosen to be used for fast reactor structural components. However, because of extensive volume expansion as a result of extreme void swelling under irradiation, research shifted towards ferritic and later ferritic/martensitic steels for high dose fast reactor applications [6]. Today, the research on the ferritic/martensitic (F/M) steels is focused mainly on the 9–12Cr steels. While 12Cr F/M steels show high corrosion and void swelling resistance, 9Cr steels are more resistant to irradiation hardening at 350 °C [6]. Even though F/M steels have better corrosion and void swelling resistance compared to austenitic steels, their creep resistance above 600 °C is quite poor [7]. Therefore, in order to improve high-temperature strength,
2
stability, and creep resistance together with irradiation resistance, nanostructured ferritic alloys (NFAs) having nanoscale Y-Ti-O particles have been developed [8-10].
In this study, the effect of the initial processing methods on the irradiation response of conventional F/M steels together with NFAs has been investigated. A literature review on radiation effects in materials, nuclear materials and their radiation resistance as well as ferritic steel production methods is provided in the first chapter. The second chapter provides information about materials and experimental procedures. Results and discussion on the irradiation response of ferritic steels after various processing methods are given followed by experimental methods. In the last chapter, conclusive remarks are presented.
1.2 Radiation effects in materials 1.2.1 Radiation damage
Radiation damage occurs as a result of energy transfer from a projectile to a solid. First, an incident particle interacts with a lattice atom leading to a displacement of lattice atom from its original position if the transferred energy is higher than a critical value. The struck and displaced atom is credited as the primary knock-on atom (PKA) which can create additional knock-on atoms if its energy is high enough. Those secondary knock-on atoms are called recoils and generate a displacement cascade. When the energy of the atoms is not enough to create additional knock-on atoms, the damage event ends. The displacement cascade occurs in ~10-11 picoseconds and the displacement cascade created defects lead to mechanical and thermal property changes [11]. Fig. 1.1 summarizes the radiation damage in the materials.
3
Figure 1.1 Schematic illustration of ion-mater interaction [12].
The damage created in the material can be quantified as in the following damage rate equation: ( ) (E ) E d i D i i E R N E dE
(1.1) where N, (Ei), D(E )i are denoted as the lattice atom density, particle flux and displacement cross section which is the displacement probability, respectively [13].(E )
D i
can be given as:
( ) ( , ) ( ) T d i i T E E T T dT
(1.2) where ( E Ti, ) is the probability of transmission of recoil energy T from incident particle having energy Eito target lattice atom; ν(T) is the number of resultant displaced atoms4
[13]. Energy transfer cross section can be determined based on the energy and type of the ion, however, it is quite complex. Assuming the collisions are purely ballistic and ignoring the Coulombic and electronic interactions, the energy transferred, T, can be defined as in the following equation:
2 1 2 2 1 2 4 sin ( ) 2 c E m m T m m (1.3) where E is the incident particle’s energy, m1 and m2 are mass of the incident and the target
atom, respectively. θc is defined as the deflection angle of the target particle in the center
of mass coordinate and it is given as:
min 2 1/ 2 2 2 2 ( ) 1 c r C b dr V r b r E r
(1.4) where b is the collision parameter, rmin is the closest distance between the two particlesandV r( )is the interatomic potential. Ec is the kinetic energy of the system in center of
mass coordinate.
1.2.1.1 Primary knock-on atom (PKA) displacements and displacement energies
In order to calculate the average number of atom displacements in the target lattice during collisions, Kinchin and Pease developed a model [14]. The Kinchin-Pease model ignores the periodicity in the metals and assumes the hard sphere approximation where all the collisions are elastic. As mentioned in the previous section, it is assumed that the incident atom having energy Ei, transfers its energy T to the initial PKA. The displacement
5
its original lattice position. If T > Ed, the target atom is moved from its original lattice
position and turns into a PKA; however, if T < Ed, it keeps its original position. If the
transferred energy is between Ed < T < 2Ed, the collision process can move only one atom.
At the energies lying between 2Ed < T < Ec (where Ec is the cut-off value of transferred
energy above which no displacements take place), the average number of displacements becomes T/(2Ed). Above the energies of Ec, there are no further displacements and the
average number of displacement is defined as Ec/(2Ed). Graphical representation of the
average number of displacements with respect to the transferred energy is shown in Fig. 1.2 [13,14].
The number of displacements per atom (dpa) can be defined as in the following formula: ( ) ( ) 0.8 2 d d F x dpa x N E (1.5) where Fd(x) is the energy distribution function, N is the number of displaced atom and Φ
is the fluence.
In the periodic crystals as in metals, displacement energy is dependent on the crystallographic directions. In other words, displacement energy is strongly correlated with the number of barrier atoms, the distance to the nearest atoms and the distance of the struck atom in its original lattice point to the barrier atoms [13,15]. The displacement energy of the struck atom is minimum along the direction of high lattice symmetry. However, recoil direction which is determined by the collision kinetics is random. Thus, the displacement energy is the average along all directions [16,17].
6
Figure 1.2 Graphical representation of Kinchin-Pease model [13].
1.2.2 Radiation effects on the microstructure and mechanical properties
Irradiation damage can introduce various defects. Table 1.1 shows the defect evolution at different irradiation temperatures. At low temperatures, mobility of atoms is limited, thus point defects can form small defect clusters. With the increase in the temperature, those defects evolve into planar vacancy loops and clusters. At the temperatures of 0.1Tm-0.3Tm (where Tm is the melting point of the alloy), interstitials are
highly mobile while the mobility of vacancies is still limited. At this temperature range, interstitials can form clusters and loops, and vacancies can form small vacancy clusters. Further increase in temperature results in the annihilation of defects either by recombination within the grains or at the sinks. At this temperature range of 0.3Tm-0.5Tm,
7
while interstitial atoms form interstitial dislocation loops, high vacancy concentration can lead to the formation of voids [18].
Table 1.1 Irradiation induced defect evolution at different temperatures [18]. Temperature (T/Tm) Defect type
0-0.1 Generation of point defects (vacancies and interstitials)
0.1-0.3 Point defect clusters
Vacancy loops, clusters and depleted zones Interstitial loops
0.3-0.5 Rafts (agglomerates of clusters and small loops) Voids
Fig. 1.3 summarizes the radiation damage in metals. Fig. 1.3a shows the displacement cascade event and the production of vacancies and self-interstitial atoms (SIAs). Fig. 1.3b through 1.3g show the annihilation of irradiation induced defects (either by recombination or at sinks), effect of irradiation on the diffusion and formation of radiation induced segregation (RIS) and radiation induced precipitation (RIP) together with void formation and irradiation induced creep [19].
8
Figure 1.3 (a) Displacement cascade and generation of vacancies and self-interstitial atoms (SIAs) (b-e) Annihilation of defects either by recombination or at sinks (f) Radiation-induced segregation (RIS) and radiation-Radiation-induced precipitation (RIP) at sinks. Jv: flux of
vacancies, Ji: flux of SIAs, Jsolute: flux of solutes and Jsolvent: flux of solvents (g) Growth of
the bubbles at the grain boundaries under stress-driven creep conditions [19].
1.2.2.1 Radiation induced segregation (RIS)
Irradiation at elevated temperatures results in redistribution of solutes by an imbalance of point defect migration to sinks such as dislocations, grain boundaries, voids, etc. This phenomenon is known as RIS [20]. RIS occurs at intermediate temperatures at which both vacancies and interstitials are generated and diffuse [18]. It has been reported that RIS occurs as a result of flux and size difference between the elements and binding energy difference between elements and point defects [18]. For engineering alloys, each alloying elements can diffuse through interactions with interstitials and vacancies, depending on atom size. An oversized atom prefers to interact with vacancies and an
9
undersized atom prefers to interact with interstitials. If one alloying element is dominated through interaction with interstitials, it will have the same flux direction as interstitials, hence resulting in sink enrichment. If one element prefers to interact with vacancies, it will have the opposite flux direction leading to depletion of the atom at the sink. Fig. 1.4 shows the flux direction of A and B atoms when they couple with interstitials and vacancies. Fig. 1.5 shows an example of RIS in austenitic stainless steels [22].
Figure 1.4 RIS by (a) vacancy mechanism and (b) interstitial mechanism. The length of the arrows represent the magnitude of the fluxes for A and B atoms [21].
10
Figure 1.5 Radiation-induced segregation of Ni, Si, P; depletion of Cr at the grain boundary of a 300 series stainless steel neutron irradiated to several dpa at ~300 °C [22].
1.2.2.2 Radiation induced precipitation (RIP)
Radiation might cause chemical mixing leading to the dissolution of precipitates depending on the radiation conditions. On the other hand, point defects resulted from radiation damage can favour precipitation by reducing the resultant strain. Therefore, during an irradiation, there might be radiation induced, radiation enhanced and radiation modified phase formation. Radiation induced phases are the ones that do not form under equilibrium annealing condition but form only under irradiation. Ni3Si (γ') and G-phase
(Mn-Ni-Si) precipitation in stainless steels are two examples which have been reported to affect hardening of alloys as well as the swelling behaviour [18].
11
Radiation enhanced precipitates normally form under thermal annealing conditions; however, their formation is accelerated under irradiation. M6C formation is an
example of irradiation enhanced precipitation [18].
α' is a Cr-rich precipitate which forms as a result of spinodal decomposition by both irradiation enhanced and irradiation induced mechanisms [6,35]. Irradiation induced depletion of Cr atoms at the sinks as a result of RIS might result in local enrichment of Cr atoms which results in the formation of α' by irradiation induced mechanism. Moreover, excess point defect formation under irradiation results in increased diffusivity of Cr atoms which accelerates the α' formation by irradiation enhanced mechanism [23].
1.2.2.3 Dislocation loops
Nucleation of dislocation loops occurs by clustering of point defects and net arrival of the defects determine the growth or shrinkage of the loops. Under cascade damage conditions, SIAs are emitted and transported in 1-D diffusional motion and the amount of freely migrating interstitials and vacancies is different. The reason of the bias is basically the energy release difference between absorbing an interstitial and a vacancy [24].
At the temperatures of 0.1Tm-0.3Tm, the microstructure is characterized by dislocation loops and point defect clusters. At relatively high temperatures (still within 0.1Tm -0.3Tm), the dislocation density has been reported to decrease slightly while their
size increases [20]. Fig. 1.6 shows the dislocation size and density with increasing irradiation dose at 300 °C. The loop size and density reach saturation within a few dpa as the formation rate of loops becomes equal to the destruction rate.
12
At the temperatures below 300 °C in iron-based alloys, dislocation loops are replaced by a high density of black dots, Frank loops, stacking fault tetrahedra and dislocation networks. On the other hand, at the temperatures above 300 °C, the microstructure is characterized by a high density dislocation networks and dislocation loops [20].
Figure 1.6 Dislocation loop size and density with increasing irradiation dose up to 13 dpa at 300 °C in various austenitic steels [25].
Fig. 1.7 shows the microstructure of a F/M steel (HT-9) neutron irradiated in FFTF at various temperature and damage levels. Microstructures consist of dislocation networks and loops. As mentioned above, dislocation loop size increases at higher temperatures [26].
13
Figure 1.7 TEM image showing dislocation loops and networks in HT-9 neutron irradiated (a) at 28 dpa, 384 °C (along g=200) (b) at 443 °C and 155 dpa (along g=110) [26].
1.2.2.4 Void swelling
The formation of voids under irradiation results in a volumetric expansion which is also denoted as ‘swelling’. Fig. 1.8 shows the formation of voids at 500 °C to a dose of 10 dpa and dimensional changes after irradiation at 533 °C in austenitic stainless steels [27,28].
Higher affinity of interstitials to dislocations results in excess vacancies leading to the void formation and swelling [18,29]. Swelling occurs in three stages. After the first stage of void nucleation, a transient swelling region appears where the swelling increases with increasing dose at an increasing rate. At the final stage, the steady state swelling regime, the swelling rate becomes constant [20].
14
Figure 1.8 (a) Void formation in 304 austenitic stainless steel after neutron irradiation at 500 °C up to 10 dpa [27]. (b) Volume change in 316 stainless steel rods irradiated at 533 °C to a fluence of 1.5 ×10²³/m2 in the EBR-11 reactor [28].
Void formation kinetics are strongly correlated with alloy composition, dose, dose rate, temperature and helium from transmutation reactions. Swelling is maximized at an intermediate temperature (0.3Tm-0.5Tm) resulting in a bell-shape curve of volume percent increase vs. temperature. This bell-shape is caused by low vacancy mobility at low temperature (hence less vacancy clustering) and vacancy loss to defect sinks at high temperature. Fig. 1.9 shows the bell-shaped swelling distribution with respect to temperature in nickel after a neutron fluence of 5x10²³ n/m2 [20].
Swelling is sensitive to stress and dpa rate. A higher dpa rate results in a shift of the swelling peak to higher temperatures [20].
15
Figure 1.9 Swelling vs. irradiation temperature curve in nickel for a neutron fluence of 5x10²³ n/m2 [30].
1.2.2.5 Radiation hardening
For over 20 years, there have been extensive studies to investigate the hardness increase in metals as a result of irradiation. It is believed that irradiation induced hardening is resulted from defect production during irradiation. Those defects are defect clusters, impurity-defect cluster complexes, dislocation loops, dislocation networks, voids and bubbles, and precipitates [20].
The effect of irradiation hardening on body centered cubic (bcc) and face centered cubic (fcc) metals is different at different temperatures. Fig. 1.10 shows the behaviour of fcc and bcc metals under irradiation. At low temperatures (below 0.3Tm), radiation hardening results in an increase in yield strength and a decrease in ductility for both
16
austenitic and ferritic steels. At high irradiation temperatures (above 0.3Tm-0.5Tm), the yield strength of austenitic steels remains the same while ductility decreases as shown in Fig 1.10a. On the other hand, ferritic steels show small amount of hardening at those temperatures [17].
Figure 1.10 Effect of neutron irradiation on stress-strain curves of (a) fcc structure (austenitic steels) (b) bcc structure (ferritic steels) [17].
Radiation strengthening occurs in two ways [17]: (1) ‘Source hardening’ is a result of starting of dislocation motion; (2) ‘Friction hardening’ is a result of dislocation-irradiation induced defects interactions.
For radiation induced hardening studies, the dispersed barrier model has been widely used [31]. In this model, interactions between obstacles and dislocations are based on the geometrical considerations. The yield strength increase resulting from radiation can be represented as:
17
where α is a barrier strength coefficient of the defects to restrict dislocation motion; M is Taylor factor; µ is the shear modulus; b is the length of the Burgers vector; N and d are the density and size of the obstacles, respectively [32].
1.3 Radiation resistance of materials: Effect of phase content, initial dislocation density, grain size, orientation and precipitate stability
Next generation fast spectrum reactors require structural materials that can tolerate higher temperature and radiation damage compared to the currently used austenitic steels. Initially, in order to increase the swelling and creep resistance of austenitic steels, cold-worked austenitic stainless steels containing fine precipitates were developed [33-37]. However, it has been shown that even though these modifications increase the transient regime up to ~150 dpa, they swell considerably (at a rate of 1% per dpa) once they reach steady state swelling regime [38-40]. Therefore, irradiation induced swelling becomes a serious problem and it limits the burn-up of the fuel [41-43].
It has been discovered that the ferritic steels have higher swelling and creep resistance than the austenitic steels [44]. Thus, tempered martensitic steels with bcc structure were determined to be one of the best candidates for next generation reactors because of their high defect sinks of submicron size lath structure, smaller dislocation bias and higher self-diffusion coefficient in the bcc structure [45-47]. Their creep strength has been increased considerably by the addition of alloying elements such as N, C, B, Ti, Ta, V, Nb to form fine size MX precipitates [19]. Recently, nanostructured alloys having a uniform microstructure with 1-2 nm Y-Ti-O rich nanofeatures (NFs) have been developed
18
by Oak Ridge National Laboratory (ORNL) and University of California Santa Barbara (UCSB) [48]. They have a ferritic matrix with a bcc structure having the above stated advantages over the fcc matrix. Those very small NFs provide higher strength and better thermal stability to the NFAs. Moreover, they serve as sinks for point defects and He gas, and trap the He gas in extremely small bubbles during neutron irradiation, resulting in a reduction in void swelling [9,19,49-51].
Radiation damage resistance in metals is directly correlated with the microstructure. In terms of microstructure tailoring to reduce radiation damage, there is little one can change in the primary defect generation stage to reduce the defect number. On the other hand, the eventual fate of defects in the next stage can be manipulated by microstructural designs. One way is to increase the sink strength by providing high density stable dislocations to reduce the diffusion coefficient and number of the vacancies and interstitials. By this way, RED, RIS and defect pile up at the cavities, voids and dislocations can be reduced [19]. Fig. 1.11 shows that high dislocation densities result in a lower amount of defects due to higher sink densities. Furthermore, higher displacement rates produce a larger amount of defects as the defect production rate is higher than the loss rate to sinks [17].
19
Figure 1.11 (a) vacancy and (b) interstitial concentrations in an irradiated metal as a function of temperature. Solid and dashed lines represent high and low defect production rates, respectively. Upper curves of the solid and dashed lines represent higher dislocation density [17].
High dislocation densities generally result in reduced swelling due to the sink imbalances [52-55]. Formation of small bubbles below a critical size is also beneficial for improving the void swelling resistance. High dislocation density results in the nucleation of small bubbles on dislocations [19]. In general, this results in a longer incubation period before void nucleation can occur resulting in less void swelling. Fig. 1.12 shows that a high dislocation density introduced by plastic strain decreases the swelling of austenitic stainless steels considerably [55].
20
Figure 1.12 Micrographs illustrating the microstructures of (a) solution annealed austenitic stainless steel irradiated to 36 dpa at 520 °C and (b) 20% cold worked stainless steel irradiated to 54 dpa at 550 °C in HFIR [55].
A second way of microstructural tailoring to improve radiation resistance is to create large incoherent interface areas by grain size refinement. It has been shown that void swelling of the stainless steels is strongly related to the grain size [56-58]. Bai et al. studied the mechanism of grain boundary (GB) enhancement of radiation resistance in copper [59]. They found that grain boundaries have a “loading-unloading” effect in such a way that interstitials are loaded into the boundary during irradiation and then they are emitted by grain boundaries to annihilate vacancies within the grain, as shown in Fig. 1.13 [59]. Chen et al. studied the defect annihilation mechanisms at the grain boundaries of alpha-iron [60]. They reported that chain like defects consisting of alternately positioned interstitials and vacancies form and annihilate at the grain boundaries showing the high sink efficiency of the grain boundaries [60]. Moreover, Sun et al. observed the annihilation
21
of dislocation loops at the grain boundaries in nano-grained Ni by in-situ Kr ion irradiation [61].
Figure 1.13 Temperature accelerated dynamics simulations of damage self-healing near the GB (within 10 Å of the GB). Smaller black spheres in A: nondefective atoms; larger green spheres: interstitials; red cubes: vacancies; smaller blue spheres: atoms that move more than 1 Å during an event; purple vectors: the moving directions and distances of moving atoms [59].
Geometrically, a grain boundary has a 3D structure consisting of a boundary plane and a misorientation between two adjacent crystals. Sink efficiency of GBs is directly related with the grain boundary plane i.e. local habit plane and surface curvature of the
22
plane as well as the misorientation angle. Even though high angle grain boundaries (HABs) provide a larger sink strength for defect annihilation due to their large free volume, it has been shown that the RIS and REP occur mostly at those boundaries [62]. Moreover, Sekio et al. reported that while random grain boundaries serve as annihilation sites for defects leading to the formation of void denuded zones, coincidence site lattice boundaries (CSLBs) have no effect on the void distribution [63]. Fig. 1.14 shows the void distribution near a high angle random boundary having high sink strength and a CSLB having low sink strength.
Figure 1.14 Void distributions in the Fe–15Cr–15Ni steel neutron-irradiated at 749 K to 18 dpa near the (a) random GB (b) CSLB. The black dashed lines represent the region of void denuded zone [63].
The third method of microstructural manipulation to enhance materials’ radiation resistance is the introduction of dispersoids in the matrix. This can have two benefits. At
23
low temperatures (below 0.3 Tm) a fine distribution of dispersoids can serve as sinks for defects resulting in a reduced defect density and a reduction in hardening. At intermediate temperatures (0.3Tm-0.5Tm) a fine distribution of dispersoids can delay void nucleation by trapping helium and point defects, and reducing void swelling. Therefore, it is critical to have high density of precipitates homogenously distributed in the matrix. Fig. 1.15 shows the irradiation response of two types of alloys. One contains a large population oxide dispersoids (MA957) while the other does not (F82H). It is obvious that the oxide dispersion results in a considerable improvement in the swelling resistance [64].
Figure 1.15 Under-focused bright field TEM images of the dual ion beam irradiated cavity structures in (a) F82H and (b) MA957 irradiated to 42 dpa and 2100 appm He at 500 °C (at 1000 nm from the surface) [64].
24
1.4 Materials for nuclear applications and radiation resistance of ferritic steels
Ferritic and F/M steels having the bcc structure have higher swelling resistance compared to fcc austenitic stainless steels as their dislocation bias, B, is lower, reducing their steady state swelling rate and increasing the incubation periods for void nucleation. The lower B in bcc metals is resulted from their defect relaxation volumes [65]. Together with their high swelling resistance, ferritic steels show low RED and RIS compared to fcc austenitic steels since their self-diffusion coefficient is higher [45].
Fig. 1.16 shows schematics explaining the irradiation damage resistance in NFAs versus 9Cr normalized and tempered martensitic steels (TMS). Fig.1.16a shows how the irradiation resistance of NFAs is a result of a high density of NFs and dislocations. NFs can trap the He gas into small bubbles. Further, they can pin the dislocations and grain boundaries resulting in the conservation of the high sink densities for defect annihilation, high strength and creep resistance. Moreover, high dislocation density keeps the He bubbles away from the grain boundaries leading to high creep resistance [19]. Fig. 16b indicates that coarser scale microstructures together with lower sink strengths result in lower irradiation damage resistance in TMS compared to NFAs [19]. Therefore, it leads to more swelling, a large number of dislocation loops, REP and a high amount of He accumulation at the grain boundaries in TMS [12]. When the concentration of He is ~1700 appm, TMS shows intergranular brittle fracture while NFA shows ductile fracture [66].
25
Figure 1.16 Schematic of irradiation effects in (a) nanostructured ferritic alloys (NFAs) (b) 9Cr normalized and tempered martensitic steels (TMSs) [19].
In conclusion, high precipitate, dislocation, grain boundary and bubble concentrations reduce RED, RIS, and vacancy flux as well as void swelling. Unfortunately, high temperature recovery processes make the conservation of the high dislocation density difficult. However, NFs hinder the recovery by pinning the dislocation motion. Therefore, a high density of dislocations and NFs supply the high radiation damage resistance in NFAs. This also provides higher creep strength at high temperature as the NFs are thermodynamically stable above 1000 °C even though there is a probability of recoil dissolution and amorphization under irradiation [67].
26 1.5 Production methods of ferritic steels 1.5.1 Production methods of precursor slab
The chemistry of structural materials for nuclear applications should be tightly controlled during their production. Therefore, either casting methods by vacuum induction melting (VIM) followed by vacuum arc refining (VAR) or powder metallurgy routes are used.
1.5.1.1 Casting by vacuum induction melting (VIM) and vacuum arc remelting (VAR) VIM is a refining process that is used to reduce the impurity levels in the alloy steels. During remelting process, the elements that are difficult to dissolve should be added at the early stages when the stirring rates are high. On the other hand, alloying elements that are easy to oxidize or evaporate should be added later. The remelting process can be conducted with a controlled gas composition at pressures as low as 5 mmHg. Thus, oxygen, hydrogen, nitrogen and carbon content can be decreased to quite low levels. Moreover, the loss of volatile elements can be prevented by using an inert gas atmosphere instead of vacuum over the melt. By using VIM, it is possible to produce very clean steels. VIM can also be used as the first step for VAR for further refinement. VAR can be conducted using either a low pressure vacuum induction melter or a stream degasser [68]. The process can produce very clean steels with low hydrogen and oxygen contents with minimum inclusion and segregation [69].
27
1.5.1.2 Powder metallurgy methods: Mechanical alloying
High temperature alloys can be produced by mechanical alloying which is a powder metallurgical process for the introduction of stable refractory oxides. This method has been developed by the International Nickel Company using high-energy ball milling of dry powder mixtures of raw materials [70]. The mixture is consolidated by canning under vacuum followed by hot-isostatic pressing or extrusion. Further thermo-mechanical treatments such as annealing or hot rolling can be applied for microstructure tailoring [71]. ODS nickel and iron-based superalloys are produced by mechanical alloying method [72]. Fig. 1.17 shows the typical steps taken in ODS alloy production by mechanical alloying method.
Figure 1.17 Typical mechanical alloying process for the production of ODS alloys [72].
28 1.5.2 Further processing methods
1.5.2.1 Tube production methods 1.5.2.1.1 Hydrostatic extrusion
Hydrostatic extrusion is a process where the billet is extruded through the action of a liquid pressure medium instead of direct application of the load through a ram. The advantages of hydrostatic extrusion are that (1) since the friction between billet and die is zero, the length of the billet is not a factor affecting the extrusion pressure; (2) since the pressure is hydrostatic in nature, buckling of the billets is also not a problem making the extrusion of skewed billets possible [73].
Many different materials have been hydrostatically extruded successfully [74-76]. Hydrostatic extrusion can be applied at the temperatures below the recrystallization temperature of the materials where it is not possible with conventional extrusion. Also, it creates a beneficial stress state resulting in materials with better strength and ductility [77-79].
1.5.2.1.2 Pilger processing
Pilger processing is one of the methods to produce seamless tubes using both hot and cold working methods. Hot pilgering is executed by steady forward and backward motion of cylindrical rotary mandrel. After each pass, the tube-mandrel assembly is turned 90°. To obtain final thin walled tubes, up to six passes can be applied. However, further thinning with well controlled dimensional accuracy requires cold pilgering. Cold pilgering
29
uses tapered grooved rolls which rotate forward and backward with 180°. In cold pilgering, the sample is fixed and rolls propagate while it is the reverse in hot pilgering [80].
Generally, cold pilgering is a well controlled process and used for the tubes having the wall thickness tolerances less than 10%. The final product can be used either directly or as an intermediate product before a final drawing process [80].
1.5.2.1.3 Spray forming
Spray forming is a process consisting of spraying of gas atomized powders on a substrate for the production of near-net shape parts [81-83]. By directly spraying of the powders, powder metallurgical steps can be eliminated. During spray forming process, high energy gas jets break apart the liquid metal melted in the atomization zone which results in metal flowing rates of 0.2-2.0 kg/s [82,83]. Modelling studies have shown that 0.5-0.8 fraction of the metal droplets can be solidified by high velocity gas flow during spraying in a few milliseconds [84]. The rest of the metal droplets solidify at a slower rates ~10 to 100 s or more [84,85]. The resulting deposit takes the shape of the billet and has very low porosity with fine microstructure. This preform can be used either as its sprayed form or as a substrate for further processing. Fig. 1.18 shows a typical spray forming principle and a preform in tubular shape.
30
Figure 1.18 (a) A typical spray forming set up and principle [81] (b) tubular preform produced by spray forming [83].
Advantages of the spray forming include [83]: - high densities >98%,
- fine grained microstructure with equiaxed grains, - no prior particle boundaries,
- no macroscopic segregation, - improved mechanical properties, - flexibility in alloying components,
- high rate deposition and reduction in overall production time.
In spite of a large number of advantages, low overall yield and poor shape and composition control are the main limitations of this method [83].
31 1.5.2.2 Severe plastic deformation (SPD)
Previous studies have shown that nano-grained metals often exhibit improved swelling resistance due to defect sink properties of high density nano-grain boundaries [86]. For microstructure refinement, SPD which is the combination of shear deformation and pressure is one of the most promising methods. Cracking is prevented by the application of pressure allowing the application of large deformations. High pressure torsion (HPT) [87] and equal channel angular pressing (ECAP) [88] are the two most commonly used methods of SPD that have been utilized to produce nanostructured metals for a few decades.
HPT is the simplest method and it consists of the deformation of the sample between the two Bridgman anvils as shown in Fig. 1.19a. The upper anvil is fixed and the lower one is rotatable which provides various strains. The imposed shear strain at half-radius was estimated by γ=2πrn/h (where r is the distance from a disk center, h is the thickness of the disk and n is the number of rotations). Fig. 1.19b explains the geometry of shear deformation in HPT process. By this method, large strains up to 15 GPa can be applied at low temperatures [89].
32
Figure 1.19 Schematic diagram of (a) HPT process; (b) shear geometry in HPT process [89].
1.5.2.3 High rate shock loading
Shock loading is a one-dimensional plane strain deformation similar to the uniaxial loading if the loading is enough and the sample is thin enough [90]. Shock loading of samples is applied either under laboratory conditions or under controlled firing-point conditions. These experiments can be conducted by high-exposure explosives, gun-launched impactors such as flyer or driver plates, exploding foils, or direct radiation impingement such as lasers and electron beams [91-93].
Shock loading creates defects, basically edge dislocations, and those defects move in the direction of shock wave propagation in the case of a planar shock wave. Moreover, the density of defects increases with the increase in the peak shock pressure. However, depending on the crystal structure and stacking fault energy of the materials, shock loading can create deformation twins and stacking faults above certain pressures or at lower temperatures. If the stacking fault energy is low, which is the case especially for fcc metals, dislocations dissociate into partial dislocations which makes the cross-slip of
33
dislocations more difficult. Fig. 1.20 shows the dislocation cell formation together with twin and stacking fault formation with increasing shock pressure in fcc metals. The stacking fault energy of nickel is 128 mJ/m2 while it is 20 mJ/m2 for 304 stainless steel [94]. Thus, their resultant microstructures as a result of shock loading is very different [95].
Figure 1.20 Micrographs showing the evolution of microstructure with increasing shock loading pressures in Nickel and 304 stainless steel [95].
![Figure 1.6 Dislocation loop size and density with increasing irradiation dose up to 13 dpa at 300 °C in various austenitic steels [25]](https://thumb-us.123doks.com/thumbv2/123dok_us/75192.2508542/34.918.232.728.383.769/figure-dislocation-density-increasing-irradiation-various-austenitic-steels.webp)
![Figure 1.7 TEM image showing dislocation loops and networks in HT-9 neutron irradiated (a) at 28 dpa, 384 °C (along g=200) (b) at 443 °C and 155 dpa (along g=110) [26]](https://thumb-us.123doks.com/thumbv2/123dok_us/75192.2508542/35.918.160.791.178.482/figure-image-showing-dislocation-loops-networks-neutron-irradiated.webp)
![Figure 1.9 Swelling vs. irradiation temperature curve in nickel for a neutron fluence of 5x10 23 n/m 2 [30]](https://thumb-us.123doks.com/thumbv2/123dok_us/75192.2508542/37.918.281.666.132.534/figure-swelling-irradiation-temperature-curve-nickel-neutron-fluence.webp)
![Figure 1.10 Effect of neutron irradiation on stress-strain curves of (a) fcc structure (austenitic steels) (b) bcc structure (ferritic steels) [17]](https://thumb-us.123doks.com/thumbv2/123dok_us/75192.2508542/38.918.155.796.339.560/figure-effect-neutron-irradiation-structure-austenitic-structure-ferritic.webp)
![Figure 1.15 Under-focused bright field TEM images of the dual ion beam irradiated cavity structures in (a) F82H and (b) MA957 irradiated to 42 dpa and 2100 appm He at 500 °C (at 1000 nm from the surface) [64]](https://thumb-us.123doks.com/thumbv2/123dok_us/75192.2508542/45.918.156.790.509.822/figure-focused-bright-images-irradiated-structures-irradiated-surface.webp)

![Figure 1.20 Micrographs showing the evolution of microstructure with increasing shock loading pressures in Nickel and 304 stainless steel [95]](https://thumb-us.123doks.com/thumbv2/123dok_us/75192.2508542/55.918.230.727.380.913/figure-micrographs-showing-evolution-microstructure-increasing-pressures-stainless.webp)
