Increasing vertical resolution in US models to improve
track forecasts of Hurricane Joaquin with HWRF as
an example
Banglin Zhanga,b,1, Richard S. Lindzenc,1, Vijay Tallapragadaa, Fuzhong Wengd, Qingfu Liua, Jason A. Sippela,b, Zaizhong Maa,b, and Morris A. Bendere
aEnvironmental Modeling Center, National Centers for Environmental Prediction, National Oceanic and Atmospheric Administration, College Park, MD 20740;bI.M. Systems Group, Inc., College Park, MD 20740;cDepartment of Earth, Atmospheric and Planetary Sciences, Massachusetts Institute of Technology, Cambridge, MA 02139;dSatellite Meteorology and Climatology Division, Center for Satellite Applications and Research, National Oceanic and Atmospheric Administration, College Park, MD 20740; andeGeophysical Fluid Dynamics Laboratory, National Oceanic and Atmospheric Administration, Princeton, NJ 08540
Contributed by Richard S. Lindzen, August 18, 2016 (sent for review April 18, 2016; reviewed by Michael S. Fox-Rabinovitz and Clifford F. Mass)
The atmosphere−ocean coupled Hurricane Weather Research and
Forecast model (HWRF) developed at the National Centers for Envi-ronmental Prediction (NCEP) is used as an example to illustrate the impact of model vertical resolution on track forecasts of tropical cyclones. A number of HWRF forecasting experiments were carried out at different vertical resolutions for Hurricane Joaquin, which occurred from September 27 to October 8, 2015, in the Atlantic Basin. The results show that the track prediction for Hurricane Joaquin is much more accurate with higher vertical resolution. The positive impacts of higher vertical resolution on hurricane track forecasts suggest that National Oceanic and Atmospheric Administration/ NCEP should upgrade both HWRF and the Global Forecast System to have more vertical levels.
vertical resolution
|
model development|
hurricane forecast|
HWRFO
n October 29, 2012, Hurricane Sandy made landfall nearBrigantine, NJ. Five days in advance, the European Centre for Medium-Range Weather Forecasting (ECMWF) Integrated
Forecasting System (IFS) pinpointed Sandy’s infamous left
hook track directly into New Jersey (1). However, both the National Oceanic and Atmospheric Administration (NOAA) National Center for Environmental Prediction (NCEP) Global Forecast System (GFS) and the Hurricane Weather Research and Forecasting (HWRF) models predicted that the storm would take an easterly track into the open Atlantic Ocean near Bermuda (1, 2).
After Hurricane Sandy, the US Congress allocated funding to the National Weather Service (NWS) through the Disaster Relief Appropriations Act of 2013 to upgrade computing in-frastructure (3). With the larger capacity, NOAA/NWS updated GFS in 2015 to a horizontal resolution of about 13 km out to 10 d and 33 km thereafter, which was higher than the ECMWF IFS horizontal resolution at that time (4). The HWRF model was also upgraded in 2015 (hereafter H215) from 27/9/3 km resolution to 18/6/2 km for three telescopic domains, which allows the model to better resolve the fine scale of the hurri-cane inner core structure and provides improved intensity, size, and structure forecasts. In addition, the H215 intermediate nest domain size was increased by 20% to capture larger storm re-gions within the moving domain (5, 6).
In this study, we tested much higher vertical resolution in HWRF to investigate its impact on track forecasts for Hurri-cane Joaquin, the strongest hurriHurri-cane in the Atlantic Ocean since 2010. In this case, the ECMWF model consistently and correctly predicted the track away from the US mainland, whereas NOAA/NCEP GFS and HWRF, initialized on Sep-tember 30 and October 1, 2015, predicted possible landfall along the US East Coast.
Issues
There are a number of differences between ECMWF IFS and NCEP GFS, including physics, data assimilation schemes, and
other technical parameters (7–12). Previous studies have pointed
to the differences in the way cloud systems are handled and the way satellite data are ingested into the models as being impor-tant for model performance (9, 13). Another noted difference between GFS and IFS is the vertical resolution. GFS currently has 64 vertical levels for both its ensemble and deterministic models, whereas the respective IFS systems have 137 and 91 vertical levels (14, 15).
It has been noted (16) that vertical resolution must be consistent with horizontal resolution (i.e., vertical and horizontal resolution should be increased concurrently), but this has not happened in NCEP models. In 2002, NOAA/NCEP upgraded GFS to about 55 km horizontal resolution with 64 vertical levels (T254L64) from a horizontal resolution of 75 km with 42 vertical levels (17). Since then, the horizontal resolution of GFS has increased to 13 km, which is almost 4 times higher than the 2002 upgrade. However, the vertical resolution has not been increased at all, which suggests it may now be inconsistent with the horizontal resolution.
Meanwhile, the horizontal and vertical resolutions in ECMWF have increased together. In February 2006, ECMWF updated its IFS high-resolution deterministic model (HRES) by increasing
Significance
For forecasts of Hurricane Joaquin in 2015, the European Cen-tre for Medium-Range Weather Forecasting model consistently and correctly predicted a track away from the US mainland, while the National Oceanic and Atmospheric Administration National Centers for Environmental Prediction Global Forecast System (GFS) and Hurricane Weather Research and Forecast (HWRF) models made erroneous track forecasts with landfall on the US East Coast. Our investigation found that inadequate vertical resolution in HWRF likely contributed to the track error. A number of HWRF forecasting experiments, carried out at different vertical resolutions, show that the track forecasts of Hurricane Joaquin (2015) were greatly improved by increasing the vertical resolution of the forecast model. These results suggest that hurricane tracks in GFS could also be improved by increasing vertical resolution in that model.
Author contributions: B.Z., R.S.L., V.T., and F.W. designed research; B.Z. and Q.L. per-formed research; B.Z., Q.L., and Z.M. analyzed data; and B.Z., R.S.L., V.T., F.W., Q.L., J.A.S., and M.A.B. wrote the paper.
Reviewers: M.S.F.-R., University of Maryland; and C.F.M., University of Washington. The authors declare no conflict of interest.
1To whom correspondence may be addressed. Email: [email protected] or banglin.
[email protected]. EARTH, ATMOSPHERIC, AND PLANETARY SCIENCES
the number of vertical levels from 64 to 91 and increasing the horizontal resolution from about 60 km to 25 km [IFS Cycle 30r1 (18)]. In January 2010, the horizontal resolution of HRES was increased to 16 km in the IFS Cycle 36r1 (19). In June 2013, ECMWF increased the number of HRES vertical levels from 91 to 137 for the IFS Cycle 38r2 upgrade (14).
The importance of resolution is illustrated in Fig. 1, which shows that the track forecasts of Hurricane Joaquin from the ensemble mean of the ECMWF IFS ensemble (ENS) are not as good as those from HRES. The degradation of the mean fore-casts is associated with a number of individual ensemble members whose storms track sharply to the west and make landfall along the US East Coast. The difference in track is likely a result of reso-lution, because ENS and HRES are quite similar except that ENS has 91 vertical levels with about 32 km horizontal resolution, whereas HRES has 137 levels with horizontal resolution of about 16 km (14, 15). Lower vertical resolution could also contribute to
the poor NOAA/NCEP GFS track, because GFS has only 64 vertical levels, less than half of HRES, whereas the horizontal resolution of the two models is about same. Likewise, HWRF has only has 61 verticals levels, which did not change even as the horizontal resolution increased by about 50% in 2015.
Experiment Setup
HWRF was developed primarily at the NWS/NCEP’s
Environ-mental Modeling Center, in collaboration with NOAA Geophysical Fluid Dynamics Laboratory (GFDL), NOAA Atlantic Oceano-graphic and Meteorological Laboratory (AOML), and the Univer-sity of Rhode Island, taking advantage of the Weather Research and Forecasting (WRF) model infrastructure developed at the National Center for Atmospheric Research. The 2015 operational HWRF is triply nested with 18/6/2 km horizontal resolution and 61 vertical levels and a model top of 2 hPa (15, 16). The model has an outer domain spanning about 80° x 80° (D01_H215 in Fig. 2) with 50N 40N 30N 20N 90W 80W 70W 60W 50W 40W 50N 40N 30N 20N 90W 80W 70W 60W 50W 40W 50N 40N 30N 20N 90W 80W 70W 60W 50W 40W HRES EEMN EN01 EP01 90W 80W 70W 60W 50W 40W 50N 40N 30N 20N
A
B
C
D
Fig. 1. Five-day forecast tracks of Hurricane Joaquin by (A) HRES, (B) ENS mean (EEMN), (C) ENS member EP01, and (D) ENS member EN01. The National Hurricane Center (NHC) best track is shown in black from 0000 UTC September 28, 2015, to 0000 UTC October 8, 2015, at a 12-h interval.
Fig. 2. Two telescopic two-way interactive nested with parent domains in H215 and HWRF for this study. The resolutions are 18 km for the parent domain (D01_H215 or D01_large), and 6 km and 2 km for nested domains D02 and D03, respectively. The domain center (72.8°W, 24.8°N) is for Hurricane Joaquin at 1200 UTC September 30, 2015.
two telescopic two-way interactive nested domains. The in-termediate and inner nests, which move with the storm, cover
areas of∼12°×12° (D02) and 7.1°×7.1° (D03), respectively
(Fig. 2).
To illustrate the importance of increased vertical resolution on track forecasts of tropical cyclones and other high-impact events, we ran several configurations of HWRF with changes to both the number of vertical levels and the model top. The first set of experiments used a model top of 5 hPa and either 61 or 96 vertical levels. The second set of experiments used a model top of 0.5 hPa and 61, 96, 113, or 121 levels. In all of the above experiments, we enlarged the outer domain size that was used
in H215 from about 80°×80° to 161.5°×85° (D01_large, Fig. 2).
In addition, although the operational HWRF uses the GFS analysis for its outer domain, for this study, the outer domain uses the previous HWRF forecast to reduce the impacts of the GFS on the initial conditions.
Results
Joaquin became a tropical depression on September 28, 2015, well southwest of Bermuda. After becoming a tropical storm the next day, Joaquin moved southwestward and underwent rapid intensification, reaching hurricane status on September 30 and reaching Category-3 hurricane strength on October 1. Meandering
over the southern Bahamas, Joaquin’s eye passed near or over
several islands. On October 3, the hurricane weakened somewhat and accelerated to the northeast. Abrupt reintensification ensued later that day, and Joaquin acquired sustained winds of 155 mph (250 km/h), just short of Category 5 strength; this made it the strongest Atlantic hurricane since 2010 (20). Thereafter, Joaquin
slowly weakened as it accelerated northeastward and moved to the west of Bermuda.
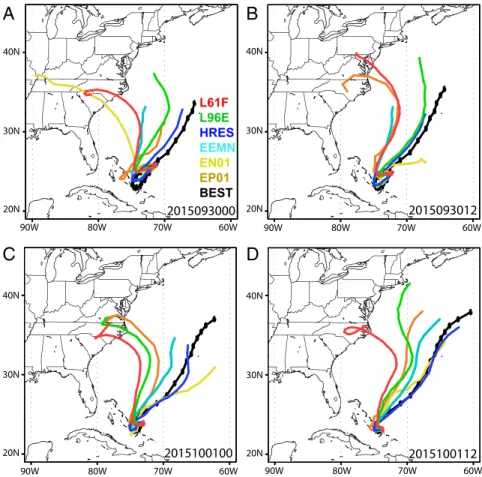
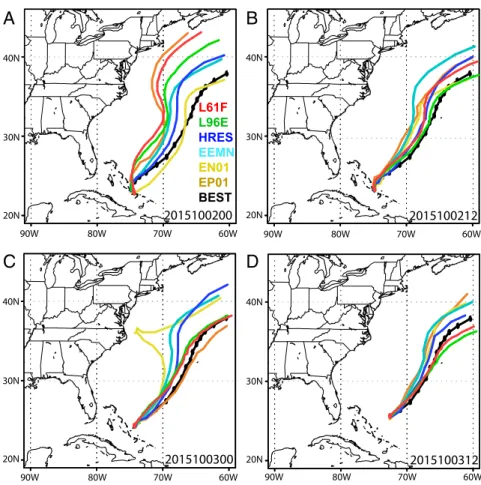
We first compare the ECMWF forecast to HWRF forecasts with a 5-hPa model top and different vertical resolutions. All HWRF forecasts of Joaquin herein were initialized from 1200 UTC September 27 to 0000 UTC October 8, 2015. Fig. 3 shows the 5-d track forecasts of Hurricane Joaquin using HWRF, HRES, and ENS initialized at 0000 UTC September 30, 2015, to 1200 UTC October 1, 2015, at 12-h intervals. For the first 2 d, the low vertical resolution HWRF model (L61F) predicted that Hurricane Joaquin would make landfall on the US East Coast, whereas the ECMWF had a correct forecast of no US landfall. Similar to Fig. 3, Fig. 4 shows forecasts initialized from 0000 UTC October 2, 2015, to 1200 UTC October 3, 2015. From October 2 onward, the low-resolution model fore-casts improved. In the meantime, the high-resolution HWRF model (L96E) had significantly improved skill but was still behind the 137-level HRES, which correctly made all six fore-casts offshore.
Fig. 5 compares track forecast errors from L61F and L96E with those from both the GFS and ECMWF. The track forecast errors from L61F, which has a bigger domain size than H215 and used warm-start initial conditions, are slightly smaller than those in H215. Meanwhile, an increase from 61 to 96 levels in L96E cuts the track forecast error at day 5 from about 600 nautical miles (NM) to about 450 NM. The track forecast errors from both L96E and L61F are initially near the upper bound of track errors in ENS, but, after about 72 h, track error in L96E is near the ENS ensemble median. The poorer quality in L96E during the first 36 h compared with the ENS forecast could be 40N 30N 20N 40N 30N 20N 40N 30N 20N 40N 30N 20N 90W 80W 70W 60W 90W 80W 70W 60W 90W 80W 70W 60W 90W 80W 70W 60W 2015093000 2015093012 2015100112 2015100100
(a)
(b)
(c)
(d)
L61F L96E HRES EEMN EN01 EP01 BESTA
B
D
C
Fig. 3. Five-day track forecasts of Hurricane Joaquin by HWRF, HRES, selected ENS members, and the ENS mean (EEMN) initialized at (A) 0000 UTC September 30, 2015, (B) 1200 UTC September 30, 2015, (C) 0000 UTC October 1, 2015, and (D) 1200 UTC October 1, 2015, compared with the best track. HWRF ex-periments L61F and L96E are in red and green, respectively; HRES is in blue; EEMN is in cyan; the individual ENS members (EP01 and EN01) are in yellow and orange; and the NHC best track is shown in black (BEST).
EARTH,
ATMOSPHERIC,
AND
PLANETARY
due to a difference in data assimilation. The 4D-variational data assimilation and good use of satellite data such as cloud radiances in ECMWF are known to improve both analyses and forecasts (13).
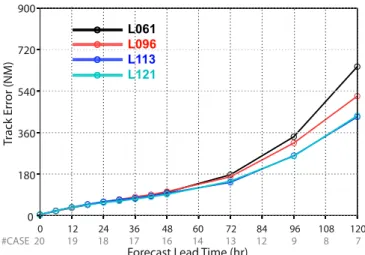
An additional set of experiments was performed by varying the vertical resolution with the model top raised to 0.5 hPa, and Fig. 6 shows the track error as a function of lead time for
these experiments. Here the forecasts with 61 (L061) levels pro-duce the poorest tracks. Although the forecasts with 96 levels (L096) produce better tracks than those with 61 levels, they are much worse tracks than those with 113 (L113) or 121 (L121) levels. In this instance, 96 levels likely yields insufficient vertical resolution because of the higher model top. On the other hand, the experiments with either 113 or 121 vertical levels produce even 40N 30N 20N 40N 30N 20N 40N 30N 20N 40N 30N 20N 90W 80W 70W 60W 90W 80W 70W 60W 90W 80W 70W 60W 90W 80W 70W 60W 2015100200 2015100212 2015100312 2015100300
A
B
D
C
L61F L96E HRES EEMN EN01 EP01 BESTFig. 4. As in Fig. 2 but for track forecasts initialized at (A) 0000 UTC October 2, 2015, (B) 1200 UTC October 2, 2015, (C) 0000 UTC October 3, 2015, and (D) 1200 UTC October 3, 2015. 900 720 540 360 180 0 Tr ack Err o r (NM) 0 12 24 36 48 60 72 84 96 108 120 #CASE 40 38 36 34 32 30 28 25 23 19 17
Forecast Lead Time (hr)
A
L61F L96E HWRF AVNO Tr ack Err o r (NM) 0 12 24 36 48 60 72 84 96 108 120 #CASE 20 19 18 17 16 14 13 12 9 8 7 900 720 540 360 180 0B
Forecast Lead Time (hr)
L61F L96E HRES EEMN ENS
Fig. 5. Track forecast errors as a function of forecast lead time from the L61F (red) and L96E (green) HWRF experiments compared with the errors from (A) the NOAA/NWS/NCEP operational HWRF (blue) and GFS (AVNO, purple) and (B) HRES (blue), the ENS mean (EEMN, cyan), and the 19 (of 51) individual ensemble members from ENS that have the longest track forecasts (ENS, gray dotted curves). The case numbers inBare about half that inAbecause ECMWF forecasts run at 12-h intervals.
better tracks than L96E. The small difference of the track fore-casts from 113 and 121 suggests there is no benefit to increasing vertical resolution beyond a certain critical level.
Discussion
We have used forecasts of Hurricane Joaquin, for which the op-erational NCEP HWRF model performed poorly, to demonstrate that increasing vertical resolution can improve hurricane track forecasts. The H215 configuration used 61 vertical levels and a model top of 5 hPa. Meanwhile, the ECMWF IFS ensemble and deterministic forecasts both have significantly more vertical levels and outperformed H215 in terms of forecast track error for Joa-quin. Our first set of experiments here tested improving HWRF to
96 levels, which is commensurate with that in the ECMWF IFS ensemble. This experiment considerably improved upon the track error in H215 and resulted in errors consistent with the ECMWF ensemble median. A second set of experiments in-creased the HWRF model top and found that results further improve when even more levels are added. These results illus-trate that the vertical resolution is very important in model development for forecasts of hurricanes and other high-impact events and support the NCEP plan to upgrade GFS to 128 vertical levels from the current 64 levels.* The results can likely be improved upon further by tuning model physics for the in-crease in vertical resolution.
Although we acknowledge that increasing vertical resolution is one of a number of ways that has been demonstrated to improve forecasts of Sandy (12), ongoing tests with other storms have revealed a general benefit of increasing vertical resolution. The statistics from 150 forecasts completed thus far form Sandy, Edouard (2014), Gonzalo (2014), Ida (2015), and Joaquin show substantial benefits for both track and intensity when vertical resolution is increased. The present paper illustrates the poten-tial of using higher vertical resolution.
ACKNOWLEDGMENTS.B.Z. thanks Prof. R. T. Pinker from the University of Maryland for her support and early review of this manuscript. The authors thank Prof. C. Mass of University of Washington and Dr. M. S. Fox-Rabinovitz of University of Maryland for their reviews and insightful comments and suggestions that greatly improved this manuscript. We thank the HWRF team for making this study possible [partially supported by the NOAA Hur-ricane Forecast Improvement Program (HFIP) project]. Financial support from Geostationary Operational Environmental Satellite R-Series (GOES-R) Risk Reduction Project and Joint Polar Satellite System (JPSS) Proving Ground and Risk Reduction program is greatly appreciated.
*Ek M, et al., 29th Session of the WWRP/WCRP Working Group on Numerical Experimen-tation, March 10−14, 2014, Melbourne, VIC, Australia.
1. Kerr RA (2012) One Sandy forecast a bigger winner than others.Science338(6108): 736–737.
2. Blake ES, et al. (2013) Tropical cyclone report: Hurricane Sandy (Natl Hurricane Cent, Miami), Rep AL182012.
3. 113th US Congress (2013) Disaster Relief Appropriations Act, HR 152.
4. National Weather Service (2015)GFS/GDAS Upgrade(Natl Weather Serv, Silver Spring, MD), TIN 14-46.
5. National Weather Service (2015)HWRF Model Upgrade(Natl Weather Serv, Silver Spring, MD), TIN 15-25.
6. Tallapragada V, et al. (2015)Hurricane Weather Research and Forecasting (HWRF) Model: 2015 Scientific documentation(Dev Testbed Cent, Boulder, CO).
7. Buizza R, et al. (2005) A Comparison of the ECMWF, MSC, and NCEP Global Ensemble Prediction Systems.Mon Weather Rev133(5):1076–1097.
8. Wu W-S, Purser RJ, Parrish DF (2003) Three-dimensional variational analysis with spatially inhomogeneous covariances.Mon Weather Rev130(12):2905–2916. 9. Bauer P, Geer AJ, Lopez P, Salmond D (2010) Direct 4D-Var assimilation of all-sky
radiances. Part I: Implementation.Q J R Meteorol Soc136(652):1868–1885. 10. Bonavita M, Hólm E, Isaksen L, Fisher M (2015) The evolution of the ECMWF hybrid
data assimilation system.Q J R Meteorol Soc142(694):287–303.
11. Zhu Y, et al. (2015) Variational correction of aircraft temperature bias in the NCEP’s GSI analysis system.Mon Weather Rev143(9):3774–3803.
12. Bassill NP (2014) Accuracy of early GFS and ECMWF Sandy (2012) track forecasts: Evidence for a dependence on cumulus parameterization.Geophys Res Lett41(9): 3274–3281.
13. Krame D (2016) Europeans shine in weather forecasting.Phys Today69(1):22–24. 14. European Centre for Medium-range Weather Forecasts (2013) Cycle 38r2 summary of
changes (Eur Cent Medium-range Forecasts, Reading, UK). Available at www.ecmwf. int/en/forecasts/documentation-and-support/evolution-ifs/cycles/cycle-38r2-summary-changes. Accessed September 15, 2016.
15. European Centre for Medium-range Weather Forecasts (2013) Cycle 40r1 (Eur Cent Medium-range Forecasts, Reading, UK). Available at www.ecmwf.int/en/forecasts/ documentation-and-support/changes-ecmwf-model/cycle-40r1/cycle-40r1. Accessed September 15, 2016.
16. Lindzen RS, Fox-Rabinovitz M (1989) Consistent vertical and horizontal resolution.
Mon Weather Rev117(11):2575–2583.
17. National Weather Service (2002) Changes to the horizontal and vertical reso-lution of the NCEP global forecast systems (Natl Weather Serv, Silver Spring, MD), TIN 02-12.
18. European Centre for Medium-range Weather Forecasts (2006) Cycle 30r1summary of changes (Eur Cent Medium-range Forecasts, Reading, UK). Available at www.ecmwf. int/en/forecasts/documentation-and-support/evolution-ifs/cycles/cycle-30r1summary-changes. Accessed September 15, 2016.
19. European Centre for Medium-range Weather Forecasts (2010) Cycle 36r1summary of changes (Eur Cent Medium-range Forecasts, Reading, UK). Available at www.ecmwf. int/en/forecasts/documentation-and-support/evolution-ifs/cycles/cycle-36r1-summary-changes. Accessed September 15, 2016.
20. Berg R (2015)Hurricane Joaquin Tropical Cyclone Report(Natl Hurricane Cent, Miami), Rep. AL112015.
Tr ack Err o r (NM) 0 12 24 36 48 60 72 84 96 108 120 #CASE 20 19 18 17 16 14 13 12 9 8 7 900 720 540 360 180 0
Forecast Lead Time (hr)
L061
L096
L113
L121
Fig. 6. Track forecast errors as a function of forecast lead time for HWRF experiments L061, L096, L113, and L121. EARTH, ATMOSPHERIC, AND PLANETARY SCIENCES