2007–08 National Postsecondary
Student Aid Study (NPSAS:08)
Full-scale Methodology Report
Technical Report
2007–08 National Postsecondary
Student Aid Study (NPSAS:08)
Full-scale Methodology Report
Technical Report
Dec
ember 2010
Melissa Cominole John Riccobono Peter Siegel Lesa Caves RTI International Tracy Hunt-White Project OfficerNational Center for Education Statistics
Secretary
Institute of Education Sciences
John Easton
Director
National Center for Education Statistics
Stuart Kerachsky
Acting Commissioner
The National Center for Education Statistics (NCES) is the primary federal entity for collecting, analyzing, and reporting data related to education in the United States and other nations. It fulfills a congressional mandate to collect, collate, analyze, and report full and complete statistics on the condition of education in the United States; conduct and publish reports and specialized analyses of the meaning and significance of such statistics; assist state and local education agencies in improving their statistical systems; and review and report on education activities in foreign countries.
NCES activities are designed to address high-priority education data needs; provide consistent, reliable, complete, and accurate indicators of education status and trends; and report timely, useful, and high-quality data to the U.S. Department of Education, the Congress, the states, and other education policymakers, practitioners, data users, and the general public.
We strive to make our products available in a variety of formats and in language that is appropriate to a variety of audiences. You, as our customer, are the best judge of our success in communicating information effectively. If you have any comments or suggestions about this or any other NCES product or report, we would like to hear from you. Please direct your comments to
NCES, IES, U.S. Department of Education 1990 K Street NW
Washington, DC 20006-5651
November 2010
The NCES Home Page address is http://nces.ed.gov.
The NCES Publications and Products address is
This publication is only available online. To download, view, and print the report as a PDF file, go to the NCES World Wide Web Publications and Products address shown above.
This report was prepared for the National Center for Education Statistics under Contract No. ED-05-CO-0033 with RTI
International. Mention of trade names, commercial products, or organizations does not imply endorsement by the U.S. Government.
Suggested Citation
Cominole, M., Riccobono, J., Siegel, P., and Caves, L. (2010). 2007–08 National Postsecondary Student Aid Study (NPSAS:08) Full-scale Methodology Report (NCES 2011-188). U.S. Department of Education. Washington, DC: National Center for Education Statistics. Retrieved [date] from http://nces.ed.gov/pubsearch
Content Contact . Aurora D’Amico (202) 502–7334 (202) 502-7334
Executive Summary
Introduction
The 2007–08 National Postsecondary Student Aid Study (NPSAS:08), conducted for the U.S. Department of Education’s National Center for Education Statistics (NCES), has collected comprehensive data on how students and their families pay for postsecondary education. The first NPSAS study was conducted in 1986–87 to meet the need for national-level data about significant financial aid issues. Since 1987, NPSAS has been conducted every 3 to 4 years, the last cycle, NPSAS:04, having been conducted during the 2003–04 academic year. The primary objective of NPSAS:08 is to produce reliable national estimates of characteristics related to financial aid for postsecondary students at both the undergraduate and graduate levels.
NPSAS:08 served as the base year of data collection for the Baccalaureate and Beyond Longitudinal Study (B&B). The B&B series provides a longitudinal study of the education, work, financial, and personal experiences of students who have completed a bachelor’s degree at a given point in time. To be eligible for the B&B:08 cohort, a student must have met the requirements to complete a bachelor’s degree between July 1, 2007, and June 30, 2008. A cohort of baccalaureate recipients was identified as part of NPSAS:08, and the B&B study will collect further data from them in 1 year (2009) and again in 4 years (2012).
A field test study was conducted for the purpose of testing the procedures planned for the full-scale NPSAS:08 study. NPSAS:08 included a new set of interview items to obtain baseline measures of the awareness of two new federal grants—the Academic Competitiveness Grant (ACG) and the National Science and Mathematics Access to Retain Talent (SMART) Grant—introduced in 2006. In addition, NPSAS:08 introduced the use of the Virtual Call Center. This supplement to the call center allowed interviewers to conduct telephone interviews from their homes, while it increased the telephone interviewing capacity for NPSAS:08.
The NPSAS:08 sample was designed to provide state-level representative estimates for undergraduate students within four degree-granting institutional sectors in six states: (1) public 2-year institutions; (2) public 4-2-year institutions; (3) private, not-for-profit 4-2-year institutions; and (4) private, for-profit institutions. The six states included in this sample were California, Georgia, Illinois, New York, Minnesota, and Texas.
This report details the methodological procedures and results from NPSAS:08. The full-scale study was conducted by RTI International (RTI), with assistance from MPR Associates, Inc. (MPR), for NCES of the U.S. Department of Education, Washington, DC, as authorized by the Higher Education Act of 2008, 20 U.S.C. § 1015 (2008).
Sample Design
The full-scale NPSAS:08 was based on a sample of all students enrolled in eligible postsecondary institutions throughout the United States and Puerto Rico during the 2007–08
academic year. 1 The institutional sample drew from all sectors—public, private not-for-profit, and
private for-profit institutions at the 4-year, 2-year, and less-than-2-year levels. Additionally, the sample included state-representative samples for six states. To prevent an institution from being selected into both the field test and full-scale samples, both samples were selected at the same time, before the field test study. For the institutional sample, 1,960 institutions were selected.2 Of these
institutions, 1,940 were found to be eligible for NPSAS:08. Institutions were asked to provide enrollment lists for the purpose of selecting the student sample. Enrollment lists were obtained from 1,730 of the eligible institutions (90 percent, weighted).
The student sample was selected on a flow basis as the lists were received from institutions. Of the 137,800 students initially sampled, 132,800 were determined to be eligible for participation in NPSAS:08. The eligible sample included 84,240 (96 percent) sample members from public
institutions; 16,610 (95 percent) from private, for-profit institutions; and 31,950 (97 percent) from private, not-for-profit institutions. On the basis of information from responding institutions provided by their enrollment lists, approximately 89 percent (118,610) of the eligible sample were classified as undergraduates; 11 percent (14,190) were classified as graduate or first-professional students (on the basis of enrollment list classification).3
Instrumentation
Computer-Assisted Data Entry Instrument
A web-based computer-assisted data entry (CADE) software system was used for the
abstraction, or collection, of student records from institutions. The CADE system consisted of eight sections: contact information, tuition, need analysis, enrollment, undergraduate admissions,
demographics, financial aid awarded, and institutional student information records. Before
institutions were allowed to enter administrative record data for study respondents, records for all students sampled from that institution were requested from the U.S. Department of Education’s Central Processing System (CPS), which maintains financial aid application data. This information was preloaded into the CADE system to provide edit checks for the data entered by the institution.
Student Interview
The NPSAS:08 full-scale student interview was designed as a web-based instrument to be used for both web and telephone respondents. This design required that several important features be embedded in the instrument, such as extensive help text to assist respondents and warnings to alert them when a response fell outside a predetermined range of likely responses.
The interview consisted of seven sections grouped by topic. The first section determined student eligibility for the NPSAS:08 study, gathered information needed to identify respondents who might be eligible for further follow-up in B&B, and obtained enrollment information for the 2007–
1 To be considered eligible to participate in NPSAS:08, an institutions had to have met the following qualifications: offered an
educational program designed for persons who had completed secondary education; offered at least one academic, occupational, or vocational program of study lasting at least 3 months or 300 clock hours; offered courses open to persons other than the employees or members of the company or group (e.g., union) that administered the institution; been located in the 50 states, the District of Columbia, or Puerto Rico; been other than a U.S. Service Academy; and signed a Title IV participation agreement with the U.S. Department of Education.
2 The numbers appearing in the tables and text of this report have been rounded to the nearest tens to maintain the confidentiality of
study respondents; however, percentages are based on unrounded numbers.
3 A first-professional student is a student who is enrolled in one of the following degree programs: chiropractic, dentistry, law,
08 school year. The second section elicited information about educational experiences, such as languages studied, distance-education courses, and transfer credit history. The third section asked about financial aid and student expenses. Included in this section were items about aid-based employment at the NPSAS institution, such as work-study jobs, assistantships, and fellowships, as well as the new ACG and SMART Grant items. The fourth section focused on non-aid-based employment and personal finances. The fifth section gathered background and demographic information about sample members and their families. The sixth section, administered only to potentially eligible B&B students, addressed future plans in terms of postgraduation employment, education, and teaching. The final section requested contact information from potentially eligible B&B sample members for the follow-up longitudinal studies.
Data Collection Design and Outcomes
Training
Training programs were developed for different types of project staff: institutional coordinators, help desk agents, telephone interviewers, tracers, and supervisors. All interviewing staff received a general training on telephone interviewing techniques. Help desk agents received specific training on frequently asked questions about the study, instrument, and technical issues related to completion of the instrument on the Web. Help desk agents were also trained how to conduct the student interview when requested to do so by sample members. Programs on successfully locating and interviewing sample members were developed for all telephone
interviewers. Topics covered in telephone interviewer training included administrative procedures required for case management; quality control of interactions with sample members, parents, and other contacts; the purpose of NPSAS:08 and the uses of the data to be collected; and the organization and operation of the web instrument to be used in data collection. Tracers received specialty training on how to use specific locating databases and tools to find hard-to-reach sample members. Supervisors received the same training that help desk agents and telephone interviewers received, together with additional sessions related to project administration and supervision.
Institutional Contacting
Once institutions were sampled, attempts were made to contact the chief administrator of each institution (e.g., the president or the chancellor) to verify institutional eligibility, solicit
participation, and request the appointment of an institutional coordinator to oversee data collection within the institution. Institutional coordinators were asked to provide lists of all eligible students enrolled at any time between July 1, 2007, and June 30, 2008.4 Several quality checks of the lists were
implemented before students from each institution were sampled. Of the 1,960 eligible institutions sampled, 1,730 provided lists, which resulted in an overall institutional participation rate of 90 percent (weighted).
4 In order to be considered eligible to participate in NPSAS:08, a student had to have attended a NPSAS-eligible institution during the
2007–08 academic year and to have met these further requirements: enrolled in either (1) an academic program or at least one course for credit that could be applied toward fulfilling the requirements for an academic degree, or (2) an occupational or vocational program that required at least 3 months or 300 clock hours of instruction to receive a degree, certificate, or other formal award; not been concurrently enrolled in high school; and not been enrolled solely in a General Educational Development (GED) or other high
Institutional Record Abstraction
Institutions could choose from among three modes for student record abstraction: (1) self-CADE, by which institutional staff entered data directly into the web-based CADE system; (2) data-CADE, by which institutional staff provided student record information in data file uploads
according to specifications; and (3) field-CADE, by which trained field data collectors used laptops to abstract student record data into the CADE system. Nearly two-thirds of institutions (63 percent) chose to submit student data by self-CADE. About 36 percent of institutions submitted student records by data-CADE. Approximately 1 percent of institutions submitted their data by field-CADE. Of the 1,940 eligible and participating institutions, about 1,670 institutions provided institutional record information for about 130,410 students. Approximately 126,620 of the CADE student records received were considered complete student records. The institution- and student-level weighted response rates for record abstraction were both 96 percent.
Student Locating and Interviewing
The NPSAS:08 data collection design involved initial locating of sample members, providing an opportunity for the student to complete the web interview, following up with web
nonrespondents after 3 weeks, and attempting to conduct a telephone interview with them, if necessary. Upon receipt of student enrollment lists, batch-locating activities were implemented to update address and telephone information. Sources for this task included the CPS, the U.S. Postal Service National Change of Address system, and Telematch (after batch locating). Students were sent a notification mailing containing an initial letter, informational brochure, and username and password for completing the interview via the Web. Telephone contacting began for web nonrespondents 3 weeks after the initial mailing.
Telephone interviewers’ locating and tracing activities coincided with efforts to gain cooperation from sample members. Any case for which the interviewer had exhausted all tracing options and was unable to gain any contact with the sample member was sent to RTI’s Tracing Operations Unit (TOPS). Telephone interviewers followed up with cases for which TOPS had obtained further contact information. Sample members for whom no additional information could be obtained were determined to be final unlocatable sample members.
Student data collection consisted of three phases. The first, the early response phase, paid a $30 incentive to sample members who completed the web interview or called in to complete a telephone interview during the first 3 weeks of data collection. Approximately 48 percent of completed interviews were obtained during this phase. In the second phase of data collection, production interviewing, interviewers made outbound calls to complete telephone interviews. No incentives were offered during production interviewing, which accounted for 11 percent of all completed interviews. The third phase of data collection, the nonresponse-conversion phase,
focused on obtaining interviews from sample members who had refused to participate, were hard to reach, or had insisted on receiving the incentive before completing the interview. Sample members who completed an interview during this phase of data collection received an incentive of $30. About 41 percent of completed interviews were completed during the nonresponse-conversion phase.
Of the approximately 132,800 eligible sample members, 95,360 (71 percent, weighted) completed the student interview. Of these sample members, 18,010 were identified as baccalaureate recipients during the NPSAS year and therefore eligible for inclusion in the B&B:08 cohort. On average, students spent about 26 minutes completing the interview. Web respondents were able to
complete the interview in approximately 25 minutes, while telephone respondents completed the interview in about 29 minutes.
Study Respondents
Key variables were identified across the various data sources to determine the minimum requirements to support the analytic needs of the study. Sample members who met these minimum requirements were classified as study respondents. To be a study respondent, a sample member had to have data for three critical variables—student type (undergraduate, graduate, or first-professional student), gender, and date of birth. In addition, sample members had to have data—from any source—for at least 8 variables out of a set of 15 additional prespecified variables. These variables include dependency status, income, expected family contribution (EFC), class level, and race. About 127,700 of 132,800 eligible sample members (96 percent) were classified as NPSAS:08 study
respondents. For most study respondents (approximately 88 percent), data were available from at least two of the major data sources (e.g., student interview, institutional student records, or the CPS).
Evaluation of Operations and Data Quality
Evaluations of operations and procedures focused on the timeline for data collection from both institutions (CADE) and students (web and telephone interviews), tracing and locating procedures, refusal-conversion efforts, the effectiveness of incentives for increasing early response via the Web and for refusal conversion, and the length of the student interview. Evaluations of data quality included an examination of items with high rates of missing data, the accuracy of data collected in coding systems, use of online help text, item-level nonresponse-conversion efforts, and question delivery and data-entry quality control procedures.
Analysis Weights
Cross-sectional weights were developed for student-level analyses. Analysis strata and PSUs were created to allow for variance estimation using the Taylor series procedure, and bootstrap replicate weights were computed to allow for variance estimation using the bootstrap technique. Weighted response rates, nonresponse bias analyses, and survey design effect tables are reported.
Data Files
The final data files are available as a set of restricted research files, which are fully
documented by an electronic codebook (ECB), and as a public release Data Analysis System (DAS), which also contains full documentation.5
5 The ECB and DAS are both fully documented software products available from NCES. The DAS is available online at
The first NPSAS:08 DAS was adjudicated and approved for public release in April 2009. The primary analysis file contains data for 127,700 study
Products
• The Profile of Undergraduates in U.S. Postsecondary Education Institutions: 2007–08 will describe the demographic and enrollment characteristics of undergraduate students.
• Student Financing of Undergraduate Education: 2007–08 will address undergraduate tuition, total price of attendance, types and sources of financial aid received, net price, financial aid need, and unmet need.
• Student Financing of Graduate and First-Professional Education: 2007–08 will describe the
demographic and enrollment characteristics of graduate and first-professional students, as well as the types and sources of financial aid received.
• 2007–08 National Postsecondary Student Aid Study (NPSAS:08): Student Financial Aid Estimates
for 2007–08 report is a First Look publication based on the 2007–08 data; it gives the percentages of students receiving various types of financial aid and average amounts received, by type of institution attended, attendance pattern, dependency status, and income level.
• 2007–08 National Postsecondary Student Aid Study (NPSAS:08):Undergraduate Financial Aid Estimates for 2007–08 by Type of Institution report is the second publication based on the 2007–08 data. This report focuses only on undergraduates and includes separate tables for those who attended public 4-year institutions; those who attended private, not-for-profit 4-year institutions; those who attended public 2-year institutions; and those who attended private, for-profit postsecondary institutions during the 2007–08 academic year. It gives average tuition and fees, average total price of attendance, and the percentages of undergraduates receiving various types and combinations of financial aid, together with average amounts received and with a particular focus on grants and loans.
Foreword
This report describes and evaluates the methods and procedures used in the 2007–08 National Postsecondary Student Aid Study (NPSAS:08). NPSAS:08 included important changes from previous NPSAS cycles. The student sample was augmented to oversample students who had received Academic Competitiveness Grants and SMART Grants. This oversampling permitted inclusion of several new interview items, allowing policymakers to gauge student knowledge about these new grant programs. As did NPSAS:04, NPSAS:08 oversampled institutions in selected states to provide state-level representative data on undergraduate students in four institutional sectors.
We hope that the information provided in this report will be useful to a wide range of interested readers. Additional information about NPSAS:08 is available on the Web at
Tom Weko
Associate Commissioner Postsecondary Studies Division
Acknowledgments
The authors would like to acknowledge the many individuals who participated in the 2007– 08 National Postsecondary Student Aid Study (NPSAS:08). Thanks to all the institutions that participated and, especially, the students who were interviewed by phone and via the Web. This study would have been impossible without their invaluable contributions.
Contents
Executive Summary ... iii
Foreword ... ix
Acknowledgments ... xi
List of Tables ... xvii
List of Figures ...xxi
Chapter 1. Overview ... 1
1.1 Background and Purpose of NPSAS ... 1
1.2 Special Features of NPSAS:08 ... 2
1.2.1 State Representative Sample ... 2
1.2.2 The Academic Competitiveness Grant and the Science and Mathematics Access to Retain Talent Grant ... 2
1.2.3 Virtual Call Center ... 2
1.3 Schedule and Products of NPSAS:08 ... 3
Chapter 2. Design and Methodology ... 5
2.1 Sampling ... 5
2.1.1 Target Population and Sampling Overview ... 5
2.1.2 Institutional Sample and Eligibility ... 14
2.1.3 Student Sample and Eligibility ... 18
2.2 Sources of Data ... 22
2.3 Instrument Development ... 22
2.3.1 Computer-Assisted Data Entry ... 22
2.3.2 Student Interview ... 24
2.3.3 Evaluation of Data Quality ... 27
2.4 Data Collection ... 28
2.4.1 Contacting Institutions ... 28
2.4.2 Student Enrollment List Acquisition ... 32
2.4.3 Administrative Data for Sample Members ... 34
2.4.4 Data Abstraction From Student Records ... 35
2.4.5 Student Interviewing ... 38
2.4.6 Phases of Student Interviewing ... 42
2.4.7 Locating and Contacting Students ... 43
2.5 Systems ... 46
2.5.1 Hatteras and the Instrument Development and Documentation System ... 46
2.5.2 Integrated Management System ... 47
2.5.3 Variable Tracking System ... 48
Chapter 3. Data Collection Outcomes ... 49
3.1 Institutional Participation ... 49
3.1.1 National Institutional Sample ... 49
3.1.2 State Institutional Samples ... 50
3.2.1 National Student Sample ... 52
3.2.2 State Student Samples ... 53
3.3 Data Collection Results ... 55
3.3.1 Student Record Matching ... 55
3.3.2 Student Record Abstraction ... 61
3.3.3 Student Locating and Response Rates ... 64
3.4 Student Locating ... 65
3.4.1 Database Batch Tracing Before Data Collection... 66
3.4.2 Intensive Tracing During Data Collection ... 67
3.5 Interviewing Outcomes... 69
3.5.1 Interview Completion by Data Collection Phase ... 69
3.5.2 Interview Completion by Mode of Administration ... 72
3.6 Completeness of Data Records Among Study Respondents ... 75
Chapter 4. Evaluation of Field Operations and Data Quality ... 77
4.1 Enrollment List Collection ... 77
4.1.1 Early Contacting Activities ... 77
4.1.2 Institutional Participation ... 78
4.1.3 Quality of Enrollment Lists ... 80
4.2 Student Record Abstraction ... 82
4.2.1 Preloading Data Into the Computer-Assisted Data Entry System ... 82
4.2.2 Timeliness of Record Abstraction ... 83
4.2.3 Computer-Assisted Data Entry Data Completeness ... 85
4.3 Student Interviewing ... 86 4.3.1 Timing Analysis ... 86 4.3.2 Call Counts ... 90 4.3.3 Online Coding ... 92 4.3.4 Help Text ... 94 4.3.5 Item Nonresponse ... 96 4.3.6 Conversion Text ... 98 4.3.7 Verification Checks ... 99 4.3.8 Help Desk... 99
4.3.9 Telephone Interviews and Quality Assurance Monitoring ... 100
4.3.10 Virtual Call Center ... 103
4.3.11 Respondent Profiles ... 104
4.4 Identification of the Baccalaureate and Beyond Cohort ... 108
Chapter 5. Variable Construction and File Development ... 111
5.1 Overview of the NPSAS:08 Data Files ... 111
5.2 Online Coding and Verification ... 112
5.2.1 Online Coding ... 112
5.2.2 Range and Consistency Checks ... 113
5.3 Data Editing... 113
5.4 Data Perturbation ... 115
5.5 Statistical Imputations ... 115
Chapter 6. Unit Nonresponse Bias Analyses, Weighting, and Variance Estimation ... 119
6.1 Institution Nonresponse Bias Analysis and Weighting ... 121
6.1.1 Initial Institution Weight Components ... 121
6.1.2 Assessing Institution Nonresponse Bias ... 122
6.1.3 Adjusting Institution Weights... 124
6.1.4 Institution Weighting Adjustment Performance ... 131
6.2 Student Nonresponse Bias Analysis and Weighting ... 132
6.2.1 Initial Student Weight Components ... 132
6.2.2 Assessing Student Nonresponse Bias... 136
6.2.3 Adjusting Student Weights ... 137
6.2.4 Student Weighting Adjustment Performance ... 158
6.3 Item Nonresponse Bias Analysis ... 159
6.4 Variance Estimation ... 174
6.4.1 Taylor Series ... 175
6.4.2 Bootstrap Replicate Weights ... 175
6.4.3 Variance Approximation ... 178
References... 179 Appendixes
A Technical Review Panel ... A-1 B Sampling Details ... B-1 C Facsimiles ... C-1 D NPSAS:08 Endorsements ... D-1 E Data Collection Materials ...E-1 F DataCADE Specifications ... G-1 G Training Materials ... F-1 H Imputations ... H-1 I Analysis Variables ... I-1 J Generalized Exponential Model Adjustment Procedure ... J-1 K Nonresponse Bias Analysis ... K-1 L Weighted-Analysis Considerations ... L-1 M Design Effects... M-1
List of Tables
1. Start and end dates for major NPSAS:08 activities ... 3 2. Target numbers of sample students, by institutional stratum and student type:
2008 ... 12 3. Target numbers of sample students in the six state-representative samples, by
institutional stratum and type of student: 2008 ... 13 4. Institutional sampling rates and number of certainty and noncertainty institutions
sampled, by institutional stratum: 2008 ... 17 5. Planned and achieved NPSAS:08 student samples, by student stratum and
institution level: 2008 ... 20 6. Initial classification of NPSAS:08 student sample, by institutional characteristics
and student type: 2008 ... 21 7. Summary of NPSAS:08 evaluations: 2008 ... 28 8. NPSAS:08 training sessions for interviewing and tracing staff: 2008 ... 38 9. Numbers of sampled, eligible, and participating institutions and enrollment list
participation rates, by institutional characteristic: National sample: 2008 ... 50 10. Numbers of sampled, eligible, and participating institutions and enrollment list
participation rates, by institutional characteristic: State samples: 2008 ... 51 11. Numbers of sampled and eligible students and response rates, by institutional
characteristic: National sample: 2008 ... 53 12. Numbers of sampled, eligible undergraduate students and response rates, by
institutional characteristic: State samples: 2008 ... 54 13. Results of Central Processing System matching for 2007–08 and 2008–09, by
institutional characteristic and student type: 2008 ... 57 14. Results of National Student Loan Data System matching, by institutional
characteristic and student type: 2008 ... 58 15. Results of National Student Clearinghouse matching, by institutional
characteristic and student type: 2008 ... 59 16. Results of ACT and SAT Reasoning Test matching, by institutional characteristic
and student type: 2008 ... 60 17. Student record abstraction method: 2008 ... 61 18. Institution-level computer-assisted data entry completion rates, by institutional
characteristic and abstraction method: 2008 ... 62 19. Student-level computer-assisted data entry completion rates, by institutional
characteristic and student type: 2008 ... 63 20. Student locating, by institutional characteristic and student type: 2008 ... 66 21. Batch processing record match rates, by tracing source: 2008 ... 67
22. Students requiring intensive tracing, by institutional characteristic and student
type: 2008 ... 68 23. Locate and interview rates, by intensive tracing efforts: 2008 ... 68 24. Student interview completion results, by institutional characteristic and student
type: 2008 ... 69 25. Student interview response rates, by data collection phase, and by institution
characteristic and student type: 2008 ... 70 26. Results of prompting during the early response phase of data collection: 2008 ... 72 27. Student interview completion rates: 2008 ... 73 28. Student interview completion rates by mode of completion, and by institutional
characteristic and student type: 2008 ... 74 29. Data completeness for NPSAS:08 study respondents, by data source: 2008 ... 75 30. Cumulative flow of enrollment list receipt: 2004 and 2008 ... 77 31. NPSAS:08 institutional enrollment list participation, by prior NPSAS
participation: 2008 ... 78 32. Distribution of participating NPSAS:08 institutions, by 2005 Carnegie
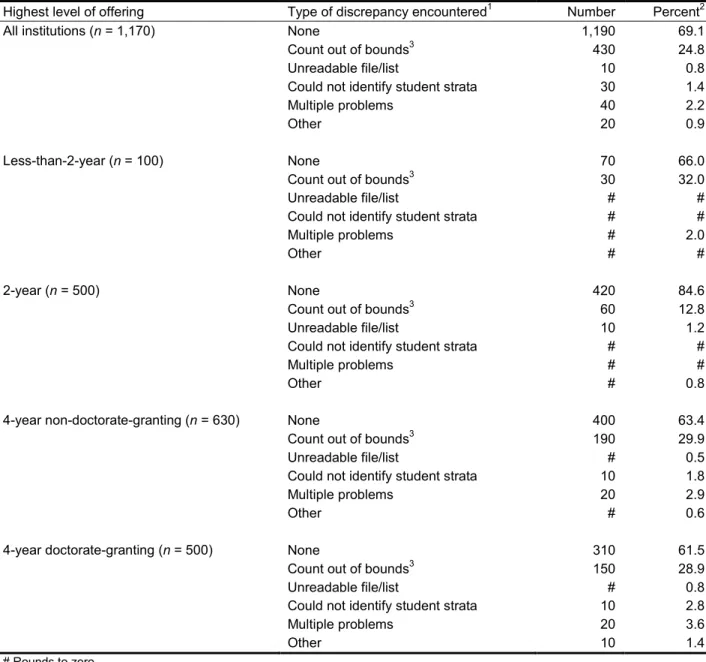
institutional classification: 2008 ... 79 33. NPSAS:08 participation of Historically Black Colleges and Universities: 2008 ... 80 34. Types of discrepancies encountered with student enrollment lists, by highest
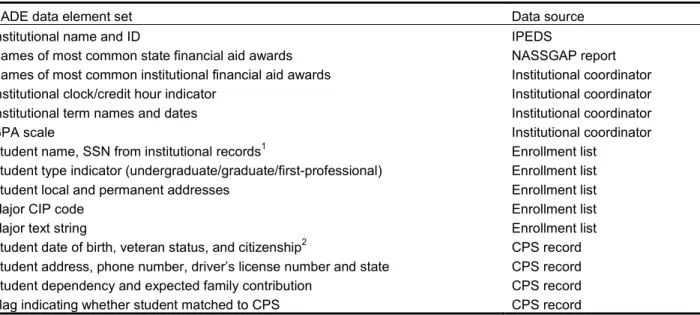
level of offering: 2008 ... 81 35. Source of data elements preloaded into the computer-assisted data entry system:
2008 ... 83 36. Computer-assisted data entry item-level completion rates, by method of
abstraction: 2008 ... 86 37. Average interview time, by mode of administration: 2008 ... 87 38. Average time to complete the NPSAS student interview, by interview section and
completion mode: 2008 ... 88 39. Average time to complete the education experiences section, by student type:
2008 ... 88 40. Average time to complete the current employment section, by employment
status: 2008 ... 89 41. Average time to complete the web student interview, by web connection type:
2008 ... 90 42. Call counts, by interview status and mode of completion: 2008 ... 91 43. Call counts, by institutional characteristic and student type: 2008 ... 92 44. Interview items with high rates of help text access, by mode of administration:
2008 ... 95 45. Item nonresponse for interview items with more than 10 percent of data missing,
46. Conversion rates for critical items, by type of response: 2008 ... 98
47. Help desk incident type: 2008... 100
48. Characteristics of interview respondents, by data collection phase: 2008 ... 105
49. Characteristics of interview respondent, by completion type: 2008 ... 106
50. Characteristics of interview respondent, by completion mode: 2008 ... 107
51. Characteristics of interview respondent, by language of interview administration 2008 ... 108
52. Baccalaureate determination, by student type: 2008 ... 109
53. Description of codes for missing data: 2008 ... 113
54. Summary of institution nonresponse bias analysis, by type of institution: 2008 ... 124
55. Weight adjustment factors for institution poststratification: 2008... 125
56. Weight adjustment factors for institution nonresponse adjustment: 2008 ... 127
57. Institution weight distribution and unequal weighting effects, by type of institution: 2008 ... 131
58. Weight adjustment factors for unknown student eligibility status: 2008 ... 134
59. Weight adjustment factors for student location nonresponse adjustment: 2008 ... 139
60. Weight adjustment factors for student refusal and other nonresponse adjustment: 2008 ... 143
61. Weight adjustment factors for student poststratification: 2008 ... 150
62. Student weight distribution and unequal weighting effects: 2008 ... 158
63. Summary of weighted item response rates for all students and by type of institution: 2008 ... 161
List of Figures
1. Sequence of NPSAS:08 sampling operations: 2008 ... 8 2. NPSAS:08 student sampling strata: 2008 ... 11 3. Structure and content of computer-assisted data entry student record abstraction
instrument: 2008 ... 24 4. Structure and flow of the NPSAS:08 student interview: 2008 ... 25 5. The NPSAS:08 institutional website home page: 2008 ... 30 6. NPSAS:08 web-CADE main menu: 2008 ... 37 7. NPSAS:08 student website: 2008 ... 40 8. Data collection phases for NPSAS:08: 2008 ... 43 9. NPSAS:08 data collection plan: 2008 ... 44 10. NPSAS:08 student locating results: 2008 ... 64 11. Percentage distribution of interview completions, by data collection phase: 2008 ... 71 12. Cumulative flow of computer-assisted data entry completions: 2004 and 2008 ... 84 13. Cumulative flow of computer-assisted data entry completions, by abstraction
mode: 2008 ... 84 14. Recode results for major field of study, by completion mode: 2008 ... 93 15. Upcode results, by coding system and completion mode: 2008... 94 16. Pop-up message displayed after three consecutive blank screens: 2008 ... 99 17. Question delivery error rates, by week: 2008 ... 101 18. Data entry error rates, by week: 2008 ... 102 19. Receiver Operating Characteristic curve for overall institution response
propensity: 2008... 132 20. Receiver Operating Characteristic curve for overall student response propensity:
Chapter 1.
Overview
This report describes the methods and results for the 2007–08 National Postsecondary Student Aid Study (NPSAS:08). The 2008 study was conducted for the National Center for
Education Statistics (NCES), U.S. Department of Education, Washington, DC, as authorized by the Higher Education Act of 2008, 20 U.S.C. § 1015 (2007). Previous cycles of NPSAS, as well as two longitudinal studies deriving from it—the Beginning Postsecondary Students Longitudinal Study (BPS) and the Baccalaureate and Beyond Longitudinal Study (B&B)—are authorized by the following legislation:
• the Higher Education Act of 1965, as amended by the Higher Education Opportunity Act of 2008, 20 U.S.C. § 1015 (2008);
• the General Education Provisions Act, as amended, 20 U.S.C. §§ 9541 to 9548 (2007);
• the Higher Education Act of 1965, as amended by the Higher Education Amendments of 1986, 20 U.S.C. § 1070 et seq. (2007); and
• the National Education Statistics Act of 1994, as amended, 20 U.S.C. §§ 9541 to 9547 and 9573 (2007).
1.1 Background and Purpose of NPSAS
NPSAS is a comprehensive, nationwide study to determine how students and their families pay for postsecondary education; it features a nationally representative sample of U.S. students (aided and nonaided) in postsecondary education institutions. The sample comprises undergraduate, graduate, and first-professional students. These students attend all kinds of institutions, including public and private institutions, for-profit and not-for-profit institutions, and less-than-2-year institutions to 4-year colleges and universities.
The first NPSAS was conducted during the 1986–87 school year to meet the need for nationally representative data about significant postsecondary financial aid issues. NPSAS has been conducted every 3 to 4 years since 1987. Prior to the current cycle, the most recent NPSAS was conducted during the 2003-04 academic year. Beginning in 1990, each NPSAS data collection has provided base-year data for either the BPS or the B&B longitudinal study. NPSAS:08 serves as the base-year study for B&B. B&B eligible students were surveyed again in 2009, and it is anticipated they will be surveyed again in 2012.
The main objective of NPSAS is to produce reliable national estimates of characteristics related to financial aid for postsecondary students. No other single national database contains student-level records for students receiving financial aid from the many varied programs funded by the federal government, the states, postsecondary institutions, employers, and private organizations. The study addresses two questions with important policy implications for financial aid programs:
• How do students and their families finance postsecondary education?
• Who applies for and who receives aid?
This report describes the data collection plan, outcomes, and analysis for NPSAS:08. All procedures and methods were developed in consultation with a Technical Review Panel composed
of experts in higher education (appendix A). Chapter 2 describes the study design and data
collection methods. Chapter 3 presents the overall outcomes of the several stages of data collection. Chapter 4 presents the results of data-quality analysis, with procedural and methodological
evaluations. Chapter 5 delineates procedures used in variable construction and data file preparation. Chapter 6 presents the nonresponse bias analyses, weighting procedures, and variance estimation. Materials used during the study are provided as appendixes to the report and cited in the text where appropriate.
All analyses conducted to evaluate the effectiveness of the NPSAS:08 procedures are discussed. Unless otherwise indicated, a probability level of .05 was the criterion in all tests of significance. Throughout the report, numbers of sample institutions and students have been rounded to ensure the confidentiality of individual student data; therefore, row and column entries in tables may not sum to their respective totals, and reported percentages (which were calculated from unrounded numbers) may differ somewhat from those that would result from these rounded numbers.
1.2 Special Features of NPSAS:08
1.2.1 State Representative Sample
As with NPSAS:04, NPSAS:08 oversampled institutions in selected states to provide state-level representative data on undergraduate students in four institutional sectors (public 4-year, public 2-year, private not-for-profit 4-year, and private for-profit 4-year). The states included in the
NPSAS:08 augmentation were California, Georgia, Illinois, Minnesota, New York, and Texas. The decision to include a six-state representative sample was made after the initial NPSAS:08 field test and full-scale institutional samples had been selected; the full-scale institutional sample was therefore augmented to allow the data to be representative at the state level.
1.2.2 The Academic Competitiveness Grant and the Science and Mathematics Access to Retain Talent Grant
A special set of items was included in the NPSAS:08 student interview to ascertain students’ knowledge of the Academic Competitiveness Grant (ACG) and the Science and Mathematics Access to Retain Talent (SMART) Grant. These two grant programs were introduced by the federal
government in 2006. Respondents who were eligible to receive these grants were asked whether they were aware of them. Those respondents who knew of them were then asked a series of questions related to the grants. To ensure that a sufficient number of students would provide responses to this set of questions, the NPSAS:08 student sample was augmented to include additional students who each received either an ACG or a SMART Grant. These data will provide researchers with baseline measures about students’ knowledge of these new grant programs.
1.2.3 Virtual Call Center
Another important change in NPSAS:08 was the introduction of the Virtual Call Center (VCC) to supplement the on-site call center. Although all previous studies conducted telephone interviewing solely in an on-site call center, the introduction of new technology allowed telephone interviewers to accomplish securely and remotely, from their homes, the same tasks that were accomplished solely in the call center (e.g., help desk, prompting, locating, and interviewing). A subset of telephone interviewers conducted outbound telephone interviewing, remotely from their
homes. This innovation made data collection more efficient because it increased interviewing capacity without requiring call center expansion.
1.3 Schedule and Products of NPSAS:08
This section presents the schedule for the major activities for the full-scale study (table 1) and describes the publications that will be available.
Table 1. Start and end dates for major NPSAS:08 activities
Activity Start date1 End date2
Select institutional sample3 10/3/2005 9/21/2007
Mail information and make phone contact with chief administrator 9/24/2007 11/16/2007
Mail information and make phone contact with institutional coordinator 10/2/2007 12/20/2007
Obtain enrollment lists for student sampling 1/14/2008 7/15/2008
Select student samples 1/15/2008 7/15/2008
Request/obtain CPS data 1/16/2008 8/29/2008
Receive list of SMART Grant/ACG recipients 1/10/2008 1/10/2008
Preload CPS data into CADE records 2/1/2008 7/22/2008
Conduct CADE record abstraction 2/1/2008 9/19/2008
Conduct student interviews
Web 3/10/2008 9/29/2008
Telephone 3/31/2008 9/29/2008
1 Date the activity was initiated for the first applicable school or its associated students. 2 Date the activity was completed for the last applicable school or its associated students.
3 The NPSAS:08 field test and full-scale institutional samples were selected at the same time to prevent institutions being selected for both samples. Prior to the start of full-scale data collection in spring 2007, the sample was freshened with 2005–06 IPEDS data to ensure that all potentially eligible institutions were included. Finally, in fall 2007, the sample was augmented to include additional institutions for the six-state augmentation; consequently, approximately 20 institutions were included in both samples.
NOTE: ACG = Academic Competitiveness Grant; CADE = computer-assisted data entry; CPS = Central Processing System; IPEDS = Integrated Postsecondary Education Data System SMART = Science and Mathematics Access to Retain Talent.
SOURCE: U.S. Department of Education, National Center for Education Statistics, 2007–08 National Postsecondary Student Aid Study (NPSAS:08).
Reports based on NPSAS:08 will be published as follows:
• The Profile of Undergraduates in U.S. Postsecondary Education Institutions: 2007–08 will describe the demographic and enrollment characteristics of undergraduate students.
• Student Financing of Undergraduate Education: 2007–08 will address undergraduate tuition, total price of attendance, types and sources of financial aid received, net price, financial aid need, and unmet need.
• Student Financing of Graduate and First-Professional Education: 2007–08 will describe the
demographic and enrollment characteristics of graduate and first-professional students, as well as the types and sources of financial aid received.
The following, together with the Data Analysis System (DAS), are available on the NCES website at http://nces.ed.gov/
• 2007–08 National Postsecondary Student Aid Study (NPSAS:08): Student Financial Aid Estimates
for 2007–08 report is a First Look publication based on the 2007–08 data; it gives the :
percentages of students receiving various types of financial aid and average amounts received, by type of institution attended, attendance pattern, dependency status, and income level.
• 2007–08 National Postsecondary Student Aid Study (NPSAS:08): Undergraduate Financial Aid Estimates for 2007–08 by Type of Institution report is the second publication based on the 2007–08 data. This report focuses only on undergraduates and includes separate tables for those who attended public 4-year, those who attended private not-for-profit 4-year, those who attended public 2-year, and those who attended private for-profit postsecondary institutions during the 2007–08 academic year. It gives average tuition and fees, average total price of attendance, and the percentages of undergraduates receiving various types and combinations of financial aid, together with average amounts received and with a particular focus on grants and loans.
• 2007–08 National Postsecondary Student Aid Study (NPSAS:08): Undergraduate Data Analysis
System (NPSAS:08 Undergraduate DAS) contains the data on a sample of about 114,000 undergraduates who were enrolled at any time between July 1, 2007, and June 30, 2008, in about 1,730 postsecondary institutions. The data represent all undergraduate students enrolled in postsecondary institutions in the 50 states, the District of Columbia, and Puerto Rico that were eligible to participate in the federal financial aid programs under Title IV of the Higher Education Act.
• 2007–08 National Postsecondary Student Aid Study (NPSAS:08): Graduate Data Analysis System (NPSAS:08 Graduate DAS) contains the data on a sample of about 14,000 graduate students who were enrolled at any time between July 1, 2007, and June 30, 2008, in about 1,730 postsecondary institutions. The data represent all graduate students enrolled in postsecondary institutions in the 50 states, the District of Columbia, and Puerto Rico that were eligible to participate in the federal financial aid programs under Title IV of the Higher Education Act.
To access the NPSAS:08 DAS application or one of the NPSAS:08 reports, contact Aurora
D’Amico, or visit the website at
Aurora D’Amico
Postsecondary Studies Division
National Center for Education Statistics 1990 K Street NW
Washington, DC 20006-5652 (202) 502-7334
Analysts can also use the QuickStats system to generate simple tables and graphs quickly using the NPSAS:08 data. To access this system, visit the website at
DASs, as well as the associated electronic codebooks and file documentation, are available to researchers who have obtained a restricted data license from NCES. Information on the NCES Statistical Standards Program, including Restricted Use Data Licenses Procedures, is available from
the NCES website:
data license may be found in the NCES Restricted-Use Data Procedures Manual (U.S. Department of
Chapter 2.
Design and Methodology
This chapter describes in detail the design and methods implemented for the 2007–08 National Postsecondary Student Aid Study (NPSAS:08). First, the two-stage sampling design is described. The content and design of the computer-assisted data entry (CADE) and student instruments are then explained, followed by the data collection process. The steps involved in contacting, locating, and interviewing sample members are next delineated, and the chapter concludes with a description of the data collection systems.
2.1 Sampling
2.1.1 Target Population and Sampling Overview
The NPSAS:08 target population consisted of all eligible students enrolled at any time between July 1, 2007, and June 30, 2008, in eligible postsecondary institutions in the United States or Puerto Rico. For institutions to be eligible for the study, they had to have signed Title IV
participation agreements with the U.S. Department of Education, making them eligible for federal student aid programs. For students to be eligible for the study, they had to have been
• enrolled in an academic program or taken at least one course for credit applicable toward an academic degree, or
• enrolled in an occupational or vocational program that required at least 3 months or 300 clock hours of instruction for receipt of a degree, certificate, or other formal award. Students were ineligible if they were concurrently enrolled in high school or enrolled solely in a General Educational Development (GED) program or other high school completion program.
The institutional sampling frame for NPSAS:08 was constructed from the 2004–05 Integrated Postsecondary Education Data System (IPEDS:2004–05) Institutional Characteristics, Fall Enrollment, and Completions files. The IPEDS data used for the initial sampling frame were collected in 2005; the IPEDS data used for sample freshening, in 2007.6
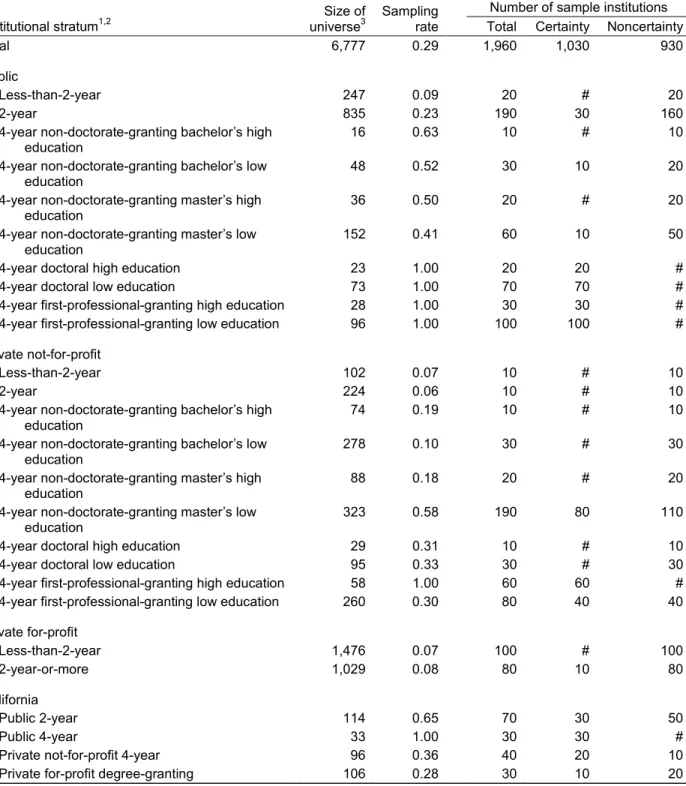
The remaining institutions in the sampling frame were partitioned into 46 institutional strata based on institutional level and control, highest level of offering, and proportion of bachelor’s degrees awarded in education.
Consequently, any
institutions that came into existence or became eligible between the IPEDS data collections in 2006 and June 30, 2008, were not included on the sampling frame used for freshening. Ineligible
institutions (e.g., institutions located outside the United States and Puerto Rico, central offices, military academies) were deleted from the sampling frame.
7
6 The process of freshening the sample involved adding a sample of all institutions that became eligible between 2005 and 2006 to the
original institutional sample.
NPSAS:08 also included state-representative undergraduate student samples for four degree-granting institutional sectors in six states: (1) public 2-year institutions; (2) public 4-year institutions; (3) private, not-for-profit 4-year institutions; and (4) private, for-profit
7 The proportion of bachelor’s degrees awarded in education is used to ensure sufficient numbers of sample students receiving a
institutions.8 The 46 institutional strata—22 nationally representative and 24 state representative—
were as follows:
• public less-than-2-year; • public 2-year;
• public 4-year non-doctorate-granting bachelor’s high education; • public 4-year non-doctorate-granting bachelor’s low education; • public 4-year non-doctorate-granting master’s high education; • public 4-year non-doctorate-granting master’s low education; • public 4-year doctoral high education;
• public 4-year doctoral low education;
• public 4-year first-professional-granting high education; • public 4-year first-professional-granting low education; • private not-for-profit less-than-2-year;
• private not-for-profit 2-year;
• private not-for-profit 4-year non-doctorate-granting bachelor’s high education; • private not-for-profit 4-year non-doctorate-granting bachelor’s low education; • private not-for-profit 4-year non-doctorate-granting master’s high education; • private not-for-profit 4-year non-doctorate-granting master’s low education; • private not-for-profit 4-year doctoral high education;
• private not-for-profit 4-year doctoral low education;
• private not-for-profit 4-year first-professional-granting high education; • private not-for-profit 4-year first-professional-granting low education; • private for-profit less-than-2-year;
• private for-profit 2-year-or-more; • California public 2-year;
• California public 4-year;
• California private not-for-profit 4-year; • California private for-profit degree-granting;
8 These six states were selected on the basis of undergraduate enrollment numbers in the four sectors; prior inclusion in the
NPSAS:04 12-state sample, with high levels of cooperation and participation in that survey; and interstate variation or statewide recent changes in tuition and state grant policies, which enable comparative research and analysis. The six states were California, Georgia, Illinois, New York, Minnesota, and Texas.
• Texas public 2-year; • Texas public 4-year;
• Texas private not-for-profit 4-year; • Texas private for-profit degree-granting; • New York public 2-year;
• New York public 4-year;
• New York private not-for-profit 4-year; • New York private for-profit degree-granting; • Illinois public 2-year;
• Illinois public 4-year;
• Illinois private not-for-profit 4-year; • Illinois private for-profit degree-granting; • Georgia public 2-year;
• Georgia public 4-year;
• Georgia private not-for-profit 4-year; • Georgia private for-profit degree-granting; • Minnesota public 2-year;
• Minnesota public 4-year;
• Minnesota private not-for-profit 4-year; and • Minnesota private for-profit degree-granting.
High education refers to the 20 percent of institutions with the highest proportions of their baccalaureate degrees awarded in education (based on the most recent IPEDS Completions file). The remaining 80 percent of institutions are classified as low education, meaning they have a lower proportion of baccalaureate degrees awarded in education. The statistical sampling process for NPSAS:08 comprised four phases (figure 1).
Institutions were selected by means of Chromy’s (1979) sequential probability minimum replacement sampling algorithm, which resembles systematic sampling, to select institutions with probabilities proportional to a composite measure of size based on expected enrollment. Initially a sample of 1,630 institutions was selected in August 2006 so that these institutions could be notified of their selection early and a separate field test sample could be selected from the remaining
institutions on the sampling frame. To keep the sample representative of the population, in July 2007 the sample was freshened to include about 10 newly eligible institutions. In September 2007, after the decision was made to include state-representative undergraduate samples in the six states, a supplemental sample of institutions was selected in these states and added to the existing sample.
Figure 1. Sequence of NPSAS:08 sampling operations: 2008
Phase 1 Select initial institution sample for field test and
full-scale studies
Construct sampling frame from 2004–05 IPEDS files
Stratify 6,610 eligible institutions by institutional control, institutional level, highest level of offering, and proportion
of bachelor’s degrees awarded in education
Select probabilities-proportional-to-size sample of 1,630
institutions
Phase 2
Freshen full-scale institution sample
Construct sampling frame for sample freshening from
2005–06 IPEDS file
Stratify 170 newly eligible institutions by institutional control, institutional level, highest level of offering, and
proportion of bachelor’s degrees awarded in education
Select probabilities-proportional-to-size sample of 10 institutions
Phase 3 Augment full-scale institutional sample for
state-representative samples
Stratify institutions in six states by institutional control,
institutional level, and degree-granting status
Select probabilities-proportional-to-size supplemental sample of institutions in six states for a total
sample size of 1,960 institutions
Phase 4
Select full-scale student sample
Verify institution eligibility
and request student lists Receive enrollment lists from 1,730 of 1,940 eligible institutions
Use fixed rates to sample 137,800 students within institutions from up to
20 student strata per participating eligible institution
NOTE: IPEDS = Integrated Postsecondary Education Data System.
SOURCE: U.S. Department of Education, National Center for Education Statistics, 2007–08 National Postsecondary Student Aid Study (NPSAS:08).
The next step in the institutional sampling process was to determine eligibility. Of the sampled institutions (n = 1,960), about 1,940 (99 percent) were found to be NPSAS-eligible institutions.9
The sampling frames for selecting students were enrollment lists provided by the eligible sample institutions of students meeting eligibility criteria and enrolled during the 2007–08 academic year. Student enrollment lists were sampled as they were received, using equal probability stratified systematic sampling. Student sampling strata were as follows:
• in-state potential baccalaureate recipients who were business majors; • out-of-state potential baccalaureate recipients who were business majors;
• in-state potential baccalaureate recipients who were science, technology, engineering, or mathematics (STEM) majors and Science and Mathematics Access to Retain Talent (SMART) Grant recipients;
• out-of-state potential baccalaureate recipients who were STEM majors and SMART Grant recipients;
• in-state potential baccalaureate recipients who were STEM majors and not SMART Grant recipients;
• out-of-state potential baccalaureate recipients who were STEM majors and not SMART Grant recipients;
• in-state potential baccalaureate recipients in all other majors who were SMART Grant recipients;
• out-of-state potential baccalaureate recipients in all other majors who were SMART Grant recipients;
• in-state potential baccalaureate recipients in all other majors who were not SMART Grant recipients;
• out-of-state potential baccalaureate recipients in all other majors who were not SMART Grant recipients;
• in-state other undergraduate students who were SMART Grant recipients; • out-of-state other undergraduate students who were SMART Grant recipients;
• in-state other undergraduate students who were Academic Competitiveness Grant (ACG) recipients;
• out-of-state other undergraduate students who were ACG recipients;
• in-state other undergraduate students who were not SMART Grant or ACG recipients; • out-of-state other undergraduate students who were not SMART Grant or ACG
recipients;
• master’s students;
• doctoral students;
• other graduate students; and
• first-professional students.
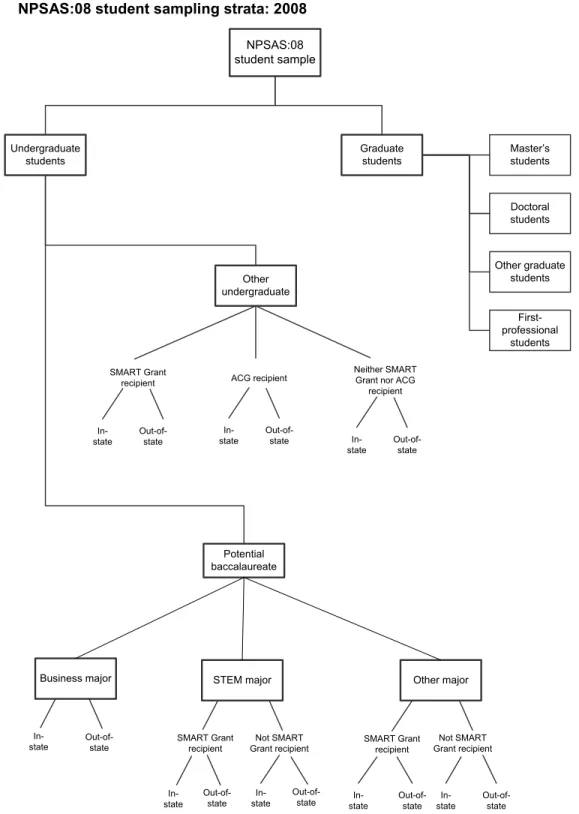
These 20 strata are most easily conceptualized in groups presented graphically (figure 2).
Potential baccalaureate recipients were students identified by the institution as having received or as expecting to receive a baccalaureate degree between July 1, 2007, and June 30, 2008. These students were stratified separately from other undergraduate students because they were oversampled to allow for sufficient numbers to be surveyed in the 2009 and 2012 follow-up Baccalaureate and Beyond Longitudinal Studies (B&B:08/09/12). Potential baccalaureate recipients and other undergraduate students were each divided into in-state and out-of-state strata because
undergraduate in-state students were oversampled in the six states with state-representative samples. These in-state and out-of-state strata were used for all institutions to allow for sampling ease and consistency; however, in states without state-representative samples, in-state students were sampled at the same rate as out-of-state students. Additionally, STEM majors, SMART Grant recipients, and ACG recipients were oversampled to allow for sufficient numbers for analysis. A large percentage of baccalaureate recipients major in business, so within the set of potential baccalaureate recipients, business majors were undersampled to ensure that the baccalaureate sample did not consist primarily of business majors.
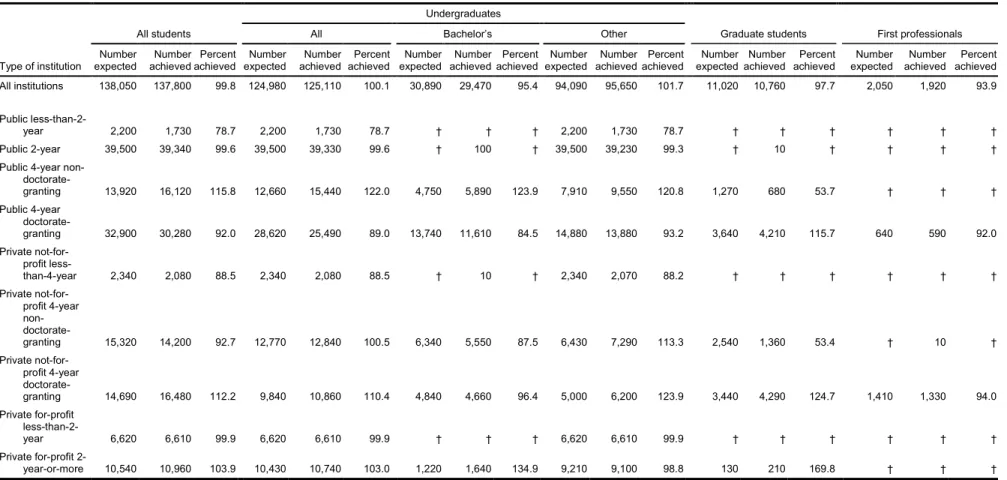
For each student stratum, the enrollment list was sampled at a rate designed to provide approximately equal student-level probabilities. To more accurately estimate the overall sample yield, student sampling rates were revised after sufficient lists had been received. The sampling rates were set to meet the sample sizes for the national sample (table 2) and to meet the sample size for the state sample (table 3). The final sample included 137,800 students; the target was 138,050 (see table 2).
Figure 2. NPSAS:08 student sampling strata: 2008 Undergraduate students Potential baccalaureate Other undergraduate
Business major STEM major Other major
Master’s students Doctoral students Other graduate students First-professional students
In-state Out-of-state
In-state Out-of-state stateIn- Out-of-state SMART Grant
recipient Grant recipientNot SMART
In-state Out-of-state stateIn- Out-of-state SMART Grant
recipient Grant recipientNot SMART SMART Grant
recipient
In-state Out-of-state
ACG recipient
In-state Out-of-state
Neither SMART Grant nor ACG
recipient
In-state Out-of-state NPSAS:08
student sample
Graduate students
NOTE: ACG = Academic Competitiveness Grant; SMART = Science and Mathematics Access to Retain Talent; STEM = science, technology, engineering, or mathematics.
SOURCE: U.S. Department of Education, National Center for Education Statistics, 2007–08 National Postsecondary Student Aid Study (NPSAS:08).
C hapt er 2. D es ign an d M et ho dol og y 12 N PSAS: 08 F ull-sc ale M et hod ol og y R ep or t
Table 2. Target numbers of sample students, by institutional stratum and student type: 2008
Type of institution All students Undergraduates Graduate students First professionals
All Bachelor’s Other
Number
expected achieved Number achieved Percent expected Number achieved Number achieved Percent expected Number achieved Number achieved Percent expected Number achieved Number achieved Percent expected Number achieved Number achieved Percent expected Number achieved Number achieved Percent All institutions 138,050 137,800 99.8 124,980 125,110 100.1 30,890 29,470 95.4 94,090 95,650 101.7 11,020 10,760 97.7 2,050 1,920 93.9
Public
less-than-2-year 2,200 1,730 78.7 2,200 1,730 78.7 † † † 2,200 1,730 78.7 † † † † † † Public 2-year 39,500 39,340 99.6 39,500 39,330 99.6 † 100 † 39,500 39,230 99.3 † 10 † † † † Public 4-year
non- doctorate-granting 13,920 16,120 115.8 12,660 15,440 122.0 4,750 5,890 123.9 7,910 9,550 120.8 1,270 680 53.7 † † † Public 4-year doctorate-granting 32,900 30,280 92.0 28,620 25,490 89.0 13,740 11,610 84.5 14,880 13,880 93.2 3,640 4,210 115.7 640 590 92.0 Private not-for-profit less-than-4-year 2,340 2,080 88.5 2,340 2,080 88.5 † 10 † 2,340 2,070 88.2 † † † † † † Private not-for-profit 4-year non- doctorate-granting 15,320 14,200 92.7 12,770 12,840 100.5 6,340 5,550 87.5 6,430 7,290 113.3 2,540 1,360 53.4 † 10 † Private not-for-profit 4-year doctorate-granting 14,690 16,480 112.2 9,840 10,860 110.4 4,840 4,660 96.4 5,000 6,200 123.9 3,440 4,290 124.7 1,410 1,330 94.0 Private for-profit less-than-2-year 6,620 6,610 99.9 6,620 6,610 99.9 † † † 6,620 6,610 99.9 † † † † † † Private for-profit 2-year-or-more 10,540 10,960 103.9 10,430 10,740 103.0 1,220 1,640 134.9 9,210 9,100 98.8 130 210 169.8 † † † † Not applicable.
NOTE: Detail may not sum to totals because of rounding. Baccalaureate and other undergraduate counts are based on having received or expecting to receive a bachelor’s degree at the time of sampling. SOURCE: U.S. Department of Education, National Center for Education Statistics, 2007–08 National Postsecondary Student Aid Study (NPSAS:08).
C hapt er 2. D es ign an d M et ho dol og y N PSAS: 08 F ull-sc al e M et ho do logy R epor t 13 1
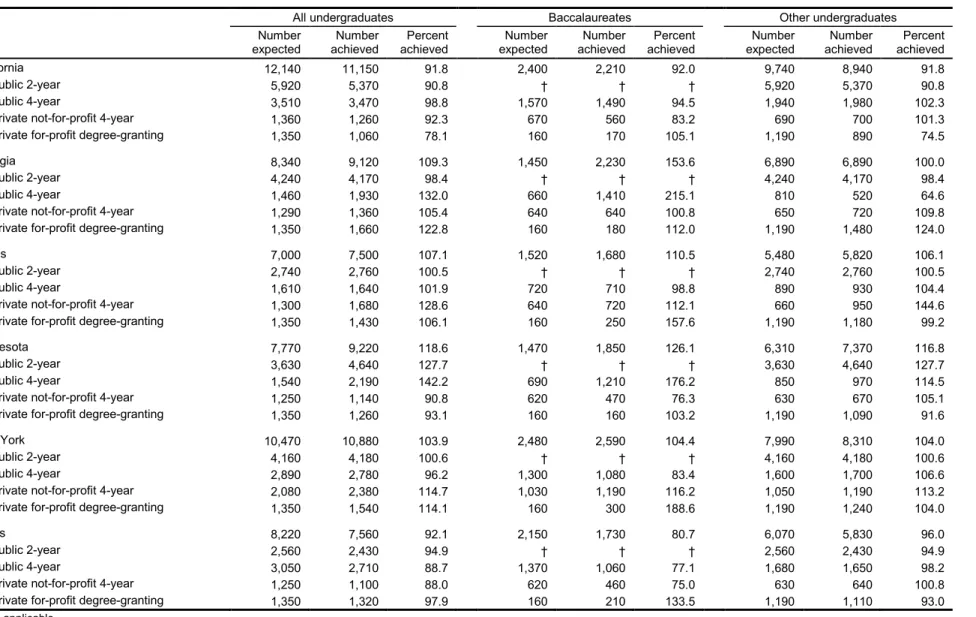
Table 3. Target numbers of sample students in the six state-representative samples, by institutional stratum and type of student: 2008 All undergraduates Baccalaureates Other undergraduates expected Number achieved Number achieved Percent expected Number achieved Number achieved Percent expected Number achieved Number achieved Percent
California 12,140 11,150 91.8 2,400 2,210 92.0 9,740 8,940 91.8
Public 2-year 5,920 5,370 90.8 † † † 5,920 5,370 90.8
Public 4-year 3,510 3,470 98.8 1,570 1,490 94.5 1,940 1,980 102.3
Private not-for-profit 4-year 1,360 1,260 92.3 670 560 83.2 690 700 101.3
Private for-profit degree-granting 1,350 1,060 78.1 160 170 105.1 1,190 890 74.5
Georgia 8,340 9,120 109.3 1,450 2,230 153.6 6,890 6,890 100.0
Public 2-year 4,240 4,170 98.4 † † † 4,240 4,170 98.4
Public 4-year 1,460 1,930 132.0 660 1,410 215.1 810 520 64.6
Private not-for-profit 4-year 1,290 1,360 105.4 640 640 100.8 650 720 109.8
Private for-profit degree-granting 1,350 1,660 122.8 160 180 112.0 1,190 1,480 124.0
Illinois 7,000 7,500 107.1 1,520 1,680 110.5 5,480 5,820 106.1
Public 2-year 2,740 2,760 100.5 † † † 2,740 2,760 100.5
Public 4-year 1,610 1,640 101.9 720 710 98.8 890 930 104.4
Private not-for-profit 4-year 1,300 1,680 128.6 640 720 112.1 660 950 144.6
Private for-profit degree-granting 1,350 1,430 106.1 160 250 157.6 1,190 1,180 99.2
Minnesota 7,770 9,220 118.6 1,470 1,850 126.1 6,310 7,370 116.8
Public 2-year 3,630 4,640 127.7 † † † 3,630 4,640 127.7
Public 4-year 1,540 2,190 142.2 690 1,210 176.2 850 970 114.5
Private not-for-profit 4-year 1,250 1,140 90.8 620 470 76.3 630 670 105.1
Private for-profit degree-granting 1,350 1,260 93.1 160 160 103.2 1,190 1,090 91.6
New York 10,470 10,880 103.9 2,480 2,590 104.4 7,990 8,310 104.0
Public 2-year 4,160 4,180 100.6 † † † 4,160 4,180 100.6
Public 4-year 2,890 2,780 96.2 1,300 1,080 83.4 1,600 1,700 106.6
Private not-for-profit 4-year 2,080 2,380 114.7 1,030 1,190 116.2 1,050 1,190 113.2 Private for-profit degree-granting 1,350 1,540 114.1 160 300 188.6 1,190 1,240 104.0
Texas 8,220 7,560 92.1 2,150 1,730 80.7 6,070 5,830 96.0
Public 2-year 2,560 2,430 94.9 † † † 2,560 2,430 94.9
Public 4-year 3,050 2,710 88.7 1,370 1,060 77.1 1,680 1,650 98.2
Private not-for-profit 4-year 1,250 1,100 88.0 620 460 75.0 630 640 100.8
Private for-profit degree-granting 1,350 1,320 97.9 160 210 133.5 1,190 1,110 93.0 † Not applicable.
NOTE: Detail may not sum to totals because of rounding. Baccalaureate and other undergraduate counts are based on having received or expected to receive a bachelor’s degree at the time of sampling.