Universal access and local internet markets in the US
Tom Downes
a,∗, Shane Greenstein
b,1aDepartment of Economics, Tufts University, Medford, MA 02155, USA
bKellogg Graduate School of Management, Northwestern University, Evanston, IL 60208-2013, USA Received 1 July 1998; received in revised form 29 March 2001; accepted 15 July 2001
Abstract
Concern over the potential need to redefine universal service to account for Internet-related services motivates this study of the geographic spread of commercial Internet service providers (ISPs), the leading suppliers of Internet access in the US. The paper characterizes the location of 40,000 access points, local phone numbers offered by commercial ISPs, in the Fall of 1997. Markets differ widely in their structure, from competitive to unserved. Over 92% of the US population has easy access to a competitive commercial Internet access market, while approximately 4.5% of the US population has costly access. © 2002 Elsevier Science B.V. All rights reserved.
Keywords: Internet; Universal service; Geographic diffusion; Telecommunications
1. Motivation
Governments frequently revisit the principle of universal service, making it an enduring issue in com-munications policy. In past eras this goal motivated policies which subsidized the operation of the tele-phone network in low-density areas. In recent decades the same concerns motivated policies to eliminate large disparities in the rate of adoption of digital com-munication technology within the public-switched telephone network (Cherry and Wildman, 1999).
Policy makers in the new information economy face similar issues in a different guise. The burgeon-ing literature discussburgeon-ing the “digital divide” (see, e.g. National Telecommunications and Information Administration, 1999) has prompted many analysts to anticipate a need to redefine universal service goals
∗Corresponding author. Tel.:+1-617-627-2687.
E-mail addresses: [email protected] (T. Downes), [email protected] (S. Greenstein).
1Tel.:+1-847-467-5672.
to account for Internet-related services.2 In fact, these issues are already on the policy agenda. For example, the 1996 Telecommunications Act contains provisions to collect funds to finance the diffusion of Internet access to public institutions, such as schools and libraries. The result is the E-rate, currently a US$ 2.25 billion federal program administered by the Federal Communications Commission (FCC). Using revenues generated from charges levied on users of long-distance services, the Universal Service Administrative Company reimburses firms providing telecommunications services, Internet access, and internal connections to eligible schools and libraries.
2 A complete bibliography is impossible. For some recent stud-ies, see US Advisory Council on the National Information Infras-tructure (1996), National Academy of Engineering (1995), National Telecommunications and Information Administration (1995), In-formation Infrastructure Task Force (1993, 1994), Drake (1995), Kalil (1995), Kahin (1991), Kahin and Keller (1995), National Research Council (1996), Teske (1995), Compaine and Weinraub (1997), Mueller (1997), and Werbach (1997).
0048-7333/02/$ – see front matter © 2002 Elsevier Science B.V. All rights reserved. PII: S 0 0 4 8 - 7 3 3 3 ( 0 1 ) 0 0 1 7 7 - 9
Researchers and policy makers are, however, con-cerned with more than the provision of access to public or quasi-public institutions. Specifically, re-searchers have pondered the role of government in closing the “digital divide.” Thus, a central question is whether privately motivated firms in the Internet access business achieve some universal service goals as a by-product of their competitive conduct. The con-trast with historical issues in telephony helps frame the question. As much scholarship has shown, private firms did develop service over a remarkably large geographic area without government intervention, but economies of density also limited this spread until government subsidies explicitly intervened decades later.3 At the turn of the century, low-density areas were more expensive to serve than high density ar-eas, so only major cities and nearby towns received telephone service during the era when the technology first diffused. Telephony then spread to isolated and low-density areas, with some cities receiving minimal service or none at all.
Will a similar pattern characterize the diffusion of the Internet infrastructure? Not necessarily, because the Internet had a very unusual genesis, with con-siderable involvement of the National Science Foun-dation and the Department of Defense (Greenstein, 2000). Unlike telephony, where the technology and commercial business co-evolved, Internet technology incubated under government supervision for over two decades prior to commercialization, making it ripe for immediate diffusion and commercialization. Also unlike telephony, where the new network developed in opposition to—and in competition with—the exist-ing telegraph network, commercial Internet services could be retrofitted onto the existing communica-tions infrastructure. Finally, the Internet is not a fixed technology diffusing across time and space without changing form. Instead, it is a malleable technology, embedded in equipment which employs Transmission Control Protocol/Internet Protocol (TCP/IP) stan-dards. The technology takes different forms in com-mercial settings than it did in academic use. Thus,
3 This is a large literature. See, for example, Mueller (1997), Barnett (1990, 1997), and Weiman (2000) about the early tele-phone industry. The closest analogue to the current paper is Baum et al. (1995) which examines the population dynamics of facsimile transmission service organizations.
there is little historical precedent for speculating about the present setting. Upon commercialization, it was unclear whether economies of density or other factors would influence the diffusion of the Internet over geographic space.4
In this study we examine the geographic spread of commercial Internet service providers (ISPs), the leading suppliers of Internet access in the US. We focus on these suppliers and their conduct for two rea-sons. First, market-based transactions with ISPs have become the dominant form for delivery of on-line access for medium and small users. In the absence of changes in government policy,5 the preeminence of commercial development is now widely forecast to continue. Second, surveys consistently reveal that the US population is far from universal adoption of Internet services at home.6 Yet, such surveys beg the question of whether all households have access to Internet service at the same low cost.
The first part of this paper provides a frame-work for thinking about the geographic diffusion of commercially-oriented Internet-access providers. In the long run, ISPs choose where to locate as a strategic matter. One business model relies on a firm structure providing a national service, another relies on a local or regional firm providing local or regional services.7 Since all consumers have access to the Internet at some price, the key question for marginal adopters is whether they can cheaply access the Internet over a telephone line. Because “cheap” is synonymous with a local telephone call to an ISP, the spread of com-mercial ISPs to low-density areas is a useful metric
4For a summary of this and related debates, as well as an argument in favor of imposing access fees, see Werbach (1997), Garcia and Gorenflo (1997), or Sidek and Spulber (1998).
5For example, as of this writing, the Federal Communications Commission does not charge access fees to ISPs, but is considering a number of proposals to do so. See the discussion and request for comment athttp://www.fcc.gov/.
6See, for example, Kridel et al. (1997), Maloff Group Interna-tional Inc. (1997), Compaine and Weinraub (1997), or Clemente (1998).
7The conclusions from the first part of the paper will be famil-iar to regular readers of commercial press for the ISP industry. For surveys of the on-line industry and attempts to analyze its commercial potential, see Hoovers (1997), Juliussen and Juliussen (1996), or Maloff Group International Inc. (1997). Also, see in-ter@ctive Week or Boardwatch.
for measuring the availability of commercial Internet in these areas.
The second half of the paper addresses related em-pirical issues: do all regions of the country receive similar access to Internet services provided by com-mercial firms? How do the different strategic goals of national and local ISPs influence the density of access in different areas? Does the privately financed Internet favor access in some regions over others? To answer these questions the paper then characterizes the loca-tion of over 40,000 dial-up access points offered by commercial ISPs in the Fall of 1997. This characteri-zation is the principal novelty of this study.
Fall 1997 was a good time for such a survey. The industry’s structure, while not completely stable, had reached a point where it was not changing every month. Most firms had been in the ISP market for a few years, making it possible to document their strate-gies, behavior and commercial achievement. The key findings of the empirical work are as follows: • The US commercial ISP market is comprised of
thousands of small geographically dispersed local markets for Internet access. There is no single struc-ture that characterizes the ISP market across the country. Nor should we expect this heterogeneity to disappear.
• Over 92% of the US population had access to a competitive local ISP market. Approximately 4.5% of the US population lived in areas with no access to any provider and approximately 3% lived on the margin between easy access and no access. • Whether there exist significant differences between
the experiences of Internet users in urban and rural settings depends on the extent to which national and local firms provide similar services. National firms primarily serve urban areas and compete with regional and local firms there. Service in rural areas and less densely populated urban areas is provided primarily by local and regional firms.
Though our focus is the geographic spread of ISPs, we believe our study will influence many facets of the burgeoning literature on information infrastructure policy. Since ISPs partially use the public-switch net-work, policy for this network should be sensitive to commercial conduct in the ISP market. In addition, many frontier information technology applications in electronic commerce, such as networking, hosting and
large scale web applications, build off the Internet. To the extent that these applications play a more sig-nificant role in regional business development, un-derstanding the development of Internet infrastructure also helps us analyze the contribution of new informa-tion technologies to regional economic growth. Thus, we finish the paper by drawing implications from our results for ongoing policy debates.
2. Background the changing nature of Internet access
This study examines the Internet access business in the fall of 1997, just over 5 years after the NSF relin-quished rights over the Internet to commercial entities. By this time many firms understood the technology for the delivery of Internet access using TCP/IP, but the commercial norms for the business were in flux. Different organizations employed different commer-cial models for the delivery of Internet access. During this experimentation Internet access spread to most regions of the US. This study documents and analyzes how far access spread.
2.1. Scope of investigation
We analyze the ISP industry after the development of browsers and therefore focus attention on firms that provide dial-up service which enables a user to employ a browser. Browser development occurred at about the same time as the final implementation of policies by the NSF to commercialize the Inter-net (Greenstein, 2000) and at the same time as the widespread adoption and development of World-Wide Web (WWW) technology. Furthermore, we make no distinction between firms that began as on-line information providers, computer companies, telecom-munications carriers, or entrepreneurial ventures. As long as their ultimate focus is commercial Internet access either as a backbone or a downstream provider they will all be characterized as ISPs.
2.2. Access and location
Most universal access issues concern the adoption rates of medium and small users, since these are the users on the margin between no-access and a few
low-cost alternatives. ISPs targeting users with regular and modest needs, which describes most residential users and small businesses in the US, require the user to make phone calls to a local switch. The cost of this phone call depends on mostly state regulations defin-ing the local calldefin-ing area and both state and federal regulations defining the costs of long-distance calling. The presence of ISPs within a local call area, there-fore, determines a user’s access to cheap Internet ser-vice. Similarly, the number of local ISPs determines the density of supply of low-cost access to Internet services within a small geographic region. Thus, the geographic spread of dial-up ISPs determines the cost of Internet access for most of the marginal users of the Internet.
As recently as 1995, only a few enterprises of-fered national dial-up networks with Internet access (Boardwatch, 1997), mostly targeting the major ur-ban areas. In contrast, by the Fall of 1997, there were dozens of well-known national networks and scores of less-known national providers. There were also many local providers of Internet access that served as the links between end-users and the Internet backbone, and local shoestring operations seemed less common.
2.3. Government subsidies and the maturing of the ISP industry
Much of this growth of the ISP industry occurred at the same time that explicit government support for the industry was declining. Prior to commercialization of the Internet, government assistance took many forms. The federal government provided subsidies for access to IP networks at remotely situated universities, sidies for software and shareware development, sub-sidies for the development of backbone infrastructure, and subsidies for the operation of many governance mechanisms. Nevertheless, the explosive growth of the Internet postdated most of this activity by NSF.
If we provide evidence that commercial firms effec-tively provide universal access, it might be tempting to interpret our findings as indicating that government involvement in the ISP market had little influence. Such a conclusion would be unwarranted. First, in the mid-1990s the commercial Internet access in-dustry retained significant indirect technical support from university computer science and engineering programs, where federal government research support
continued. This support took the form of research grants for the development of new software or hard-ware and subsidies for the training of advanced engineers. These indirect subsidies undoubtedly influ-enced the commercial behavior we document below.
Second, the geographic shape of the commercial Internet access market could still retain the imprint of federal and state support for the development of information infrastructure. For example, much back-bone was laid in the 1980s and 1990s to support data traffic flows between universities and government re-search facilities or to support other educational needs. Many state governments also developed fiber lines in parts of their state in support of similar initiatives. The firms associated with that backbone, such as MCI, continue to be major providers of backbone and use much of the backbone for commercial traffic. Commercial developments engendering new traffic patterns altered those configurations in due time, but initially commercial uses were built on top of the old structures. Some part of this infrastructure is attributable to the old subsidies, the costs for this por-tion of the infrastructure are sunk, and this porpor-tion is providing services. Thus, government support for this infrastructure should be properly called a subsidy.
Third, providers may have entered in anticipation of future federal support. Expected support may take many forms. Recent programs, such as the develop-ment of Internet II and the E-rate, have received much publicity. We have no way to tell how much of the ob-served commercial behavior is attributable to invest-ments made in anticipation of these programs.
Finally, while we focus on the lowest cost sector of the Internet access industry in our study, many firms operating in this sector make provision decisions in conjunction with decisions concerning the provision of other commercial services. Government support influences those other services. Thus, for exam-ple, government programs encouraging demand for high-speed access or local infrastructure development may influence the overall profitability of the typical local, regional, or national ISP business in a particular area. As a by-product, these programs may lead to the development of the dial-up industry in a local area.
The bottom line is that this paper is not an attempt to address the question of whether there should be any government involvement in the ISP market. The data do not permit us to answer this question since, even
after commercialization, government policies proba-bly have affected the geographic coverage of access. Instead, our goal is much more limited; to provide ev-idence about how much or how little commercial ISPs accomplished early in the development of the com-mercial access market. That might be useful to policy makers seeking to determine if further subsidization of the ISP industry is warranted.
2.4. The geographic scope of coverage
This goal requires us not only to summarize the extent of access in particular areas but also to at-tempt to determine the factors that shape the nature of access in a particular area. ISPs make strategic choices over the scale of service to provide at a node, the quality of the hardware and software associated with offering connections, the value-added services to offer in conjunction with access, the geographic scope of their enterprise, and the pricing of their product line. Industry surveys from the time period under study demonstrate much heterogeneity in the underlying capital and equipment structures of ISPs, indicative of experimentation in these investments and organizations (Maloff Group International Inc., 1997; Boardwatch, 1997).8 All the decisions made by ISPs influence the quality of the service the customers experience (Stapleton, 1997).
Providers who seek to offer national service must choose the regions in which they maintain POPs (points-of-presence).9 As we show, most providers with national coverage maintain POPs in any moder-ately large city in the US in which there is apprecia-8For example, see the compilation of business lines for ISPs maintained by MecklerMedia onhttp://thelist.Internet.com/. Most ISPs offer some dial-up service and many other services.
9While the nature of POPs varies greatly, a POP usually in-cludes routers, digital/analog call aggregators, servers, and fre-quently frame relay or asynchronous transfer mode switches. There is also no uniformity in where POPs are located. For example, it is not unusual for a POP to reside in rented space owned by the telecommunications carrier to which the ISP is connected. But POPs can be located anywhere there is demand for Internet ac-cess. For example, Comm Systems advertises its “POP-In-A-Box” as a “simple unmanned internet connection” which consists of a “remote earth station” at which a server aggregates the data from local dial-up or ISDN connections into “a single stream for satellite transmission to an internet gateway” ( http://www.comm-systems.com/Pop-in-a-Box Brochure.htm).
ble commercial activity. These commercial motives would lead us to expect to find that national firms cover areas of the US which contain most of the pop-ulation. Therefore, if the strategic decisions of local and national providers differ systematically, residents of less populated areas may have access to lower quality service, if they have access at all. Thus, in regions with limited access, it is imperative that we document not only the presence of an ISP but the type of ISP that is present.
We document different type of providers for one other related reason. Service quality has many di-mensions. Local ISPs in rural settings necessarily lose many of the advantages of economies of scale, which influences investments related to higher speeds, timely connection, broad geographic coverage and customized services. Such ISPs also may be compet-itively isolated, lacking economic incentives to im-prove certain features of service. General conclusions are difficult to draw, so it is unclear how important these factors are in practice. However, there is in-complete (but very suggestive) evidence that ISPs located in low-density areas are lower quality than those located in most cities.10
3. Research questions
This discussion predicts that most urban areas will have abundant Internet access from commercial firms and some remote areas might not. Between these two predictions lies a very large set of possibilities. Ex-ploring these possibilities is the focus of the empirical work below.
3.1. Question 1—the extent of geographic coverage
Some parts of the country will not have access to low-cost commercial Internet providers. It is not in 10See Strover (2001) and Nicholas (2000) for detailed studies of how ISPs in rural Texas sacrifice specific dimensions of quality while still providing some minimal service. Greenstein (2000) and Augereau and Greenstein (2000) offer evidence on differences between urban and rural ISPs in providing customized services and higher speeds for dial-up access. Also, see Compaine (2001) and National Telecommunications and Information Administra-tion (1999, 2000) for discussion of this dimension of the “digital divide.”
a local or regional or national ISP’s interest to pro-vide dial-up service to every small town or less-dense area in the US. How much of the population does not have easy access to providers of commercial Internet access? Are those areas overwhelming low-density? How does access change when density increases?
3.2. Question 2—the degree of competition in urban and rural areas
What conditions characterize the highly competi-tive areas? We expect most residents of urban and high-density areas will face a competitive and abun-dant supply of Internet access from commercial firms. How much of the population living in such areas has access to competitive ISP markets?
3.3. Question 3—variation in type of provider between urban and rural areas
The provision to rural and low-density areas will depend on the entry of local and regional and national firms. No type of firm will predominate in every area. How does the provision of commercial access by local, regional and national firms vary across the US?
4. Data
In order to track the geographic spread of ISPs, we compiled a list of telephone numbers for dial-up access and their location. We then computed the geographic distribution of the POPs across the US. We explain these data and methods below.
4.1. Data sources
The best way to compile a list of ISPs by location is to go to the information sources used by most po-tential ISP consumers. In the Fall of 1997, the authors surveyed every compilation of ISPs on the Internet. Only a few of these compilations were found to be comprehensive, systematic, and regularly updated in response to entry and exit. This study’s data combine a count of the ISP dial-in list from August/September of 1997 in thedirectory and a count of the backbone
dial-in list for October of Boardwatch magazine.11 This choice was made because thedirectory ISP list contained the most comprehensive cataloguing of the locations of POPs maintained by all ISPs except the national backbone providers, for which Boardwatch contains a superior survey of locations.
For many of the tables below, the key question will be the following: How many suppliers have POPs in a market? While answering this question, we came across a few ambiguous situations which we resolved as follows: When the city of a dial-in phone number was listed, we used that.12 When it was in doubt, the area code and prefix of the dial-in POP were compared to lists of the locations of local switches with these area-codes and prefixes. We used the location of the lo-cal switch in that case. If this failed to locate the POP, which happened for small ISPs that only provide in-formation about their office and nothing about the size of their dial-up network, then the voice dial-in number for the ISP was used as an indicator of location.13
On final count, thedirectory contained 34,885 phone numbers not found in Boardwatch, Boardwatch con-tained 4005 phone numbers in its backbone list not found in thedirectory, and 984 phone numbers came from both. The merged set contained 39,874 phone numbers which serve as dial-in POPs. Applying the above procedures and principles resulted in a total of 31,163 unique firm/county presence for 4976 ISPs. Of these firm/county presence, over three quarters were associated with just over 200 firms. Of the total num-ber of ISPs, approximately half were ISPs for which we had only a single phone number.
Our procedure for establishing the location of POPs will produce flawed data for our purposes only if it 11Current versions of these lists may be examined at
http://www.thedirectory.org/andhttp://www.boardwatch.com/. Our dataset includes POPs found in the ISP section of thedirectory and excludes POPs found in bulletin boards. Our dataset also includes POPs for ISPs listed in the Boardwatch backbone section.
12When a city is part of two counties and the phone number did not resolve the ambiguity, the phone number was counted as part of the county in which the city has the greatest share of its land. 13This last procedure mostly resulted in an increase in the number of firms we cover, but not a substantial change in the geographic scope of the coverage of ISPs. The dataset contained over 37,000 phone numbers prior to adding firms that only provided a phone number for their home office. The additional 2500 phone numbers did not disproportionately show up in uncovered areas. They did, however, help identify entry of ISPs in a few small rural areas.
generates sampling error which correlates with geog-raphy. We have taken several steps to quantify and, if necessary, correct any biases that the procedure may have imparted to some counties. Overall, there appears to be no strong evidence of any error in the coverage of small commercial ISPs. In addition, there appears to be a strong positive correlation in the geographic coverage of national firms because most of them lo-cate predominantly in urban areas. Thus, even if these two lists failed to completely describe the coverage of many national firms, there is no evidence that the qual-itative conclusions would change much if the omitted POPs of these firms were added.14
One potential flaw with our procedure is that it may produce the impression that there has been less ISP entry than has actually occurred in new suburbs in counties that border on dense, urban counties, since new, growing suburbs frequently use the telephone exchange of existing cities. Unless the ISP specifically names this new suburb in the bordering county as a targeted area, our procedures will not count the ISP’s presence in that new suburb.15
We control for this potential bias below by treat-ing as the market for an ISP a county and its nearby neighbors.
4.2. Definitions
Both thedirectory and Boardwatch try to distin-guish between bulletin boards and ISPs, where the for-mer may consist of a server and modems, while the latter provide WWW access, FTP, e-mail, and often much more.16 We exclude firms the primary business of which is providing downloadable text or software
14As a check, we determined that, even if a dozen national providers were left out of the sample, the basic qualitative con-clusions would not change.
15A similar and related bias arises when a county’s boundaries and a city’s boundaries are roughly equivalent, even when the neighboring county contains part of the suburbs of the city. In this situation, many ISPs will claim to be located within the city’s boundary even though residents will recognize that the ISP is located on the city boundary and its coverage may be more extensive than this declaration would indicate.
16Extensive double-checking verified that thedirectory and
Boardwatch were careful about the distinction between an ISP
and a bulletin board. No bulletin boards were ISPs, and they were appropriately not classified as an ISP.
without Internet access and firms that only provide di-rect access and not any dial-up service.
Both lists concentrate on the for-profit commercial sector.17 For example, both eschew listing university enterprises that effectively act as ISPs for students and faculty. This is less worrisome than it seems, since commercial ISPs provided over 90% of household ac-cess within a few years (Clemente, 1998). In addition, commercial ISPs gravitate towards the same locations as universities. This study’s procedure, therefore, will likely pick up the presence of ISP access at remotely situated educational institutions unless the amount of traffic outside the university is too small to induce commercial entry.
In all tables below, national ISPs are defined as firms that maintain POPs in more than 25 states. This is slightly more stringent than the definition for national provider found in Boardwatch, in which the definition of national is any provider in more than 25 area codes, but in practice it is not much different. Local firms are present in three or fewer counties. The remainder are considered regional ISPs.
The tables below provide a broad description of county features. Population numbers come from 1996 US Bureau of the Census estimates. We label a county as urban when the Census Bureau gives it an MSA des-ignation, which is the broadest indicator of an urban settlement in the region and includes about a quarter of the counties in the US.
For all tables below, the data pertain to all states in the US except Alaska and Hawaii.18 These data also include the District of Columbia, which is treated as another county. Throughout this study county defini-tions correspond to standard US Census county defi-nitions. This results in a total of 3110 counties.
To cope with the fact that county boundaries are po-litical boundaries and do not directly correspond with meaningful economic market boundaries, we calculate summary statistics to account for the presence of ISPs in nearby counties.19 We make tables for a “County
17Thedirectory does, however, list some free-nets. Their inclusion appears to depend on whether the free-net notifies thedirectory of their existence, seeking users from the general population.
18Alaska is excluded because its geography and related statistics are so unusual. Due to a research assistant’s error, data for Hawaii were found to be flawed and thus had to be omitted.
19To do this we use the US. Bureau of the Census’s Contiguous County File, 1991: US (1992).
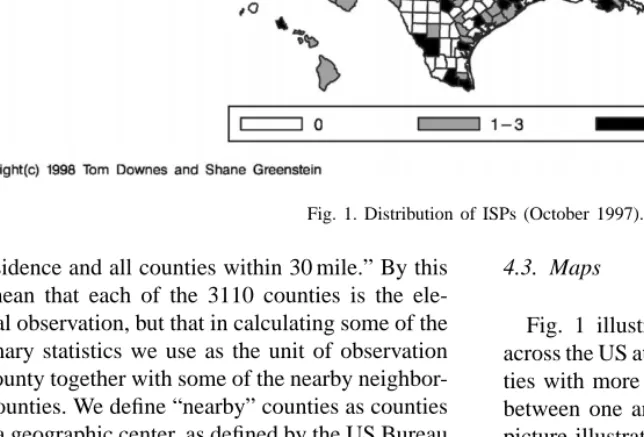
Fig. 1. Distribution of ISPs (October 1997).
of residence and all counties within 30 mile.” By this we mean that each of the 3110 counties is the ele-mental observation, but that in calculating some of the summary statistics we use as the unit of observation the county together with some of the nearby neighbor-ing counties. We define “nearby” counties as counties with a geographic center, as defined by the US Bureau of the Census, within 30 mile of the geographic center of the county of residence. We chose 30 mile because this is within the first mileage band for a long-distance call in most rural areas.20
20We experimented with a number of different definitions of the market. We began by using the counties themselves as the unit of observation. We found that this definition failed to account for the fact that counties with little entry frequently border on competitive markets. We also tried the other extreme, calculating the influence of all neighboring counties without distinguishing by their distance, but found that this was far too inclusive of neighboring counties the populations of which could not be linked by local phone calls. These results are available from the authors.
4.3. Maps
Fig. 1 illustrates the density of location of ISPs across the US at the county level. Black areas are coun-ties with more than three providers. Gray areas have between one and three. White areas have none. The picture illustrates the uneven geographic coverage of the ISP industry. ISPs tend to locate in all the major population centers, but there is also plenty of entry into rural areas. The map also illustrates the importance of accounting for the influence of nearby counties.
5. The geographic scope of ISPs in Fall 1997 The summary of the nature of ISP coverage can be found in Tables 1–4.
Table 1 is organized by counties in the continental US, where the central county is the unit of observation.
Table 1
Entry of ISPs: number of providers in the “market”a Number of providers in market Number of countiesb Percentage of population in these counties Cumulative population percentage Percent of these counties urban 0 321 1.23 100.00 1.56 1 185 0.89 98.77 6.49 2 217 1.36 97.88 5.07 3 140 0.93 96.52 5.00 4 163 1.36 95.59 4.29 5 105 0.90 94.23 4.76 6 105 1.08 93.33 7.62 7 64 0.65 92.26 7.81 8 81 1.16 91.61 9.88 9 67 0.62 90.45 4.48 10 78 0.80 89.83 10.26 11–15 223 2.58 89.02 10.31 16–20 153 2.03 86.44 10.46 21 or more 1208 84.41 84.41 59.69
aMarket definition: county of residence and all counties within 30 mile.
bFor the calculations in the final three columns, the county of residence is treated as the unit of observation.
It shows the number of counties with ISPs numbering zero or one or two or so on in the county or nearby neighboring counties, the percentage of the US popu-lation that lives in those central counties, the cumula-tive population percentage, and the percentage of the central counties that are urban counties.
Of the 3110 counties, 321 do not contain a single POP supported by any ISP in its county or in any
Table 2
Population and population density by number of providers in the “market”a Number of providers in market Number of counties Mean population— county Mean population— market Mean population densityb—county Mean population densityb—market 0 321 10064.06 33804.18 10.80 11.42 1 185 12725.99 68626.23 25.97 22.30 2 217 16540.54 66266.03 19.58 20.44 3 140 17464.39 102187.50 28.84 33.47 4 163 21922.39 93960.31 27.14 28.81 5 105 22600.97 132260.24 46.25 44.06 6 105 27043.89 119064.46 58.39 39.07 7 64 26791.59 160714.14 45.44 50.48 8 81 37680.80 175331.12 67.18 57.98 9 67 24340.34 169103.97 48.47 54.99 10 78 27170.12 175260.94 49.01 57.35 11–15 223 30527.13 199563.45 61.48 66.04 16–20 153 34998.62 221015.17 73.00 73.86 21 or more 1208 184113.07 994489.46 537.43 345.43
aMarket definition: county of residence and all counties within 30 mile. bPopulation density is measured as population per square mile.
nearby county, 185 have only one, 217 have only two, and 140 have only three. Once again, these counties tend to contain a small part of the population. Just under 4.5% of the US population lives in counties with three or fewer ISPs nearby. As further evidence that low (high) entry is predominantly a rural (urban) phenomenon, almost 95% (1447 out of 1526) of the counties with 10 or fewer suppliers are rural.
Table 3
Population and population density by number of providers in the “market” and by urban/rural statusa Number of providers Number of counties Mean population— county Mean population— market Mean densityb— county Mean densityb— market Rural counties 0 316 9359.06 32454.62 9.88 10.61 1 173 10353.55 59610.71 22.80 19.05 2 206 14850.00 62042.55 17.23 18.71 3 133 15647.26 96563.68 26.01 31.06 4 156 21332.12 90519.33 26.07 27.71 5 100 20640.26 125920.29 43.78 42.05 6 97 23113.07 110440.44 55.95 36.23 7 59 25111.17 148928.73 41.42 46.57 8 73 30423.42 149874.45 60.80 46.35 9 64 22465.92 160580.81 46.00 51.93 10 70 25769.84 150005.03 42.62 47.57 11–15 200 27416.96 183663.62 55.77 58.39 16–20 137 30691.02 206006.71 66.56 68.61 21 or more 487 38494.19 352729.83 96.93 110.88 Urban counties 0 5 54620.00 119096.20 69.34 62.65 1 12 46928.67 198600.00 71.74 69.09 2 11 48199.64 145360.27 63.61 52.91 3 7 51990.00 209040.00 82.69 79.32 4 7 35077.14 170645.00 51.01 53.15 5 5 61815.20 259059.20 95.51 84.43 6 8 74705.00 223630.63 88.06 73.46 7 5 46620.60 299782.00 92.91 96.69 8 8 103904.38 407623.25 125.42 164.17 9 3 64328.00 350931.33 101.29 120.34 10 8 39422.50 396250.13 104.88 142.97 11–15 23 57572.04 337822.87 111.18 132.48 16–20 16 71882.44 349525.13 128.10 118.79 21 or more 721 282471.46 1427966.50 834.97 503.85
aMarket definition: county of residence and all counties within 30 mile. bPopulation density is measured as population per square mile.
Table 1 offers the starkest finding of this study, revealing that commercial forces have spread Inter-net access to a substantial part of the US population. More than 92% of the US population has access by a short local phone call to seven or more ISPs. Compared with some of the most pivotal networking industries in the last two centuries, such as electricity, communications, rail, and broadcasting, this diffusion is remarkably rapid. Moreover, the geography of the universal access issue, as of the Fall of 1997, was predominantly rural and, then, only pertinent to a fraction of the rural population.
Table 2 elaborates on Table 1, giving the rela-tionship between the presence of ISPs and some basic features of counties, principally population and
population density. While there is variance around the relationship between population and the presence of ISPs, the trend in average population size is almost monotonic. That is, for small markets the number of suppliers grows with population. Density is also correlated with entry.
Table 3 explores the difference between urban and rural areas, shedding light on the relationship of den-sity to entry. It breaks the counties into those in urban and those in rural areas, then computes the same sum-mary statistics as in Table 2. The most obvious feature is that population levels and densities differ between urban and rural areas. More important, there is also a difference in the relationship between the population and density of the region and ISP entry. In rural areas,
Table 4
Number of ISPs in the market by type of ISPa Number of ISPs in market Number of counties Number of counties local only Population local onlyb Number of counties regional only Population regional onlyb Number of counties national only Population national onlyb 0 321 – – – – – – 1 185 100 1343322 82 991705 3 19282 2 217 84 1637975 100 1428044 1 15531 3 140 36 718529 46 696843 0 0 4 163 28 765626 41 727796 1 24422 5 105 12 328187 13 177828 0 0 6 105 9 242489 13 188641 0 0 7 64 4 151350 5 49547 0 0 8 81 4 488282 10 163725 1 30663 9 67 1 34152 6 115577 0 0 10 78 1 35620 10 198571 0 0 11–15 223 0 0 14 312468 1 18212 16–20 153 0 0 4 138230 0 0 21 or more 1208 0 0 2 64790 0 0 Total 3110 279 5745532 346 5253765 7 108110
aMarket definition: county of residence and all counties within 30 mile.
bFor the calculations in these columns, the county of residence is treated as the unit of observation.
both population levels and population density predict the level of entry into counties with fewer than four suppliers. In contrast, in urban areas population levels do not strongly coincide with ISP entry. Since there are, however, so few urban area observations with ten or fewer ISPs in Table 3, these results may be strongly driven by a few observations.
Finally, Table 3 is consistent with the view that there are economies of scale at the POP and these economies largely determine the relationship between number of suppliers and population levels in rural areas. If there are economies of scale at the POP and no difference in demand across regions with different density, then economies of scale determine thresh-old entry and incremental entry thereafter. Table 3 is not conclusive evidence of these scale economies, however, because it is does not control for levels of demand. It is possible that different geographic features of these areas may correlate with different levels of demand or unobserved intensities of demand that systematically differ across counties of differ-ent population size. There is insufficidiffer-ent evidence in these tables to test these competing hypotheses. To do so would require careful measurement of the determinants of demand (see, e.g. Kridel et al., 1997). Table 4 presents the structure of ISP entry in small markets. It divides markets by the number of entrants
and then classifies them into those in which all suppli-ers are either local, regional or national. The striking feature of this table is that many small markets are entirely supplied by local or regional ISPs. Rarely, if ever, are any of these small markets entirely supplied by national ISPs. In fact, of the 3110 counties in our dataset, 1550 counties are not within 30 mile of a national provider, 700 are not within 30 mile of a regional provider and 730 are not within 30 mile of a local ISP.21
Table 4 gives more information on the types of providers in markets with few entrants. Of the 185 with only one supplier in this county and nearby counties, 75 are served by a local ISP, 107 are served by a regional ISP, and 3 are served by a national ISP. Of the 225 with two suppliers in this county and nearby counties, 52 have only local suppliers, 131 have only regional, and 3 have only national. Further, Table 4 shows that once the number of entrants gets past about five or six in a county and nearby area, then the residents will likely have a choice among a mix of national, local and regional suppliers. This is
21These are not mutually exclusive. Many of the counties without a local ISP are the same counties without a regional or national ISP.
striking evidence that national and local ISPs treat urban and rural areas differently.
The other columns of Table 4 show the population that lives in the counties with only one type of supplier. Just under 5.75 million people live in counties with only local ISPs. Just over 5.25 million live in coun-ties with only regional suppliers. Just over 0.1 million live in counties with only national providers. Further, about 11.99% of the population resides in counties in which no national ISP is present in the market. These figures provide a cautionary note to accompany the in-terpretation above of Table 1. If national, regional and local firms provide different quality of service, and if the national firms are better, then Table 4 is evidence that the presence of an ISP may not be sufficient to in-fer similar access in both urban and rural areas. That said, this is primarily an issue for small rural counties. To illustrate these points, we provide Fig. 2, which shows all the counties with at least one national
Fig. 2. Location of national firms (October 1997).
provider. Counties shaded in black have at least one national provider, and counties shaded in gray have only local or regional providers. The figure shows clearly that national firms are present primarily in the major urban areas. In the areas with the least entry, predominantly rural counties, no national firm has entered. Indeed, Figs. 1 and 2 look similar for this reason.
A majority of ISPs specialize in either urban or ru-ral areas. All things equal, most ISPs have a foot in an urban county. Indeed, most local ISPs are located in thick competitive urban markets, which gives them a very different experience from the local ISPs in thin rural markets. Very few local ISPs specialize in only rural counties. This is consistent with the view that ISPs that grow in geographic scope tend to go into neighboring geographic counties with different char-acteristics. Even if they began in an urban county, they expand to provide service in rural areas, and vice
versa. The greater the geographic spread of the ISP; the more likely it will be in a mix of urban and rural counties.
National firms tend to target the same regions. Vir-tually all of the national firms have a presence in the same large US cities. As a result, three quarters or more of the population of the US have access to very competitive service from a variety of national and lo-cal firms. If a county is large enough to support over six suppliers the population is almost certain to have access to a variety of entrants—local, regional and na-tional. Since about 92% of the population has access to markets with seven or more suppliers, we conclude that no less than 92% of the US population has access to the full range of firms found in a competitive access market.
This suggests that it may be appropriate to expand the view of the market structure of ISPs. As a rough approximation to understanding strategy and structure, firms in the ISP access industry could be classified into five categories: (1) urban/national: National firms that predominantly specialize in urban areas and secondar-ily serve rural areas. This is the vast majority of na-tional firms. (2) Urban/local: Local firms that predom-inantly specialize in urban areas. This is a substantial majority of local firms. (3) Rural/local: Local firms that predominantly specialize in rural areas or small towns. While not the majority of local firms, these still number in the hundreds. These are the majority of firms to be found in rural areas. (4) Rural/national: National firms that predominantly specialize in rural areas and secondarily in urban areas. This is a handful of firms. (5) Regional: Firms that have as their base either a single rural or urban market but that also have a geographic territory expanding beyond that base. These number over a hundred.
The analysis above suggests that most firms fall in the first two categories. And, over time, categories 3–5 have become less common. Further, category 5, regional ISPs, is likely to shrink since many firms currently in the category will expand their geographic reach and become national.
Two different interpretations are consistent with the pattern in Table 4 and Fig. 2. If one believes that national ISPs offer higher quality access than local ISPs, then the economies of scale required to main-tain high-quality POPs will preclude national entry in small markets. On the other hand, if one considers
local or regional ISPs to be better than national ISPs at tailoring their services to the unique needs of their area, then national ISPs will acknowledge their disad-vantage and often choose not to enter. Notice too that this second view requires there to be something unique or idiosyncratic about the tailoring of services to small local markets. Otherwise, national firms could eas-ily imitate the strategies pursued by local or regional firms in small markets. Several dozen national firms are present in hundreds of locations, providing access to many users, while the majority of firms are not.
In the absence of some decreasing cost technol-ogy, such as some sort of coordination economies, or increasing returns on the demand-side, these ba-sic economics limit the geographic expansion of the national ISP networks. Since national firms also face economies of scale at the POP—even at a remotely monitored POP—and constant costs to the addition of POPs, it follows that they too find it unprofitable to be ubiquitous. It will not be beneficial for any na-tional firm to expand its network POPs in increasingly remote areas, bringing in fewer additional customers with each additional expansion. It is better for MCI or AT&T, for example, to offer potential customers in remote locations 800 service or direct access lines if the user is a business.
6. Implications
Five findings from these tables should shape further policy discussions of the commercialization of Inter-net access. First, the diffusion of InterInter-net access is a commercial process, driven by commercial motives. As such, the firms in this industry have developed Internet access markets for most of the US population in a relatively short period. Second, some regions of the country, primarily less densely populated rural areas, do not have access to any low cost commercial Internet providers. There is a minimum threshold of population needed to support entry of an ISP POP. It seems possible that local and national POPs face different thresholds. Third, some regions face compet-itive access markets and some do not. Most residents of urban and high-density areas face a competitive and abundant supply of Internet access from commercial firms. The part of the US population which does not have access to a competitive ISP market lives in rural
and low-density areas. Fourth, no single type of mar-ket structure is ubiquitous. Marginal rural areas are mostly covered, if covered at all, by local or regional ISPs. In urban areas, virtually all markets contain a mix of local and national ISPs. Fifth, it appears that local and national firms pursue different entry strategies. These translate into different geographic scope for local and national firms in the industry. We develop additional implications below.
6.1. The scale of ISPs and scope of geographic coverage
The results in Table 4 are consistent with the view that small areas or rural areas are being developed first by local and regional ISPs and only occasionally by national ISPs. This may mean that, in many of these areas with few providers, the quality of service is lower than that in urban areas. In fact, many trade publications predict that low-quality dial-up service can survive only in rural areas or isolated markets.
It is inappropriate, however, to assume that all lo-cal ISPs provide lower quality service. For example, in areas in which national firms have a presence, a high-quality local ISP could still thrive if it tar-gets users who do not want AOL’s brand of service or AT&T’s lack of hand-holding. The reality fac-ing entrepreneurs who are contemplatfac-ing creatfac-ing a high-quality local ISP is that offering high-quality service can be expensive, necessitating a minimum scale of service and the provision of a choice among different types of additional services (Stark, 1997). Because the underlying engineering capabilities have diffused so widely, the local firm must provide a ser-vice that includes features which will not be imitated by fast-second entry from a national firm. For ex-ample, many features of Internet commerce, such as web-page design, have quickly become standardized, giving advantages to low-cost national designers, but local firms may be able to reflect local needs. Lo-cal firms may also develop reputations for quicker service in emergencies, friendlier site-visitation or user-instruction, and customized technical support (Greenstein, 2000). On the other hand, due to either the absence of economies of scale or the absence of com-petitive alternatives, local firms in rural areas may not invest in the infrastructure necessary for high-quality service, leaving users with slower speeds, frequent
busy signals, minimal reliability, or poor connectivity (Nicholas, 2000).
In sum, the different population thresholds for local and national POPs are consistent with three theories. First, local POPs in rural areas may enter with lower quality than national POPs. That is, entering with low-quality equipment lowers a local POPs costs. Alternatively, local POPs in rural areas may be enter-ing with different value-added services than national POPs in urban areas. That is, local POPs in rural ar-eas may not be deriving much profit from their ISP service but are able to survive by offering other com-plementary services tailored to rural areas.22 This view only makes sense if the value-added services of-fered by a local POP have a strong local component; otherwise, a national firm could imitate the local POP and profitably expand into rural areas. A third view23 is that many rural ISPs provide service as part of their activities as rural cooperatives or other quasi-public institutions supporting local growth. In this view, en-try into rural areas is driven by community and public service motives, not profit motives. These different motives would account for the willingness of rural ISPs to enter areas avoided by profit-oriented, na-tional ISPs. It is still largely a matter of speculation as to which view applies.
These three views will set the agenda for the uni-versal access debate. If there are strong economies of scale at the POP, these will limit entry of ISPs in rural and remote areas. If ISPs become essential for local growth, there may be a role for public or quasi-public local institutions to subsidize local ISPs to overcome their inability to take advantage of these scale economies. If the local component of an ISPs service becomes an essential element of its offerings, then national firms may never find it commercially profitable to move to remote areas. If high quality ser-vice is expensive to offer, then remotely situated firms in rural areas may find it difficult to afford to upgrade their networks. And, of course, all of this could change if scale economies weaken or if the costs between high and low quality narrow enough so that ISP product lines become similar in rural and urban areas.
22For some data on these hypotheses, see Strover (2001) or Greenstein (2000).
23See, in particular, Garcia (1996) and Garcia and Gorenflo (1997).
6.2. Market structure, taxation and subsidies
These patterns should influence any debate about subsidies and taxation of the ISP industry. All future policy debates should be cognizant of the fact that changes in policy will affect urban and rural areas dif-ferently. For example, altering access charges for ISPs will elicit different responses depending on whether the area is predominantly served by local or national companies. Similarly, taxing ISPs, which many states are already doing or proposing to do, will produce similar differences in urban and rural communities. These points are especially true if the business model for ISPs—particularly the percent of revenue associ-ated with non-dial-up business—differs between ur-ban and rural areas; in that case, the same tax could result in altering the mix of services offered in each type of area.
Proposals for subsidizing ISPs also bring forth some difficult questions. First, the results above make clear that few residents of the US have no access to the Internet. Thus, universal subsidies to ISPs in urban areas and other competitive markets seem unjustifi-able. Second, if private firms stay out of rural areas they do so for sound economic reasons. Only com-pelling social benefits justify ignoring these reasons. Some critics charge that ISPs are already receiving a large implicit subsidy by not paying for access.24 Are the social benefits of extending ISPs further sub-sidies, even if those subsidies are targeted, worth an increase in these social expenses?
Finally, a series of related and still unsettled ques-tions concern the implicaques-tions of the unobserved strategies of the five types of firms. Do value-added services, pricing, and quality differ by geography? If so, is this problematic for policies of universal access? Do rural/local and urban/local firms differ substan-tially in quality? If so, could, and should, any govern-ment body do anything about it? Will rural markets be served only by rural/local or regional firms and never have access to the features provided by urban/local or urban/national firms? If some types of commercial firms locate in certain places but not others in a
com-24For example, contrast the very different proposals in Sidek and Spulber (1998) and in Garcia and Gorenflo (1997). The former call for an end to implicit subsidies, and the latter comes close to calling for subsidies for rural ISP service.
plex pursuit of profits, could a government change this through subsidies and other mandates? These are not simple questions. These are the types of ques-tions that ISP policy needs to address so as to make headway on resolving the universal service debate in Internet technologies.
6.3. Future consolidation and universal access
It is common in the business trade press to predict consolidation of ownership of the ISP industry. On one level, this study suggests that these predictions have no economic basis. Multiple firms survive in this industry, and some appear to have a strong local com-ponent, which would suggest little scope for national consolidation of all firms. On the other hand, many firms have national networks and are trying strategies in which national branding plays a large role. If those national brand names begin to take on value, either because they stand in for higher quality, more reliabil-ity, or some other difference in service that cannot be imitated by a local firm, then consolidation will occur. There appears to be much room for consolidation within this industry. There are scores of national providers and thousands of local ISPs. The ISP ac-cess market could experience hundreds of mergers in ISPs or alliances between sets of ISPs and not come close to violating any potential antitrust statute. Nor would many potential consolidations of ISP firms excessively concentrate access in too few hands.25 That said, as of Fall 1997, there is an important local component to the industry. Consolidations that do not concentrate market share at the national level may concentrate access in a local market.
Consolidation will not influence access in rural areas if local ISPs continue to be the predominant provider of access in remote regions. However, if 25Two caveats apply to this observation. First, as has been noted by other authors (McKnight and Bailey (1997) and several articles therein, such as Sringanesh (1997)), there are potential bottlenecks in many facets of the backbone of the network. Concentrated ownership of these bottlenecks could have consequences for market power in this industry. The text only pertains to the downstream industry. Second, these numbers only speak to concentration in POPs, not market share. By some estimates the AOL/Compuserve merger gives one firm somewhere between 40 and 50% of the residential access market (Maloff Group International Inc., 1997). It is an open issue whether the alternative POPs discipline AOL’s pricing (The Economist, 1997).
national and local ISPs begin to diverge in quality over time, and if the industry does not remain as fragmented as it is today, the concentration of the industry could raise issues over universal access to high quality services.
7. Conclusions
The commercial Internet access industry has an important geographic component which correlates with features of market structure, quality of service, pricing and competitiveness. As a result, most of the important issues in the universal access debate also have an important geographic component. The links between geographic coverage and market structure arise because an ISP, whether it is national, regional or local, simultaneously chooses several important dimensions of firm strategy, including the geographic coverage of the firm. These choices involve many tradeoffs between the costs of providing a service, the strategies of the firm for growth, and the revenues generated by those decisions.
The location pattern we observe in the Fall of 1997, particularly the failure of ISP service to spread to all parts of the country, is consistent with the existence of economies of scale at the POP. Related strategic deci-sions induced variance in market structure in different regions of the country. The end result is that most of the population faces competitive supply of Internet ac-cess, while the remainder faced less ideal conditions in some rural areas.
These structural and strategic differences should be central issues in policy discussions of universal access to advanced communications and computing technol-ogy. Many issues will remain unresolved until future research on access analyzes the precise determinants of firm entry and expansion strategies. How important is the presence of a wealthy or educated population? How important is the presence of advanced telecom-munications infrastructure or a major educational in-stitution? The answers to these questions are the key to understanding different patterns in different regions. Thus, these answers are the key to properly structur-ing policies.
Finally, these patterns are remarkable in histori-cal perspective. Universal service in telephony took decades to achieve, and then only occurred after
con-siderable wrangling over subsidies for rural telephony and after the adoption of policies for interconnect-ing rural telephone companies with the dominant long-distance firm, AT&T. In contrast, ISPs retrofit their businesses onto the existing public-switch net-work with relatively low transaction costs in most places, enabling a small scale provider to succeed in low-density areas. Also, unlike telephony, the ISP industry did not require an entirely new equip-ment industry; instead, it relied primarily on existing equipment suppliers in PC markets, the established computer bulletin board market and local area net-work markets. Such qualifications require further understanding, since it is not as obvious that these conditions will persist. Hence, the fast and perva-sive diffusion of dial-up access may not serve as an example for the diffusion of the next generation of commercial broadband Internet access.
Acknowledgements
This study was funded by the Institute for Govern-ment and Public Affairs at the University of Illinois and by a Mellon Small Grant in the Economics of In-formation at the Council on Library Resources. We appreciate comments from Amy Almeida, Tim Bres-nahan, Linda Garcia, Zvi Griliches, Padmanabhan Sri-nagesh, Pablo Spiller, Dan Spulber, Scott Stern, John Walsh, Wes Cohen, and participants at the NBER pro-ductivity lunch seminar, Stanford Computer Indus-try Project seminar, Northwestern Communications Colloquia, University of Kansas Technology Semi-nar, Consortia for Telecommunication Policy Research 1998 conference in Ann Arbor, and participants at the Harvard Information Infrastructure Project workshop on The Impact of the Internet on Communications Policy. Howard Berkson, Heather Radach, Holly Gill and Helen Connolly provided excellent research as-sistance at various stages. We would especially like to thank Angelique Augereau for her extraordinary re-search assistance in the final stages. The authors take responsibility for all remaining errors.
References
Augereau, A., Greenstein, S.M., 2000. The need for speed in emerging communications markets: upgrades to advanced
technology at internet service providers. International Journal of Industrial Organization, 1085–1102.
Barnett, W.P., 1990. The organizational ecology of a technological system. Administrative Science Quarterly 35, 31–60. Barnett, W.P., 1997. The dynamics of competitive intensity.
Administrative Science Quarterly 42, 128–160.
Baum, J.A.C., Korn, H.J., Kotha, S., 1995. Dominant designs and population dynamics in telecommunications services: founding and failure of the facsimile transmission service organization, 1965–1992. Social Science Research 24, 97–135.
Boardwatch, 1997. March/April Directory of Internet Service Providers. Boardwatch, Littleton, CO.
Cherry, B.A., Wildman, S.S., 1999. Review of federal universal service policy in the US. In: Cherry, B.A., Wildman, S.S., Hammond, A.S. IV (Eds.), Making Universal Service Policy: Enhancing the Process Through Multidisciplinary Evaluation. Lawrence Erlbaum Associates, Hillsdale, NJ.
Clemente, P.C., 1998. The State of the Net: The New Frontier, McGraw-Hill, New York.
Compaine, B., 2001. Re-examining the digital divide. In: Compaine, B., Greenstein, S.M. (Eds.), Communications Policy in Transition: The Internet and Behond. MIT Press, Cambridge, MA.
Compaine, B., Weinraub, M., 1997. Universal access to online services: an examination of the issue. Telecommunications Policy 21 (1), 15–33.
Drake, W., 1995. The New Information Infrastructure: Strategies for US Policy. The Twentieth Century Fund Press, New York. Garcia, D.L., 1996. Who? What? Where? A Look at Internet Deployment in Rural America. Rural Telecommunications, November/December, pp. 25–29.
Garcia, D.L., Gorenflo, N., 1997. Best practices for rural internet deployment: the implications for universal service policy. In: Proceedings of the Presentation at the Telecommunications Policy Research Conference, Mimeo, September 1997. Greenstein, S.M., 2000. Commercialization of the Internet: the
interaction of public policy and private actions. In: Jaffe, A., Lerner J., Stern, S. (Eds.), Innovation, Policy and the Economy. MIT Press, Cambridge, MA.
Hoovers, 1997. Hoovers Guide to Computer Companies. Hoovers Business Press, Austin, TX.
Information Infrastructure Task Force, 1993. The National Information Infrastructure: Agenda for Action, Information Infrastructure Task Force. Washington, DC (http://metalab. unc.edu/nii/toc.html).
Information Infrastructure Task Force, 1994. National Information Infrastructure: Progress Report September 1993–1994. Information Infrastructure Task Force, Washington, DC. Juliussen, K.P., Juliussen, E., 1996. The 7th Annual Computer
Industry Almanac. The Reference Press, Austin, TX. Kahin, B., 1991. Building Information Infrastructure: Issues in
the Development of National Research and Education Network. McGraw-Hill Primis, New York.
Kahin, B., Keller, J., 1995. Public Access to the Internet. The MIT Press, Cambridge, MA.
Kalil, T., 1995. Public policy and the national information infrastructure. Business Economics 30 (4), 15–20.
Kridel, D., Rappaport, P., Taylor, L., 1997. The Demand for Access to Online Services and the Internet. Mimeo, PNR Associates, Jenkintown, PA.
Maloff Group International Inc., 1997. 1996–1997 Internet Access Providers Marketplace Analysis. Maloff Group International Inc., Dexter, MO.
McKnight, L.W., Bailey, J., 1997. Internet Economics. MIT Press, Cambridge, MA.
Mueller, M.J., 1997. Universal Service: Competition, Inter-connection, and Monopoly in the Making of the American Telephone System. MIT Press, Cambridge, MA.
National Academy of Engineering, 1995. Revolution in the US Information Infrastructure. National Academy Press, Washington, DC.
National Research Council, 1996. The Unpredictable Certainty: Information Infrastructure Through 2000. National Academy Press, Washington, DC.
National Telecommunications and Information Administration, 1995. Connecting the Nation: Classrooms, Libraries, and Health Care Organizations in the Information Age. US Department of Commerce, Washington, DC (http://www.ntia. doc.gov/connect.html).
National Telecommunications and Information Administration, 1999. Falling Through the Net: Defining the Digital Divide. US Department of Commerce, Washington, DC (http://www.ntia. doc.gov/ntiahome/fttn99/contents.html).
National Telecommunications and Information Administration, 2000. Falling Through the Net: Towards Digital Inclusion. A Report on Americans’ Access to Technology Tools, US Department of Commerce, Washington, DC (http://search.ntia. doc.gov/pdf/fttn00.pdf).
Nicholas, K.H., 2000. Digital arroyas and imaginary fences: assessing the impact of public policy. Communications Technologies and Commercial Investment on Internet Access in Rural Texas, PhD Dissertation, University of Texas at Austin, Austin, TX.
Sidek, G., Spulber, D., 1998. Cyberjam: the law and economics of Internet congestion of the telephone network. Harvard Journal of Law and Public Policy 21 (2), 327–394.
Sringanesh, P., 1997. Internet cost structures and interconnections agreements. In: McKnight, L.W., Bailey J. (Eds.), Internet Economics. MIT Press, Cambridge, MA.
Stapleton, P., 1997. ISP$ Market Report: Are Dial-Up Subscribers Worth $280 per Head? Boardwatch 11(5), May (http://boardwatch.internet.com/mag/97/may/bwm58.html). Stark, T., 1997. @Internet: A Tale of Two ISPs. Boardwatch 11(8),
August
(http://boardwatch.internet.com/mag/97/aug/bwm47.html). Strover, S., 2001. Rural Internet connectivity. Telecommunications
Policy 25 (5).
Teske, P., 1995. American Regulatory Federalism and Telecomm-unications Infrastructure. Lawrence Erlbaum Associates, Hillsdale, NJ.
The Economist, 1997. Internet service providers, making a business of the bit buffet. The Economist, 8 March.
US Advisory Council on the National Information Infrastructure, 1996. A Nation of Opportunity: Realizing the Promise of
the Information Superhighway. US Department of Commerce, Washington, DC.
US Department of Commerce Bureau of the Census, 1992. Contiguous County File, 1991: US. Inter-University Consortium for Political and Social Research, Ann Arbor, MI.
Weiman, D.F., 2000. Building universal service in the early bell system: the reciprocal development of regional urban
systems and long distance telephone networks. In: Sundstrom W. (Ed.), History Matters: Economic Growth, Technology and Population. MIT Press, Cambridge, MA.
Werbach, K., 1997. Digital Tornado: The Internet and Telecomm-unications Policy. Federal Communications Commission, Office of Planning and Policy Working Paper 29, Federal Communications Commission, Washington, DC.