NUREG/CR-6893
Modeling Adsorption
Processes: Issues in
Uncertainty, Scaling, and
Prediction
U.S. Nuclear Regulatory Commission
Office of Nuclear Regulatory Research
Washington, DC 20555-0001
AVAILABILITY OF REFERENCE MATERIALS IN NRC PUBLICATIONS
NRC Reference Material
As of November 1999, you may electronically access NUREG-series publications and other NRC records at NRC’s Public Electronic Reading Room at
http://www.nrc.gov/reading-rm.html. Publicly released records include, to name a few, NUREG-series publications; Federal Register notices; applicant, licensee, and vendor documents and correspondence; NRC correspondence and internal memoranda; bulletins and information notices; inspection and investigative reports; licensee event reports; and Commission papers and their attachments. NRC publications in the NUREG series, NRC regulations, and Title 10, Energy, in the Code of Federal Regulations may also be purchased from one of these two sources.
1. The Superintendent of Documents U.S. Government Printing Office Mail Stop SSOP
Washington, DC 20402–0001 Internet: bookstore.gpo.gov Telephone: 202-512-1800 Fax: 202-512-2250
2. The National Technical Information Service Springfield, VA 22161–0002
www.ntis.gov
1–800–553–6847 or, locally, 703–605–6000 A single copy of each NRC draft report for comment is available free, to the extent of supply, upon written request as follows:
Address: Office of the Chief Information Officer, Reproduction and Distribution
Services Section
U.S. Nuclear Regulatory Commission Washington, DC 20555-0001 E-mail: [email protected] Facsimile: 301–415–2289
Some publications in the NUREG series that are posted at NRC’s Web site address
http://www.nrc.gov/reading-rm/doc-collections/nuregs are updated periodically and may differ from the last printed version. Although references to material found on a Web site bear the date the material was accessed, the material available on the date cited may
subsequently be removed from the site.
Non-NRC Reference Material
Documents available from public and special technical libraries include all open literature items, such as books, journal articles, and transactions, Federal Register notices, Federal and State legislation, and congressional reports. Such documents as theses, dissertations, foreign reports and translations, and non-NRC conference proceedings may be purchased from their sponsoring organization.
Copies of industry codes and standards used in a substantive manner in the NRC regulatory process are maintained at—
The NRC Technical Library Two White Flint North 11545 Rockville Pike Rockville, MD 20852–2738
These standards are available in the library for reference use by the public. Codes and standards are usually copyrighted and may be purchased from the originating organization or, if they are American National Standards, from—
American National Standards Institute 11 West 42nd Street
New York, NY 10036–8002 www.ansi.org
Legally binding regulatory requirements are stated only in laws; NRC regulations; licenses, including technical specifications; or orders, not in
NUREG-series publications. The views expressed in contractor-prepared publications in this series are not necessarily those of the NRC.
The NUREG series comprises (1) technical and administrative reports and books prepared by the staff (NUREG–XXXX) or agency contractors (NUREG/CR– XXXX), (2) proceedings of conferences (NUREG/CP– XXXX), (3) reports resulting from international agreements (NUREG/IA–XXXX), (4) brochures (NUREG/BR–XXXX), and (5) compilations of legal decisions and orders of the Commission and Atomic and Safety Licensing Boards and of Directors’ decisions under Section 2.206 of NRC’s regulations (NUREG– 0750).
212–642–4900
DISCLAIMER: This report was prepared as an account of work sponsored by an agency of the U.S. Government.
Neither the U.S. Government nor any agency thereof, nor any employee, makes any warranty, expressed or implied, or assumes any legal liability or responsibility for any third party’s use, or the results of such use, of any information, apparatus, product, or process disclosed in this publication, or represents that its use by such third party would not infringe privately owned rights.
NUREG/CR-6893
Modeling Adsorption
Processes: Issues in
Uncertainty, Scaling, and
Prediction
Manuscript Completed: December 2005
Date Published: February 2006
Prepared by
L.J. Criscenti
1, M. Eliassi
1, R.T. Cygan
1, C.F. Jové Cólón
S. Goldberg
2 1Sandia National Laboratories
Albuquerque, NM 87185
2
USDA-ARS
George E. Brown Jr. Salinity Laboratory
Riverside, CA 92507
E.O’Donnell, NRC Project Manager
Prepared for
Division of Systems Analysis and Regulatory Effectiveness
Office of Nuclear Regulatory Research
U.S. Nuclear Regulatory Commission
Washington, DC 20555-0001
iii
ABSTRACT
Adsorption of contaminant species to mineral surfaces is largely responsible for the retardation of radionuclides in the subsurface environment. However, despite much research effort, the advancement of models that can be used to successfully calculate or predict adsorption is still somewhat limited. This report covers three different aspects of modeling adsorption of
radionuclides with an emphasis on the use of surface complexation models (SCM). The
methods provide a rigorous and thermodynamic-based alternative to the more conventional and
empirical KD approach often used inappropriately in the performance assessment of nuclear
waste sites.
The first study provides an example of how adsorption constant uncertainty propagates through a one-dimensional reactive-transport code and can strongly influence the calculated aqueous metal (i.e., uranyl) concentrations as a function of distance and time from a contaminant source. In this study, the hydrology and mineralogy of the Naturita uranium mill tailings site in Colorado are used to establish initial conditions and processes to incorporate into a one-dimensional (1-D) reactive-transport model. An electrostatic surface complexation model is used to describe adsorption onto smectite, an abundant clay mineral at the Naturita site. A probabilistic
investigation demonstrates that uncertainty in adsorption constants can dramatically change the calculated shape of contaminant concentration profiles. This study demonstrates the
importance of selecting appropriate adsorption constants when using reactive-transport models in performance assessment to evaluate risk and pollution attenuation at contaminated sites. Adsorption processes at the solid-water interface can be investigated at different levels of chemical detail: electronic, atomistic, and thermodynamic. The second study addresses this scaling issue by describing how electronic- and atomic-scale investigations provide useful insight for the development of accurate bulk thermodynamic models (for example, SCM). Molecular modeling can be used to investigate the stoichiometries and relative adsorption energies of possible surface complexes. Both quantum and molecular mechanics calculations that focus on the submicroscopic details of the adsorption process can provide us with new, more quantitative ways to bound the uncertainties associated with “averaging” surface site characteristics and for selecting only one or two surface reactions to describe the adsorption of a contaminant over a range of environmental conditions. These atomic-scale studies may provide us with a more definitive appreciation for how detailed an SCM is necessary for accurate reactive-transport simulations of contaminant migration.
The third study reviews recent progress in developing an internally-consistent database to describe adsorption over a wide range of solution and solid compositions. Substantial progress has been made to establish a database for a specific SCM (triple-layer model). Newly-defined standard states for surface species allow us to normalize and compare experimental adsorption data collected using different solid to liquid ratios. X-ray standing-wave measurements, X-ray
absorption spectroscopy, molecular modeling, and ab initio modeling all contribute to a greater
understanding of surface complexation, and in particular, to the nature of contaminant surface species that need to be incorporated into larger-scale thermodynamic models. Combining
approaches ranging from bulk adsorption measurements to ab initio quantum calculations in our
investigation of processes at the solid-water interface and synthesizing information for different interfacial systems, may lead to major breakthroughs in adsorption modeling in the next decade.
FOREWORD
The U.S. Nuclear Regulatory Commission (NRC) uses environmental models to evaluate the potential release of radionuclides from NRC-licensed sites. In doing so, the NRC recognizes that, at many sites, groundwater-related pathways could contribute significantly to the potential doses received by
members of the public. Consequently, consistent with its mission to protect the health and safety of the public and the environment, the NRC and others have developed contaminant transport models to predict the locations and concentrations of radionuclides in soil as a function of time.
Because many radionuclides temporarily attach, or adsorb, to the surfaces of soil particles, their mobility is reduced compared to that of compounds that move with the groundwater without interacting with soil surfaces. As a result, most subsurface-transport models used by the NRC and its licensees estimate the effects of the anticipated interactions between radionuclides and solids in the ground. Toward that end, these subsurface-transport models use a "distribution coefficient," which is assumed to be constant and reflects the proportion of radionuclide in the groundwater compared to the
radionuclide associated with the solids in the ground. These distribution coefficients are widely used by licensees and consequently, the relevant literature documents ranges of their values for various soil types and radionuclides. However, the ranges can be very large because the chemical reactions that cause radionuclides to attach to solids are very sensitive to water chemistry and soil mineralogy. As a result, uncertainties in the parameters used to characterize the adsorption of radionuclides in soils have been identified as a major source of uncertainty in decommissioning, uranium recovery, and radioactive waste disposal cases evaluated by the NRC.
Surface-complexation and ion-exchange models offer a more realistic approach to considering soil-radionuclide interactions in performance assessment models. These models can also account for variable chemical environments that might affect such interactions.
The focus of this report is a probabilistic analysis of adsorption parameter uncertainty and its influence on radionuclide migration. Toward that end, the report provides an example of how uncertainty in adsorption constants can influence estimates of contaminant plume migration, reviews how atomic-scale studies of the solid-water interface can improve the development of bulk adsorption models, and describes recent progress toward developing a systematic thermodynamic database for metal
adsorption on soil minerals. This report will help the staff define realistic site-specific ranges of the distribution coefficient values used to evaluate NRC licensed sites.
The views and opinions presented in this report are those of the individual authors, and the publication of this report does not necessarily constitute NRC approval or agreement with the information
contained herin. As such, this report is not a substitute for NRC regulations. The approaches and/or methods described are provided for information only, and compliance is not required. Moreover, use of product or trade names herein is for identification purposes only and does not constitute endorsement by the NRC or Sandia National Laboratories.
________________________________ Carl J. Paperiello, Director
Office of Nuclear Regulatory Research v
vi
viii
CONTENTS
Page Abstract...iii Foreword... v 1. Introduction...1-1 2. Effects of Adsorption Constant Uncertainty on Contaminant Plume Migration...2-12.1 Abstract ...2-1 2.2 Introduction ...2-1
2.3 Governing Equations...2-2
2.4 Geochemical Model ...2-4
2.5 One-Dimensional Simulations ...2-9
2.5.1 Effect of Grid Spacing on Numerical Solution ...2-10 2.5.2 Baseline Case for 1-D Simulations ...2-10 2.5.3 Uncertainty Analysis: Latin Hypercube Sampling ...2-14 2.5.4 Results of Uncertainty Analysis ...2-14 2.6 Illustrative Two-Dimensional Simulations ...2-23 2.7 Conclusions ...2-23 2.8 Acknowledgments ...2-25
3. Adsorption Processes: At What Spatial Scale Do We Need to Understand Them?....3-1
3.1 Abstract ...3-1 3.2 Introduction ...3-1 3.3 Examples of Reactive-Transport Modeling with SCMs ...3-4 3.4 Scaling issues ...3-5 3.5 How Can Molecular Modeling Help? ...3-7
3.5.1 Surface Sites-H2O on Boehmite ...3-7
3.5.2 Pb2+ Adsorption onto Goethite from NaCl Solutions ...3-8
3.5.3 Ab initio Quantum Mechanics Calculations ...3-8 3.6 Conclusions ...3-9 3.7 Acknowledgments ...3-10
4. The Triple Layer Model and Surface Speciation ...4-1
4.1 Introduction ... 4-1 4.2 Triple Layer Model ...4-1 4.3 Obtaining Model Parameter Values ...4-3 4.3.1 Standard States for the Activities of Surface Species ...4-3 4.3.2 Surface Site Density ...4-5
4.3.3 Capacitances ...4-6
4.3.4 Protonation-Dissociation Constants ...4-7 4.3.5 Metal Surface Complexation Constants ...4-8 4.4 Establishing Ion Adsorption Mechanisms ...4-10 4.4.1 Ionic Strength Effects ...4-10 4.4.2 X-Ray Absorption Spectroscopy ...4-10
ix
4.4.3 X-Ray Reflectivity ...4-12 4.4.4 Ab initio and Molecular Modeling ...4-13 4.5 Summary ...4-14 4.6 Acknowledgments ...4-14
5. Conclusions ...5-1 6. References...6-1
x
Figures
Page
2.1 Aluminum surface sites found on a platelet of clay mineral ...2-8
2.2 Effect of grid spacing on uranium in fluid profiles, as a function of time, using X1t ...2-11
2.3 Baseline Case ...2-12
2.4 log K for >(e)AlOUO2+ versus those of >(e)AlO- for 100 pairs of values ...2-15
2.5 Initial concentrations for uranium in fluid versus (a) log K >(e)AlOUO2+ and ...2-16
2.6 Temporal development of concentration profiles for aqueous uranium ...2-17
2.7 Normalized concentration versus distance profiles of uranium in fluid ...2-18
2.8 Breakthrough curves at the down-stream boundary ...2-19
2.9 Breakthrough curves representing a C/Co~0.5 of uranium in fluid ...2-21
2.10 Comparison of normalized uranium in fluid with distance ...2-22 2.11 Map view of the results of twenty years of reactive transport of uranium...2-24
3.1 Simplified model of municipal landfill leachate migrating into an underlying aquifer...3-3
3.2 Triple-Layer Model ...3-3
3.3 ZnO (100) and (101) surface atoms protonated according to the revised MUSIC ...3-4
3.4 Normalized concentration profiles of uranium in fluid versus distance ...3-6
3.5 Boehmite (100) surface with 70 adsorbed water molecules ...3-8
3.6 Snapshot from 150 ps molecular dynamics simulation to examine lead adsorption...3-9
3.7 ∆E of complexation for the reaction Co2+ + Cl- = CoCl+...3-10
4.1 Correlations between adsorption constants and mineral properties ...4-15
Tables
Page
2-1 List of chemical species considered in geochemical model...2-5
1-1
1. INTRODUCTION
A major program objective of the U.S. Nuclear Regulatory Commission’s “Radionuclide Transport in the Environment Research Program” is to provide a defensible, science-based understanding of radionuclide migration and retardation for assessing contaminant transport in the environment. Performance assessment (PA) calculations are used to estimate radionuclide concentrations in ground and surface water, treat the uncertainty in those estimates, and evaluate the consequent dose impact to the public from NRC licensed activities. The PA calculations are used in the licensing and decommissioning of nuclear facilities and clean-up of contaminated sites, including reclamation of uranium mill tailings disposal sites. Current PA models use simplified conceptual models for radionuclide retardation that are based on linear
and reversible partition coefficients (KD’s) measured for a specific set of experimental
conditions, which usually are laboratory measurements of soil samples. Unfortunately, experience shows that this approach often fails to correlate with field measurements of actual
transport (e.g., Bethke and Brady, 2000). The reason is that the experimental KD’s represent
localized properties and are sometimes not applicable over time and at other locations
considering the range of nonlinear geochemical phenomena and chemical conditions that can significantly affect radionuclide transport (temperature, pH, fluid composition, ionic strength, mineral substrate, organic complexation, etc.). Therefore, it is critical to understand and model radionuclide retardation processes over a wide range of environmental conditions that are relevant to NRC licensing concerns. Since adsorption and desorption processes are important to radionuclide retardation in soils, they need to be addressed in PA models. Once radionuclide adsorption and desorption mechanisms are better understood, more appropriate retardation models such as surface complexation models can be incorporated into the PA to allow for
improved treatment of uncertainty when making estimates of dose to the public.
Despite the effort of the last ten to fifteen years, the development of conceptual models that can be used to successfully calculate or predict adsorption onto minerals is still very much in its infancy. Various chemical surface complexation models have been developed to describe potentiometric titration and metal adsorption data at an idealized oxide-solution interface. In
contrast to empirical KD methods, surface complexation models provide descriptions of metal
adsorption using an equilibrium approach that defines surface species, chemical reactions, mass balances, and charge balances. These models provide insight into the stoichiometry and reactivity of adsorbed species. Application of these models to reference oxide minerals has been extensive but their use in describing ion adsorption by clay minerals and mixed sediments that are typical of most NRC regulated waste sites is limited. Surface complexation models share at least four common assumptions: (1) oxide surfaces can be described as idealized and flat planes of surface hydroxyl sites and equations can be written to describe reactions at each of these specific surface sites; (2) reactions at surfaces are at local equilibrium and can be described using thermodynamic mass law equations; (3) variation in charge at the mineral surface is a direct result of chemical reactions at the surface; (4) the effect of surface charge on measured equilibrium constants can be calculated and the intrinsic equilibrium constants can be extracted from experimental measurements (see Section 4.1; Dzombak and Morel, 1990;
Koretsky, 2000).
This report covers three different aspects of modeling adsorption with an emphasis on the use of surface complexation models (SCM). Chapter 2 represents the joint work of L. J. Criscenti, M. Eliassi, R. T. Cygan, and C. F. Jové Cólón during the first two years of the project. It
1-2
provides an example of how adsorption constant uncertainty propagates through a one-dimensional reactive-transport code and can strongly influence the calculated aqueous metal (i.e., uranyl) concentrations as a function of distance and time from a contaminant source. The simulations are made using the hydrology and mineralogy of the Naturita uranium mill tailings site in Colorado to establish initial conditions and processes. An electrostatic surface
complexation model is used to describe adsorption onto smectite, an abundant clay mineral at the Naturita site. The simulations illustrate that uncertainty in adsorption constants can
dramatically change the calculated shape of contaminant concentration profiles. This study demonstrates the importance of selecting appropriate adsorption constants when using reactive-transport models to evaluate risk and pollution attenuation at contaminated sites. Chapter 3 was originally published as: L. J. Criscenti “Adsorption processes: At what spatial
scale do we need to understand them?” in the Proceedings of the 11th International Symposium
on Water-Rock Interaction, WRI-11, 27th June – 2 July 2004, Saratoga Springs, NY. Eds. R. B.
Wanty and R. R. Seal, A. A. Balkema Publishers, New York, and is reprinted here with permission of the publisher. This conference paper summarizes an invited talk for L. J. Criscenti and highlights her investigations into adsorption processes using different modeling approaches. Examples used in this chapter are taken from research sponsored by the Sandia National Laboratories Laboratory Directed Research and Development program, the DOE ASC program, the U.S. Nuclear Regulatory Commission, and the U.S. Department of Energy, Basic Energy Sciences program. The chapter describes how small-scale investigations provide useful insight for the development of accurate bulk thermodynamic models (i.e., SCM). For example, molecular modeling can be used to investigate the stoichiometries and relative adsorption energies of viable surface complexes. Both quantum and molecular mechanics calculations that focus on the atomic-level details of adsorption processes can provide us with detailed information about the relative importance of different interfacial variables in determining the likelihood of contaminant adsorption. These atomic-scale methods allow us a more critical approach for discriminating what types of data should be included in an SCM database for accurate reactive-transport simulations of radionuclide migration.
Chapter 4 represents a subset of material written by L. J. Criscenti and S. Goldberg for the draft white paper on reactive processes prepared by the Interagency Memorandum of Understanding Working Group 3: Subsurface Reactive Transport Modeling as well as a draft chapter on adsorption modeling written by S. Goldberg (U.S. Department of Agriculture, Agricultural Research Service) and L. J. Criscenti (Sandia National Laboratories) for an International Union of Pure and Applied Chemistry (IUPAC) volume. The MOU working group is part of a
collaborative effort of several government agencies to develop conceptual models for
subsurface reactive transport modeling of inorganic contaminants, radionuclides, and nutrients. Details of this collaboration and summaries from a recent reactive transport workshop are published on the internet (www.iscmem.org). The material presented in this last chapter emphasizes the work of Sverjensky and his students to develop an internally-consistent database for the Triple-Layer Model. The results of spectroscopic and molecular modeling studies are gradually being incorporated into an adsorption model that will be useful for reactive-transport simulations of contaminant migration.
2-1
2. EFFECTS OF ADSORPTION CONSTANT UNCERTAINTY ON
CONTAMINANT PLUME MIGRATION: ONE-DIMENSIONAL
NUMERICAL STUDIES
2.1 Abstract
This chapter is an update of Criscenti et al. (2002; NUREG/CR-6780). In this study, the
hydrology and mineralogy of the Naturita uranium mill tailings site in Colorado are used to establish initial conditions and processes to incorporate into a one-dimensional (1-D) reactive-transport model. This model describes adsorption using an electrostatic surface complexation approach. This study is the first to examine variations in reactive-transport model predictions due to uncertainties in the equilibrium constants associated with an electrostatic model for adsorption. This work demonstrates the importance of selecting appropriate adsorption constants when using reactive-transport models to evaluate risk and pollution attenuation at contaminated sites. In our simulations, uranium is removed from mill tailings leachate through adsorption onto smectite, an abundant clay mineral at the Naturita site. Uranium adsorbs to specific surface sites on both the basal planes and edges of the smectite. Because uranium
adsorbs predominantly to the aluminum edge surface sites [>(e)AlOH], we chose to examine
uncertainty only in the equilibrium constants associated with these sites. One-hundred pairs of
equilibrium constant (log K) values for the surface species >(e)AlO- and >(e)AlOUO
2+ were
selected from normal distributions of each log K using the Latin Hypercube Sampling method.
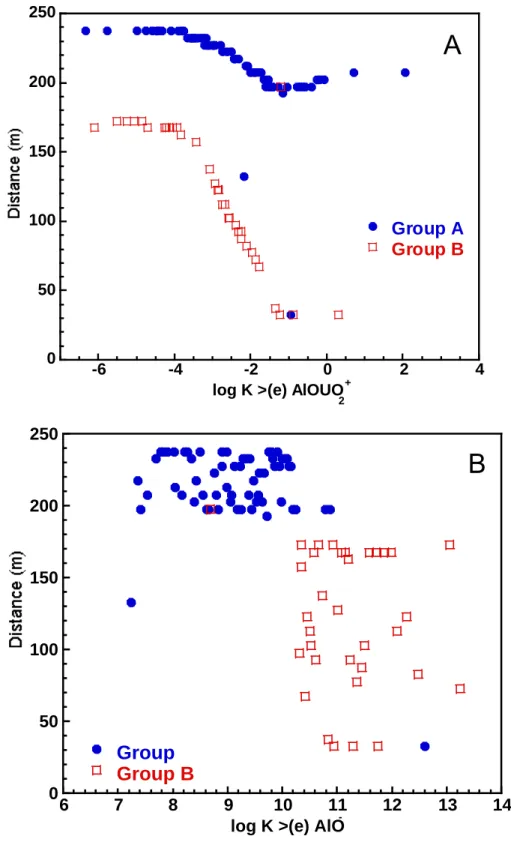
For the 1-D simulations, two distinct groups of uranium concentration versus distance profiles can be identified. In the first group, the concentration profiles exhibit a classical sigmoidal shape whereas in the second group the concentration profiles display higher uranium concentrations in solution over greater distances and times. These two groups are clearly
separated by two different ranges of log K >(e)AlO- values or two different ranges for the
smectite point of zero charge. Preliminary 2-D simulations also demonstrate that both transverse and longitudinal plume migration are influenced by the choice of adsorption
constants.
2.2 Introduction
This study builds upon recent investigations of uranium mill tailings sites where uranium [U(VI)] has leached into the surrounding soil for many years (e.g., Morrison and Cahn, 1991; Landa
and Gray, 1995; Zhu and Burden, 2001; Zhu et al., 2001, 2002; Bain et al., 2001). One site
under investigation is Naturita, Colorado where the Nuclear Regulatory Commission is working cooperatively with the U. S. Geological Survey and Sandia National Laboratories to investigate both hydrological and geochemical conditions as a function of time, and to assess the ability of surface complexation models coupled with hydrologic models to predict radionuclide migration
through the soil (Davis, 2001; Davis and Curtis, 2003; Davis et al., 2004; Curtis et al., 2004;
Jové-Cólón et al., 2001; Jacobs Engineering Group Inc., 1994; Kohler et al., 2004). Naturita is
one of several UMTRA (Uranium Mill Tailings Remedial Action) Title 1 sites where the mine tailings have been removed by the U.S. Government to reduce contaminant levels. However, lingering uranium dissolved in groundwater and adsorbed in shallow alluvium still remains, creating some concerns regarding the extent of contaminant transport within the site. In this study, coupled reactive-transport models are used to better conceptualize and predict uranium
2-2
migration at the contamination sites, with particular application to the hydrology and mineralogy associated with Naturita. This work demonstrates the importance of selecting the appropriate adsorption constants when using reactive-transport models to evaluate pollutant attenuation and potential risk at contaminated sites.
The issue of uncertainty analysis and its importance when using various mathematical models to describe contaminant migration in the subsurface environment is not a new one. Several
studies have investigated uncertainty in geochemical modeling (Criscenti et al., 1996; Stipp,
1990; Schecher and Driscoll, 1987, 1988; Nordstrom and Ball, 1989; Anderson, 1976). While reactive-transport modeling has also been used in the past to investigate the migration of uranium in mill tailings, such studies have primarily focused on examining the development of
reaction fronts due to mineral precipitation and dissolution (Zhu and Burden, 2001; Zhu et al.,
2001; Bain et al., 2001; Erikson et al., 1990). Several studies have also examined the
sensitivity of reactive-transport simulations to uncertainty in hydrological parameters (e.g.,
Hamed et al., 1996; Nitzsche et al., 2000).
More recently, Tebes-Stevens and Valocchi (2000) and Tebes-Stevens et al. (2001) have
studied the relative effects of transport and reaction parameters on the results of a solute transport model. Uranium(VI) hydrolysis species are transported through a two-dimensional
domain with a spatially variable pattern of surface complexation sites (Tebes-Stevens et al.,
2001). Using a non-electrostatic surface complexation model, their calculations indicated that the model is most sensitive to the initial concentration of one of two types of surface sites, the
formation constant for one of three uranyl (UO22+) surface complexes, and the hydraulic
conductivity within the reactive zone.
To the best of our knowledge, this is the first study to investigate the effects of uncertainty in two equilibrium adsorption constants in an electrostatic surface complexation model, on calculated contaminant plume migration using simple one- and two-dimensional (1-D and 2-D) reactive-transport models. Our investigation focused on examining uranium adsorption onto clay
surfaces, one of several possible retardation mechanisms at the Naturita site, and the influence of the adsorption constants on calculated uranium concentration versus distance profiles and plume migration. Adsorption onto other solid phases such as ferrihydrite has also been
suggested at the Naturita site (Davis et al., 2004). In addition, ongoing analytical research
suggests that uranium contamination at the Naturita site is strongly affiliated with iron-rich
coatings (Jové Cólón et al., 2005). Although in a real aquifer such as Naturita, adsorption of
fulvic and humic acids, other inorganic cations and anions, and bacterial exopolymers will compete with uranyl adsorption onto smectite, for the uncertainty analysis presented here, our model only considers uranyl and proton adsorption to two active adsorption sites, one each on the basal and edge surfaces of smectite clay. This simple model for uranyl adsorption is sufficient to demonstrate that uncertainties in adsorption constants can lead to widely differing predictions of uranium migration in the subsurface environment; differences that are sufficiently large that they can pose a problem when assessing the risk associated with contaminant migration from mill tailings.
2.3 Governing Equations
We consider the advective-dispersive-reactive (ADR) transport model in a 2-D system to evaluate the flow conditions for our reactive-transport system. Under water-saturated
conditions, the governing equation for ADR, described in 2-D tensor notation, can be stated as (Bethke, 1997a):
(
)
i k k i i l l m i lm l iQ
t
C
C
q
x
x
C
D
x
t
C
φ
φ
φ
φ
⎟
+
⎠
⎞
⎜
⎝
⎛
∂
∂
−
∂
∂
−
⎟⎟
⎠
⎞
⎜⎜
⎝
⎛
∂
∂
∂
∂
=
∂
∂
∑
(2.1)where
φ
is the porosity, Ci[M/L3] is the concentration of the transport component, i, t [T] is time,xl=(x,y) [L] represents the cartesian coordinates, Dlm [L2/T] is the dispersion tensor, ql [L/T] is the
specific discharge, subscripts m and l refer to the spatial directions, the term involving the
summation over k refers to the mass transfer among the various transport species, and Qi
[M/TL3] is the source/sink term which accounts for changes in solution composition due to
geochemical reaction.
The stoichiometry of each species in a geochemical system is described in terms of chemical components. The components in the system examined in this study include (1) water, the solvent species, (2) a mineral (i.e., smectite in our case) that is in equilibrium with the aqueous solution, (3) two gas phase species set at known fugacity, (4) aqueous species in solution representing the major cations and anions present, and (5) two different types of surface sites. Each independent reaction that forms an aqueous species in the system, has an associated
equilibrium constant Kj at the temperature of interest and therefore can be described by a mass
action equation.
Mass action equations are also written for each surface species within the framework of the diffuse-layer model (DLM) of Dzombak and Morel (1990). The DLM describes the mineral surface in terms of metal-hydroxyl sites that can react with ions in solution. It accounts explicitly for the electrical state of the mineral surface as it varies with the pH, ionic strength, and solution composition. In order for an ion to adsorb to the surface from solution, it must first move
through the electrical potential field created by the surface. Therefore, the mass action
equations for the DLM surface complexes include an electrostatic term
10
zqFΨ/2.303RT, where zq
is the electrical charge on each complex q, F [96,485 C/mol] is the Faraday constant, Ψ[V] is
the surface potential, R [8.3143 V·C/mol·K where 1 V·C = 1 Joule] is the gas constant, and T [K]
is absolute temperature.
The mass action equations are incorporated into mass balance equations that express the
conservation of mass in terms of mole number for water (Mw), each component (Mi), mineral
(Mk), gas (Mm), and site type (Mp). The mass balance equations form a set of governing
equations that describe multicomponent equilibrium in the presence of an adsorbing mineral surface.
The principle of electroneutrality requires that the ionic species in aqueous solution remain
charge balanced on a macroscopic scale. This requirement is met by adjusting Mi for one
component in a manner analogous to that used in other geochemical codes [e.g., EQ3NR (Wolery, 1992); GEOSURF (Sahai and Sverjensky, 1998)]. By default this component is
chloride (Cl-) because it is in abundant concentration and because most commercial
laboratories report a chloride concentration calculated by a rough charge balance (Bethke,
1996). In this study either Cl- or SO
42-, another major anion in uranium mill-tailings leachate, is
used as the charge-balancing anion.
2-4
To numerically solve the system of transport and geochemical equations, we use the Xt
software codes [X1t and X2t software codes for 1-D and 2-D simulations, respectively (Bethke,
1997a, b]. In the Xt package, the spatial derivatives of transport equations are discretized based on the cell-centered finite difference method. Additionally, Xt uses the Strang operator splitting approach in the ADR to advance the time step, where the flow equation is first solved to arrive at the nodal hydraulic potential values, and thus compute the flux between two neighboring nodes. Next, the ADR equations are solved using explicit time stepping, where the spatial averaging across cell boundaries is performed by first-order upwind weighting. We should note that to ensure numerical stability, Xt also calculates the time-step size based on a combination of the Courant condition for the advective and von Neumann’s criterion for the dispersive components of the transport equations.
The numerical methods used to solve the geochemical equations in X1t and X2t have been described by Bethke (1996, 1998) and are analogous to those used in the geochemical codes
MINEQL (Westall et al., 1976), HYDRAQL (Papelis et al., 1988), and MINTEQA2 (Allison et al.,
1991). To summarize, at each time step, equilibrium speciation and partitioning between the solid matrix, mineral surfaces, and aqueous solution are calculated using a Newton-Raphson iteration method (Bethke, 1996). The Newton-Raphson iteration step is complicated by the
need to account for the surface charge and potential when setting values for mq. Westall (1980)
was the first to develop an algorithm treating the surface potential as a basis species. An additional calculation is performed at each step in the Newton-Raphson iteration to locate the appropriate surface potential.
2.4 Geochemical Model
Because of our interest in the Naturita field site, we developed both 1-D and 2-D conceptual models that mainly focus on uranium migration in the subsurface environment. In our models, the initial system consists of an aqueous solution that is in equilibrium with a clay mineral comprised of basal and edge surfaces; we assume there is no interlayer exchange with
uranium. This equilibrium system is buffered by CO2 and O2 reservoirs representative of an
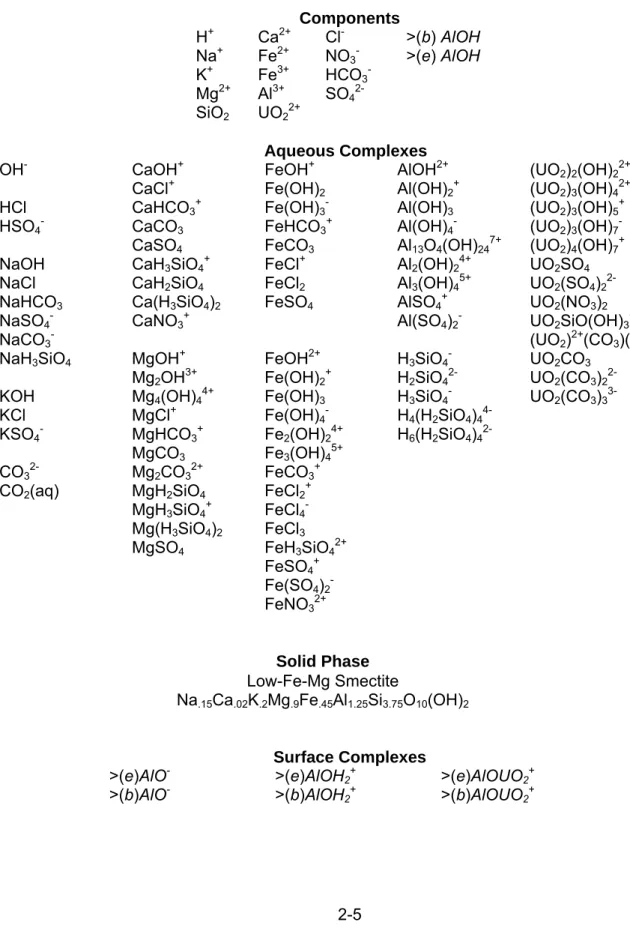
aquifer environment. A complete list of the chemical species considered in our conceptual models is provided in Table 2.1.
In the 1-D conceptual model, leachate from the uranium mill tailings is assumed to have already saturated the subsurface porous system with uranium. Therefore uranium is initially distributed homogeneously in the subsurface. The initial groundwater composition (see Table 2.2) reflects
prior mixing with uranium mill tailings leachate; it contains much higher concentrations of SO4
2-(1500 mg/kg), Cl- (84 mg/kg), Na+ (230 mg/kg), Ca2+ (209 mg/kg), and Mg2+ (61 mg/kg) than are
typically present in natural groundwater. This composition is representative of water samples collected downstream from the Naturita site during 1999 by the U. S. Geological Survey (Kohler
et al., 2004, Davis et al., 2004). The inlet rainwater composition is that reported by Berner and Berner (1996) for precipitation in the inland western United States. We examine the mixing of the rainwater with contaminated groundwater in the 1-D model, similar to what is occurring at Naturita today.
2-5
Table 2.1 List of chemical species considered in geochemical model
Components H+ Ca2+ Cl- >(b) AlOH Na+ Fe2+ NO 3- >(e) AlOH K+ Fe3+ HCO 3 -Mg2+ Al3+ SO 4 2-SiO2 UO22+ Aqueous Complexes
OH- CaOH+ FeOH+ AlOH2+ (UO
2)2(OH)22+
CaCl+ Fe(OH)
2 Al(OH)2+ (UO2)3(OH)42+
HCl CaHCO3+ Fe(OH)3- Al(OH)3 (UO2)3(OH)5+
HSO4- CaCO3 FeHCO3+ Al(OH)4- (UO2)3(OH)7
CaSO4 FeCO3 Al13O4(OH)247+ (UO2)4(OH)7+
NaOH CaH3SiO4+ FeCl+ Al2(OH)24+ UO2SO4
NaCl CaH2SiO4 FeCl2 Al3(OH)45+ UO2(SO4)2
2-NaHCO3 Ca(H3SiO4)2 FeSO4 AlSO4+ UO2(NO3)2
NaSO4- CaNO3+ Al(SO4)2- UO2SiO(OH)3+
NaCO3- (UO2)2+(CO3)(OH)3
-NaH3SiO4 MgOH+ FeOH2+ H3SiO4- UO2CO3
Mg2OH3+ Fe(OH)2+ H2SiO42- UO2(CO3)2
2-KOH Mg4(OH)44+ Fe(OH)3 H3SiO4- UO2(CO3)3
3-KCl MgCl+ Fe(OH)
4- H4(H2SiO4)4
4-KSO4- MgHCO3+ Fe2(OH)24+ H6(H2SiO4)4
MgCO3 Fe3(OH)45+
CO32- Mg2CO32+ FeCO3+
CO2(aq) MgH2SiO4 FeCl2+
MgH3SiO4+ FeCl4
Mg(H3SiO4)2 FeCl3
MgSO4 FeH3SiO42+
FeSO4+ Fe(SO4)2 FeNO32+ Solid Phase Low-Fe-Mg Smectite Na.15Ca.02K.2Mg.9Fe.45Al1.25Si3.75O10(OH)2 Surface Complexes >(e)AlO- >(e)AlOH 2+ >(e)AlOUO2+ >(b)AlO- >(b)AlOH 2+ >(b)AlOUO2+
2-6
Table 2.2 Initial Groundwater, rainwater, and leachate compositions used in 1-D and 2-D simulations 1-D Simulations 2-D Simulations Contaminated Groundwater Rainwater Initial Groundwater Incoming Groundwater Leachate pH 7 5.8 7 7 7 fCO2 (atm) 10-2.5 10-3.5 10-2.5 10-2.5 10-2.5 fO2 (atm) 0.2 0.2 0.2 0.2 0.2 Na+ (mg/kg) 226 0.4 25 25 226 K+ (mg/kg) 7.85 0.2 2 2 7.85 Mg2+ (mg/kg) 60.5 0.1 20 20 60.5 Ca2+ (mg/kg) 209 1.4 70 70 209 Fe2+ (mg/kg) 0.10 1 x 10⁻⁸ 0.10 0.10 0.10 Fe3+ (mg/kg) 0.01 1 x 10⁻⁸ 0.01 0.01 0.01 UO22+ (mg/kg) 3.14 1 x 10-32 1 x 10⁻⁶ 1 x 10⁻⁶ 3 SiO2 (aq) (mg/kg) 12 1 x 10⁻⁸ 10.7 10.7 12 Cl- (mg/kg) 84 (810)1 0.41 (0.61)1 11 11 84 (68) NO3- (mg/kg) 0.03 1.20 0.03 0.03 0.03 SO42- (mg/kg) 1500 3.0 315 (1210)1 315 (260)1 1100 Al3+ (mg/kg) 0.0132 1 x 10⁻⁸ 0.0132 0.013 0.013
1() indicates concentration after charge balance. These new concentrations are well within the
range reported at the Naturita site.
2Concentration of Al3+ that is in equilibrium with low-Fe-Mg smectite.
The 2-D conceptual model examines a somewhat different application, where contaminant is leached from a point source into the uncontaminated groundwater. This scenario is
representative of the processes associated with the initial development of a uranium
groundwater plume. For this second model, the initial groundwater composition is characteristic of those reported at wells upstream from the uranium mill-tailings at the Naturita site. This groundwater composition is assumed to be constantly flowing through the domain. An injection well in the model represents a point source of contamination from which leachate with the composition of the currently contaminated groundwater at the Naturita site is injected into the system.
In order to investigate the effects of adsorption constant uncertainty on uranium migration, the soil in both the 1-D and 2-D conceptual models is represented by a clay mineral, smectite (2.5% by volume), and an inert solid (97.5%). The precipitation and dissolution of other phases like hydrous ferric oxide and gypsum that might occur in this system are neglected. In addition, our model only considers uranium adsorption to one solid phase although uranium may adsorb to several solid phases at the Naturita site, such as ferrihydrite. The mineral selected as a representative clay substrate, is a low-Fe-Mg smectite, with a composition given by
Na0.15Ca0.02K.2Mg0.9Fe0.45Al1.25Si3.75O10(OH)2, that forms according to the following fundamental
reaction: 0.29 Fe2+ + 0.16 Fe3+ + 0.02 Ca2+ + 0.2 K+ + 0.15 Na+ + 0.9 Mg2+ + 1.25 Al3+ + 3.75 SiO 2(aq) + 4.5 H2O ↔ (2.2) 7 H+ + Na 0.15Ca0.02K.2Mg0.9Fe0.45Al1.25Si3.75O10(OH)2
with an association constant of 10-11.5537 (log K = -11.5537) at 25oC that is reported in the
thermodynamic database contained in Geochemist’s Workbench 3.0 (Bethke, 1998). Smectite is a layered sheet aluminosilicate containing thin platelets of alumina octahedra and silica
tetrahedra coordinated to interlayer cations (i.e., Na+, K+, Ca2+, Fe2+,Fe3+, and Mg2+).
Recent molecular modeling of cesium adsorption on kaolinite (Cygan et al., 1998), a simpler
clay mineral, suggests that cesium adsorbs directly to the Al octahedra on the (100), (010), and (110) surface edges of kaolinite and is coordinated to four aluminols to form a strong inner-sphere complex. Similar reactive surface sites are suggested for the smectite clays. Zachara
and McKinley (1993) and McKinley et al. (1995) fit bulk data for uranyl adsorption onto smectite
minerals using a computational model that includes fixed-charge sites and edge aluminum hydroxyls. A different surface complexation model, the triple-layer model (TLM, Davis and
Leckie, 1978, Davis et al., 1978), was applied to edge-site complexation. The uranyl adsorption
data is consistent with a surface speciation scheme dominated by ion exchange and aluminol
edge complexation (>AlOUO2+, where > indicates that the species is bound to the surface).
More recent spectroscopic work (Hennig et al., 2002) also suggests that uranyl adsorption
occurs preferentially to aluminol groups on montmorillonite. Therefore, as a first approximation, we assume that the uranyl cation only binds to the Al surface sites of smectite.
These surface sites are divided into two groups with different characteristics based on whether
they occur on the basal planes or edges of smectite (Fig. 2.1). Following Pabalan et al. (1998),
who developed a model for the adsorption of uranyl onto montmorillonite derived from
experimental data, we assume a total surface site density of 2.53 sites/nm2, similar to the value
of 2.3 sites/nm2 recommended by Davis and Kent (1990) for all minerals and by Dzombak and
Morel (1990) for ferrihydrite.
For ferrihydrite, Dzombak and Morel (1990) used two different types of surface sites – high affinity and low affinity -- to fit metal adsorption data with the DLM. For ferrihydrite, the
high-affinity surface sites are much less abundant (0.06 sites/nm2) than the low-affinity sites. For the
mineral in our system, low-Fe-Mg smectite, the surface sites on the platelet edges have a higher
affinity for cation adsorption (e.g., UO22+) and a higher site density (see Fig. 2.1). Following
Pabalan et al.’s (1998) approach for another clay mineral, montmorillonite, we assumed a total
surface area (100 m2/g) for smectite. The surface area for smectite edges (10 m2/g) is much
smaller than for the basal planes (90 m2/g) (Brady et al., 1998; Schlegel et al., 1999); however,
we did not take this difference in surface area into account in these calculations. Therefore, our hypothetical smectite exhibits a much larger capacity for uranyl adsorption than expected for the actual mineral.
The edge Al surface sites are amphoteric in nature and, depending on the pH of the solution, they can protonate and deprotonate to form charged surface sites. For example, a neutral Al
edge surface site [>(e)AlOH] gains or loses a proton to create a positively-charged (zq =1) or
negatively-charged (zq = -1) surface species, according to the following reactions within the
context of the DLM: ) 303 . 2 / ( ) ( ) ( 2
;
10
)
(
)
(
2 F RT H AlOH e AlOH ea
m
m
K
AlOH
e
H
AlOH
e
+ Ψ > > + + + +=
>
↔
+
>
(2.3a) 2-7Al basal
Al basal
Al basal
Al edge
Al edge
Al basal
Al basal
Al basal
Al edge
Al edge
Surface Area 100 m2/g Low Affinity Site High Affinity Site Site Density (sites/nm2) 0.23 2.3Surface Species Log K of Formation
>AlOH2+ -8.33* -8.33*
>AlO- 1.00 9.73*
>AlOUO2+ -4.00 -2.70*
*From Pabalan et al. (1998)
Figure 2.1 Aluminum surface sites found on a platelet of clay mineral. Two types of Al surface-sites, basal plane tetrahedral Al sites and edge octahedral Al sites are present. The site densities assumed for both the basal plane and edge of smectite, and the adsorption constants associated with each site-type are tabulated. ) 303 . 2 / ( ) ( ) (
10
;
)
(
)
(
F RT AlOH e H AlO em
a
m
K
H
AlO
e
AlOH
e
− Ψ > > + −+
=
− +>
↔
>
(2.3b)where all variables have been previously defined. Analogous equations can be written for
protonation and deprotonation of the basal Al surface sites [>(b)AlOH] but experimental
evidence suggests that only deprotonated sites exist on this surface for most conditions (Zhang
et al., 2001). In our model, only two surface complexes with uranium are considered,
>(e)AlOUO2+ and >(b)AlOUO2+, where uranium adsorbs to the edge (e) and basal (b) surface
sites respectively. Each of these complexes forms according to the following type of reaction
) 303 . 2 / ( 2 2 2
;
10
2 2 2 F RT UO AlOH H AlOUOa
m
a
m
K
H
AlOUO
UO
AlOH
+ Ψ > > + + + + + +=
+
↔>
+
>
(2.4) 2-8Other types of uranyl surface complexes may be present on clay surfaces in the subsurface environment. In particular, uranyl carbonate and bicarbonate surface complexes are expected
to play an important role in uranium attenuation in carbonated groundwater (e.g., Waite et al.,
2-9
occurs as a bidentate inner-sphere complex (e.g., Sylwester et al., 2000, Hennig et al., 2002) on
numerous mineral surfaces including montmorillonite at neutral pH values. Chisholme-Brause
et al. (2001) found two uranyl surface complexes commensurate with an inner-sphere complex and exchange-site complex at pH values between 3 and 7 with low to moderate surface
coverage, an outer-sphere complex at low pH (3.7 and 4.4), and a polymeric hydroxide-like sorption complex at moderate surface coverage. Uranium adsorption may occur by the formation of different uranyl complexes as a function of pH and surface loading. Uranyl
adsorption may also occur in combination with different ligands (e.g., UO2CO3, UO2HCO3+,
UO2NO3+, UO2SO4) depending on the solution composition. In this study, we want to investigate
the sensitivity of calculated uranium migration to uncertainties in adsorption constant values. Therefore, we have limited our model to including only two simple uranyl surface complexes,
>(e)AlOUO2+ and >(b)AlOUO2+ and examine the variability of the K given in equation (2.4) for
the formation of >(e)AlOUO2+. This is undoubtedly a simplification of the retardation processes
that occur at a uranium mill tailings site like Naturita; however, our model is more than sufficient to develop an appreciation of the importance of adsorption constant values in reactive/transport models.
Following Pabalan et al. (1998), the optimal (mean) acidity constants for surface protonation
and deprotonation on the Al edge sites are assumed to be equivalent to those for corundum (Turner and Sassman, 1996). Also, the optimal uranyl adsorption constant for the Al edge sites
is taken to be equivalent to that for Al edge sites on montmorillonite (Pabalan et al., 1998).
Adsorption on the basal surface of a clay mineral is independent of pH and is ascribed to the negative charge associated with the substitution of aluminum for silicon in the tetrahedral sheet
(Brady et al., 1996). Therefore, for the Al basal sites, the protonation constant was set equal to
that for the edge sites and the deprotonation constant was assigned a low value to ensure that these sites remain deprotonated over the pH range (i.e., pH 5.8 to 8.0) considered in the simulations. The reactivity of the basal aluminol sites for a clay mineral is considerably less
than that of the edge sites (e.g., Brady et al., 1996). Therefore, for uranyl adsorption to the
basal planes, an equilibrium constant was selected such that adsorption is less than onto on the smectite edges, but large enough to provide a non-zero baseline for uranium adsorption plots. This non-zero baseline is observed experimentally and attributed to ion-exchange in the clay
interlayer (Chisholme-Brause et al., 2001; Hyun et al., 2001).
2.5 One-Dimensional Simulations
To examine the influence of adsorption constant values on the conceptual geochemical models, we now focus on a series of 1-D simulations. We first discuss the effect of grid spacing on the numerical solution. Next, we consider the uncertainty associated with adsorption constants and their influences on transport. The 1-D system considered here consists of a 500 m long
domain. We introduce rainwater through the upstream boundary which was subject to a recharge rate of 20 m/yr, representative of the groundwater flux at Naturita. The annual
precipitation at Naturita is approximately 33 cm (Kohler et al., 2004). We exaggerate the
influence of the rainwater in order to examine its potential to alter the subsurface environment. The downstream boundary is assumed to be open. The aquifer is initially contaminated (see the groundwater compositions in Table 2.2), where uniform aquifer porosity and permeability of
0.2 and 3.12x10⁻¹³ m2 respectively were used throughout the domain. The coefficient of
molecular diffusion used is the default value in Xt, 10-6 cm2/sec and the longitudinal dispersivity
2-10
2.5.1 Effect of Grid Spacing on Numerical Solution
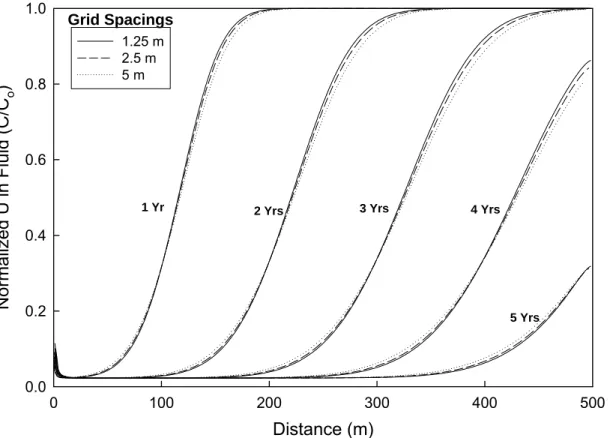
Figure 2.2 illustrates concentration versus distance profiles for uranium in fluid over a 5 year
period, using grid spacings ∆x of 5, 2.5, and 1.25 m, where the concentration has been
normalized to C/C0. Here, C is the uranium concentration in ppm and Co is the initial
concentration in the contaminated groundwater in ppm. The continuous influx of rainwater dilutes the contaminated groundwater such that, after approximately 4 years at a distance of about 380 m, the normalized concentration has been reduced by over 50%. More importantly,
however, the profiles of uranium concentration versus distance are similar for all three ∆x
values. This suggests that for the system considered here, the numerical solution is relatively insensitive to the choice of grid spacing. Therefore, we allow the grid spacing to be 5 m in subsequent 1-D simulations in order to efficiently use our computational resources. We note
that, for ∆x=5 m, the grid Peclet number (i.e., Pe=∆x/∆L) is equal to one, which is well within the
customary constraint of Pe £ 2 (e.g., see Frind and Germain, 1986).
2.5.2 Baseline Case for 1-D Simulations
The geochemical system that we are examining includes (1) the mixing of rainwater with
contaminated groundwater, (2) a mineral, smectite, that is allowed to dissolve and precipitate in the simulations, and (3) surface site speciation including protonation, deprotonation, and the adsorption of uranium to two different types of surface sites. This system is sufficiently
complicated to warrant discussion, prior to examining the effects of uncertainty in log K >(e)AlO
-and log K >(e)AlOUO2+.
The first point to note is that the scenario that we are examining is one in which the
groundwater/soil system is pre-contaminated and the simulation exposes this pre-contaminated system to clean rainwater. From field data, we know that 3 ppm represents the upper limit of
observed aqueous uranium concentrations at the Naturita site (Kohler et al., 1994; Curtis et al.,
2004). Using the log Ks established from the literature (see Fig. 2.1), we calculated that in our initial equilibrated system, over 1150 mg/kg uranium must be adsorbed to smectite for 3 ppm uranium to be present in solution. The high concentration of uranium adsorbed is due to the
high concentration of high-affinity or edge surface sites used in our calculations (2.3 x 10²⁰
sites/gm smectite). Uranium desorption makes a significant contribution to uranium concentrations in solution over time. However, during the 20-year simulation, 99% of the uranium remains adsorbed throughout the simulation domain. The contaminated groundwater has much higher leachate-like uranyl concentrations than the rainwater. Therefore the
concentration profiles illustrate initially high concentrations of uranium being replaced by lower ones (Fig. 2.2). This is the opposite of a typical simulation starting with a pristine groundwater and introducing a contaminated plume.
The second point is that smectite dissolution and precipitation occurs as a result of changes in solution composition. Our simulations are designed so that smectite is always present and in equilibrium with the solution, however there is enough smectite available to allow for small changes in smectite concentration, without becoming undersaturated with this solid phase. In
Distance (m) 0 100 200 300 400 500 Normalized U in Fluid (C/C o ) 0.0 0.2 0.4 0.6 0.8 1.0 1.25 m 2.5 m 5 m Grid Spacings
1 Yr 2 Yrs 3 Yrs 4 Yrs
5 Yrs
Figure 2.2 Effect of grid spacing on uranium in fluid profiles, as a function of time, using X1t. Solid, dashed, and dash-dot lines respectively refer to a grid spacing of 5, 2.5, and 1.25 m, where all simulations are performed using the mean log K values for >(e)AlO- and >(e)AlOUO
2+.
this simulation, smectite dissolution occurs as rainwater displaces groundwater. From equation (2.2), it can be seen that a decrease in the pH from 7 (that of the contaminated groundwater) to 5.8 (that of the rainwater) will favor smectite dissolution. Smectite dissolution will in turn
increase the pH. In 20 years, the volume % of smectite changes from 2.5 to 2.4 at the inlet, and minor smectite dissolution is calculated to occur only in the first 50 m of the
streamtube. Fig. 2.3a illustrates that the pH at the inlet of the streamtube is influenced by both of these processes, resulting in a minor increase in pH followed by a minor decrease in pH in the first few elements of the streamtube. The size of the elements influences the shape of this curve; the larger they are, the greater this pH variation is dampened by the dominance of the subsurface groundwater and smectite system. The pH variation and smectite dissolution would also be substantially reduced if the influx of rainwater was reduced to reflect a more typical annual precipitation rate.
Although only a small volume of smectite dissolves relative to the total smectite present, the dissolution of smectite releases uranium into solution affecting the calculated fluid concentration of uranium. This is illustrated in the concentration versus distance profiles (Fig. 2.2) by the small increase in uranium concentration in solution at the boundary between the
groundwater/smectite system and the influent rainwater. The dissolution of smectite decreases the available surface area and number of surface sites available for uranyl adsorption; therefore uranium is released into solution along with the iron, calcium, potassium, sodium, magnesium, aluminum, and silica that make up the smectite mineral itself. This influx of uranium into
solution from smectite Distance (m) 0 100 200 300 400 500 pH 6.7 6.8 6.9 7.0 7.1 7.2 7.3 1 Yr 2 Yrs 3 Yrs 4 Yrs 5 Yrs
A
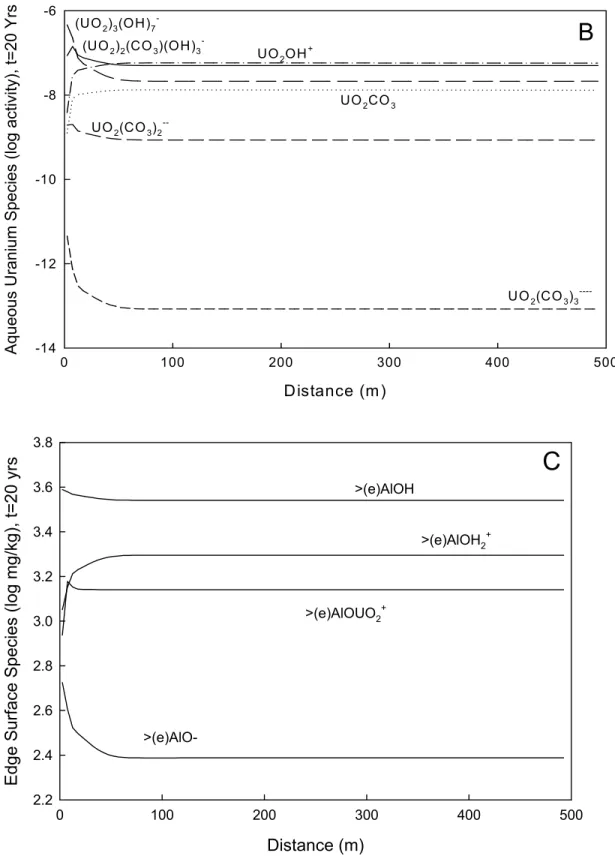
2-12Distance (m) 0 100 200 300 400 500 Aq ueo us Urani um Sp eci e s (lo g a cti vi ty ), t= 20 Yrs -14 -12 -10 -8 -6 (UO2)3(OH)7
-(UO2)2(CO3)(OH)3- UO
2OH + UO2(CO3)2 --UO2(CO3)3 ----UO2CO3
B
Distance (m) 0 100 200 300 400 500 Edg e Sur fa ce Spe cie s ( log mg/kg) , t=20 yr s 2.2 2.4 2.6 2.8 3.0 3.2 3.4 3.6 3.8 >(e)AlOH >(e)AlO->(e)AlOH2+ >(e)AlOUO2 +C
Figure 2.3 Baseline Case (a) pH versus distance, (b) dominant aqueous species of uranyl calculated to be present after 20 years of rainwater infiltration, (c) surface complexation of smectite edge sites after a 20-year simulation.
2-14
dissolution occurs at the same time as rainwater, with no dissolved uranium, displaces
contaminated groundwater. For this baseline case, the two processes counteract each other, so that the concentration of uranium in solution is not dramatically affected at the boundary. The displacement of one fluid by another (i.e., contaminated groundwater by the inlet rainwater)
with different pH, different pCO2, and different concentrations of cations and anions, changes
the predominant uranyl species in solution as a function of distance and time in the streamtube. Based on the thermodynamic database in X1t, the predominant aqueous uranyl species in the
contaminated groundwater are (UO2)2(CO3)(OH)3-(47.3%), UO2(CO3)22-(43.6%), and UO2CO3
(7.5%). With mixing, the predominant uranyl species in solution at the boundary become
(UO2)3(OH)7-, (UO2)2(CO3)(OH)3-, and UO2OH+ (Fig. 2.3b). The predominant surface species
remain relatively constant throughout the simulation. The edge surface species in order of
decreasing abundance are >(e)AlOH, >(e)AlOH2+, >(e)AlOUO2+, and >(e)AlO-(Fig. 2.3c). The
basal plane surface species in order of decreasing abundance are >(b)AlO-, >(b)AlOUO
2+,
>(b)AlOH, and >(b)AlOH2+.
A final point to make here is that as Table 2.2 indicates, the Cl- (mg/kg) concentration in the
initial contaminated groundwater was increased from our input estimate of 84 mg/kg to 810 mg/kg in order to charge balance our initial groundwater/smectite system. This new
concentration of Cl- (mg/kg) is well within the range of Cl- concentrations reported at the Naturita
site. Concentration versus distance profiles for Cl-, the charge-balancing component, and Na+,
an unmodified tracer in the system, are identical, indicating that this initial change in Cl
-concentration is carried throughout the simulation, and providing a check on the mass balance of the system.
2.5.3 Uncertainty Analysis: Latin Hypercube Sampling
Uranyl adsorption is expected to be predominantly a function of the equilibrium constants for
>(e)AlOUO2+ and >(e)AlO- (Pabalan et al., 1998). For this reason, we investigate the
uncertainty in these two constants. The range of equilibrium constant values was chosen to be
comparable to the range of surface protonation and deprotonation constants found by Hayes et
al. (1991) who, using the DLM, fitted surface titration data for goethite, corundum, and rutile
using total surface site densities of 1, 10, and 100 sites/nm2. Fitted (de)protonation constants
varied by over three log units to compensate for the variance in site density. The study by
Hayes et al. (1991) remains the only investigation that thoroughly examined variable sensitivity
within the DLM. Accordingly, for our sensitivity analysis, we varied the equilibrium constants for
>(e)AlOUO2+ and >(e)AlO- approximately over three orders of magnitude.
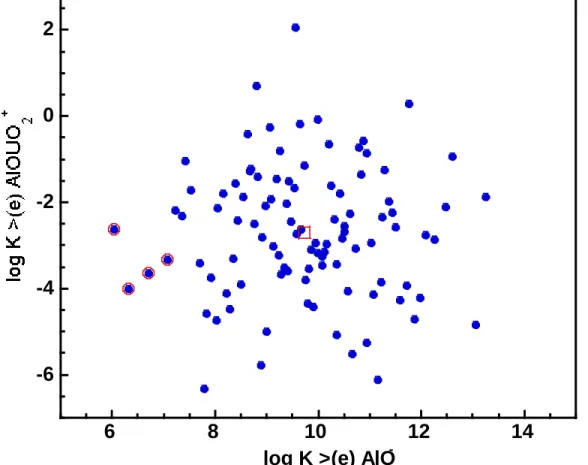
To analyze the influences of adsorption constants on the numerical reactive-transport results, we used the Latin Hypercube Sampling (LHS) technique to generate normally distributed pairs
of log K values. Unlike simple Monte Carlo approaches where samples are randomly
generated, LHS employs a constrained sampling scheme (e.g., Iman and Shortencarier, 1984). On the basis of equal probability, the LHS technique generally divides the range of each
variable (e.g., two log K’s in our case) into n non-overlapping intervals. For a given probability
density function (e.g., normal distribution), one random value from each interval is then
selected. Subsequently, the n values obtained for one variable are paired with n values for the
normally distributed log K’s for >(e)AlO- and >(e)AlOUO
2+, generated using the LHS software
package developed by Wyss and Jorgensen (1998). Here the mean log K values for >(e)AlO
-and >(e)AlOUO2+ are respectively chosen to be 9.73 and –2.7, and we used a ∆log K = 0.75 to
represent one standard deviation from the mean log K. In the next section, we discuss the
consequences of the log K variations (i.e., uncertainty) on our 1-D conceptual model.
2.5.4 Results of Uncertainty Analysis
The log K >(e)AlO- and log K >(e)AlOUO
2+ variations for the 100 simulations yield different
adsorbed uranium concentrations, as well as different distributions of aqueous species for the initial conditions of each transport simulation. The total uranium concentration in the system is
1200 ppm. Using the mean log K values for both surface species, the equilibrium concentration
of uranium in solution is 3.14 ppm, well within the range observed at the Naturita site. For the
100 pairs of log K values used in the simulations, the initial uranium in solution varies from 2.5 x
10-4 ppm to 1100 ppm (C
o = 180 ± 290 ppm). As Figs. 2.5a and b illustrate, while this initial
aqueous uranium concentration is a strong function of log K >(e)AlOUO2+, it is less dependent
upon the choice of log K >(e)AlO-. The range of initial uranium concentrations in solution is
significant, particularly considering that the MCL (maximum concentration level) is 0.03 ppm
(USEPA, 2001). Again, however, this hypothetical smectite has 90 m2/gm more edge surface
area than estimated for clay minerals; therefore, the uranium concentrations in the system are
-6
-4
-2
0
2
6
8
10
12
14
log K >(e) AlO
-Figure 2.4 Log K variation for >(e) AlOUO2+ versus those of >(e) AlO- for 100 pairs of values generated 2-15
using Latin Hypercube Sampling technique. The value for the mean log K pair is shown with an open square and the open circles around four of the samples indicate the simulations that failed to run due to convergence problems.
exaggerated compared to those possible at a uranium mill tailings site like Naturita.
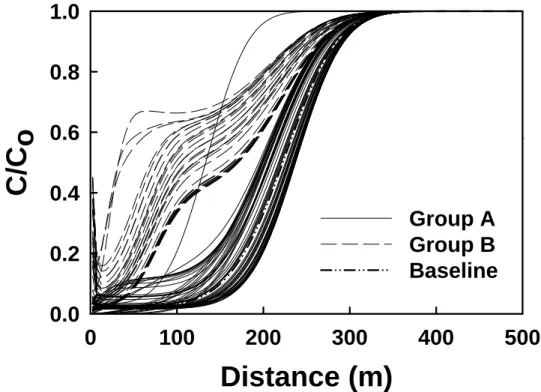
In order to analyze differences in concentration profile behavior, we have normalized the results
of each simulation to the initial uranium concentration in aqueous solution (C0) for that
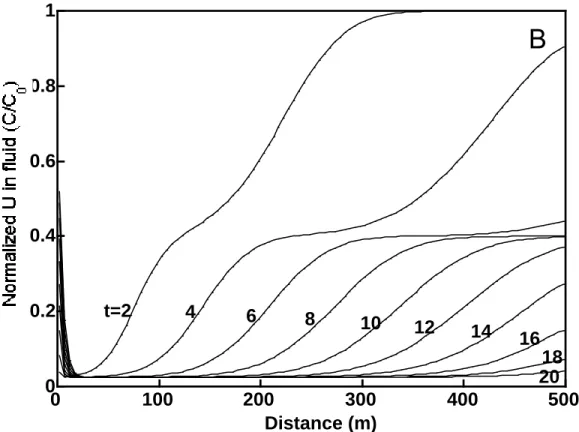
simulation. We find that the results can be generally divided into two main groups: Group A, in which the calculated concentration versus distance profiles exhibit a uniform concentration front (e.g., similar to those seen in Fig. 2.2) and Group B in which the profiles exhibit a sharp spike in uranium concentration at the inlet followed by an undulation in uranium concentration with
distance. Representative profiles for thesetwo different types of response are illustrated in
Figs. 2.6a and b for various simulation times. We note that, while the calculated profiles of concentration versus distance represent the amount of uranium in solution, they fail to
emphasize that the majority of the uranium present in the system often remains adsorbed onto
the clay throughout the simulation. For example, for log K>(e)AlO- = 11.71 and log K
>(e)AlOUO2+ = -3.92, the initial equilibrium distribution of uranium is 0.11 mg/kg uranium in
solution and over 1050 mg/kg uranium adsorbed. After two years of simulated time, the uranium in solution drops to below 0.01 mg/kg near the inlet while the uranium adsorbed remains approximately the same (1055 mg/kg) throughout the 1-D domain. On the other hand,
in some 4 1
A
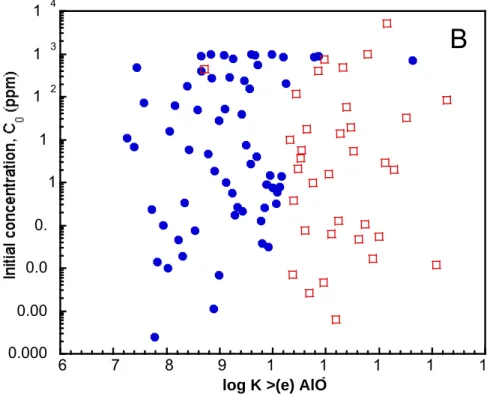
3 1 2 1 1 1 0. 2-16 0.000 0.00 0.0 - - - 0 2 Group A Grouplog K >(e) AlOUO+
4 1
B
3 1 2 1 1 1 0. 0.0 0.00 0.000 6 7 8 2-17Figure 2.5 Initial concentrations for uranium in fluid versus (a) log K >(e) AlOUO2+ and (b) log K >(e) AlO-. The concentrations are divided into two groups, A and B, because the 100 pairs of log K values sampled (see Fig. 2.3) lead to two distinctly different types of concentration profile behavior (see Fig. 2.7).
log K >(e) AlO
9 1 -1 1 1 1