University of Insubria
Department of Theoretical and Applied Science (DiSTA) PhD Thesis in Computer Science
XXXII Cycle of Study
Multimodal Representation and Learning
Candidate: Shah Nawaz
Thesis Advisor: Prof. Ignazio Gallo
Contents
List of Figures vii
List of Tables ix
1 Introduction 1
1.1 Motivation . . . 1
1.2 Challenges . . . 4
1.3 Contributions . . . 5
2 Visual Word Embedding for Text 7 2.1 Introduction . . . 7
2.2 Related Work . . . 8
2.3 Proposed Approach . . . 9
2.3.1 Encoding Scheme . . . 9
2.3.2 Encoding Scheme with CNN . . . 10
2.4 Datasets . . . 12
2.5 Experiments and Results . . . 13
2.5.1 Parameters Setting . . . 13
2.5.2 Data Augmentation . . . 15
2.5.3 Encoded Image Size . . . 16
2.5.4 Comparison with Other State-of-the-art Text Classification Methods 17 2.5.5 Comparison with State-of-the-art CNNs . . . 17
2.6 Conclusion . . . 18
3 Learning Deep Latent Space Representations 19 3.1 Introduction . . . 19
3.2 Related Work . . . 20
3.3 The Proposed Framework . . . 21
3.3.1 Encoding Text Descriptions . . . 22
3.3.2 Audio Signals . . . 22
3.3.3 Visual Signals . . . 22 iii
3.4.2 Experimental Setup . . . 25 3.4.2.1 Cross-modal Retrieval . . . 25 3.4.2.2 Cross-modal Verification . . . 25 3.4.2.3 Cross-modal Matching . . . 26 3.4.3 Implementation Details . . . 26 3.5 Evaluation . . . 26 3.5.1 Cross-modal Retrieval . . . 26 3.5.2 Cross-modal Verification . . . 26 3.5.3 Cross-modal Matching . . . 27 3.5.4 Qualitative Evaluation . . . 29 3.5.5 Ablation Study . . . 29 3.6 Conclusion . . . 30
4 Learning Deep Fused Representation 33 4.1 Introduction . . . 33
4.2 The Proposed Approach . . . 35
4.3 Experiments and Results . . . 36
4.3.1 Datasets . . . 36
4.3.2 Implementation Details . . . 37
4.3.3 Experiment Details . . . 37
4.3.4 Baselines . . . 38
4.3.5 Comparison with State-of-the-Art Methods . . . 39
4.4 Conclusion . . . 39
5 Inward Scale Feature Representations 41 5.1 Introduction . . . 41
5.2 Related Work . . . 43
5.2.1 Metric Learning . . . 43
5.2.2 Normalization Techniques . . . 43
5.2.3 Hypersphere Embedding Techniques . . . 43
5.2.4 Revisiting Softmax-based Techniques . . . 44
5.3 Proposed Method . . . 44
5.3.1 Inward Scale Layer . . . 45
5.4 Empirical Results . . . 47
5.4.1 Classification Results . . . 47
5.4.1.1 MNIST and FashionMNIST . . . 47
5.4.1.3 CIFAR100 . . . 48
5.4.2 Retrieval Results . . . 49
5.4.3 Result Discussion . . . 49
5.5 Conclusion and Future Work . . . 50
6 Supplementary 51 6.1 Introduction . . . 51
6.2 Related Work . . . 52
6.3 Deep Metric Learning Methods . . . 53
6.3.1 Siamese Network . . . 53
6.3.2 Triplet network . . . 53
6.3.3 Covolutional Neural Networks . . . 54
6.3.4 Triplet Sampling . . . 54
6.4 Dataset . . . 56
6.5 Experiments . . . 57
6.6 Conclusions . . . 62
7 Conclusions and Future Research Directions 63 7.1 Conclusion . . . 63
7.2 Perspectives for Future Research . . . 64
List of Figures
1.1 Multimodal Example in Classification Context . . . 2
1.2 Multimodal Example in Named Entity Recognition Context . . . 3
2.1 High Level Visual Word Embedding Example . . . 8
2.2 Visual Word Embedding Examples with Various Shapes . . . 10
2.3 Example of the Respective Fields with Visual Word Embedding . . . 11
2.4 Example of Five Feature Maps . . . 11
2.5 Different Sizes of Encoded Image . . . 12
2.6 Encoded Images Obtained using Different Word2Vec Features Length . . 13
2.8 Five Different Designs of Visual Words . . . 15
3.1 Deep Latent Space Representations Framework . . . 21
3.2 Encoding Text Descriptions . . . 23
3.3 Random Example Taken from MSCOCO Dataset . . . 24
3.4 An Audio-visual Example Extracted from Voxceleb Dataset . . . 25
3.5 Text and Image Visualization using t-SNE . . . 30
3.6 Audio and Image Visualization using t-SNE . . . 30
4.1 Multimodal Examples in Classification Context . . . 34
4.2 Deep Fused Representation Framework . . . 35
4.3 Example of an Input Image and Some Feature Maps . . . 36
4.4 Some Random Examples of Multimodal Fusion . . . 40
5.1 A Toy Example to Show Projection . . . 42
5.2 Plots on Test Set of MNIST Dataset at Different Epochs . . . 45
5.3 Comparison of Employing Softmax With and Without Inward Scale Layer 46 5.4 Plots of Training Loss on CIFAR100 Dataset With and Without Inward Scale Layer . . . 48
6.1 Siamese and Triplet Networks . . . 54
6.2 Interesting Set of Classes in Urdu-Characters Dataset . . . 55
6.3 Handwritten Response from a Student on a Printed Plain Paper . . . 56 vii
List of Tables
2.1 Detailed Information on Datasets . . . 12
2.2 Different Configurations Comparison . . . 14
2.3 Comparison of different parameters Over the 20news-bydate dataset . . . 16
2.4 Comparison with State-of-the-art Approaches . . . 17
2.5 Comparison with Three different CNNs . . . 17
3.1 Cross-modal Retrieval Results . . . 27
3.2 Cross-modal Verification Results . . . 28
3.3 Analysis of cross-modal Verification Under Varying Demographics . . . . 28
3.4 Cross-modal Matching Results . . . 29
3.5 Ablation Study on Cross-modal Verification . . . 31
3.6 Ablation Study on Cross-modal Matching . . . 31
4.1 Classification Results and Comparisons with CNN trained on Single Source 38 4.2 Comparison with State-of-the-art Approaches . . . 39
5.1 Important Terminology . . . 45
5.2 Accuracy on MNIST and FashionMNIST Test Set . . . 47
5.3 Accuracy on SVHN Test Set . . . 48
5.4 Accuracy on CIFAR100 Dataset Test Set . . . 49
5.5 Recall@K Scores on FashionMNIST Test Set . . . 50
6.1 Siamese Network Settings Built on Top of LeNet for MNIST and Urdu-Characters Datasets . . . 59
6.2 Siamese Network Settings Built on Top of LeNet and AlexNet for Urdu-Characters . . . 59
6.3 Triplet Network Settings Built on Top of LeNet for MNIST and Urdu-Characters Datasets. . . 59
6.4 Triplet Network Settings Built on Top of LeNet and AlexNet for Urdu-Characters Dataset . . . 60
6.5 Triplet Network Settings Built on Top of AlexNet and GoogleNet for Urdu-Characters dataset. . . 61
Acknowledgements
First, I would like to express my sincere gratitude to my advisor Prof. Ignazio Gallo and my colleague Alessandro Calefati. I would like to thank them for the continuous support of my doctoral study and research, for their patience, motivation, enthusiasm, and vast knowledge. Their guidance helped me in all the time of research and writing of this thesis. I gratefully acknowledge Muhammad Kamran Janjua (National University of Sciences and Technology, Islamabad Pakistan), Muhammad Umer Anwaar (Technical University of Munich, Germany), Nisar Ahmed (University of Engineering and Technology, Lahore Pakistan) and Dr. Arif Mahmood (Information Technology University, Lahore Pakistan) for their collaboration in my research activities.
Furthermore, I acknowledge 7Pixel that made my PhD work possible providing ideas, data, funds and place for the research activities.
Last, but not least, I would like to thank my family for providing me with the needed support to succeed in this doctoral work.
1
Introduction
1.1 Motivation
Deep learning has remarkably improved the state-of-the-art speech recognition, visual object detection, object recognition and text processing tasks [1]. Majority of these tech-niques focused on unimodality (images, text, speech, etc.), however, real-world scenarios present data in a multimodal fashion – we see objects, listen sounds, feel texture, smell odours and taste flavours. Multimodality refers to the fact that the real-world concepts can be described by multiple modalities. Moreover, recent years has seen an explosion in multimodal data on the web. Typically, users combine text, image, audio or video to sell a product over an e-commence platform or express views on social media. It is well-known that multimodal data may provide enriched information to capture a par-ticular “concept” than single modality [2]. For example, Figure 1.1 shows two adverts typically available on an e-commerce platform, where two visual objects have seemingly similar captions in the first row but dissimilar images. On the second row, we have two different captions but seemingly similar images in the second row. Typically, such sce-narios are faced in multimodal classification. Similarly, Figure 1.2 shows two examples of multimodal data collected from a social media platform. If we consider only the text descriptions, entities may be wrongly labelled. Therefore, visual context is beneficial to resolve ambiguities. In addition, various modalities generally carry different kinds of information that may provide enrich understanding; for example, the visual signal of a flower may provide happiness; however, its scent might not be pleasant. Multimodal information may be useful to make an informed decision.
Figure 1.1: In the top row, an example of ambiguous text descriptions that can be dis-ambiguated with the analysis of the accompanying images. In the bottom row, examples of ambiguous images that can be disambiguated with the analysis of the associated text descriptions. Generally, e-commerce platforms have such ambiguous examples.
1.1 Motivation 3
(a) My daughter got 1 place in [Apple valleyLOC] Tags gymnas-tics.
(b) Apple ORG] ’s latest [iOS
OTHERS] update is bad for ad-vertisers.
Figure 1.2: Two NER multimodal examples show how some entities in the text can be correctly tagged in combination with visual information. Looking only at the text, the wordAppleis ambiguous in the text description on the left because it can be interpreted asLocation (LOC) or asOrganization (ORG).
It is therefore important to perform multimodal learning to understand the web and the world around us. We cannot afford to have a single model for every concept. How-ever, it is challenging to interpret various modalities together because each modality has a different representation and correlational structure. For example, the text is typically represented as discrete sparse word count vectors whereas an image is represented using dense and real-value features. It is therefore difficult to capture cross-modal interac-tions between modalities than intra-modal interacinterac-tions among the same modality. It is interesting to note that the input data from multiple modalities may contain struc-ture however, it is challenging to discover the highly non-linear relationships that exist. Moreover, the data may contain noise along with missing values at the input. Therefore, meaningful representation should be extracted from multiple modalities to learn joint representations for multimodal applications. Srivastava and Salakhutdinov [3] identify the following desirable properties for good multimodal representations.
– It is challenging to obtain joint representation because multiple modalities data may be heterogeneous. It is therefore important that the joint representation should be meaningful and complement the corresponding “concepts” at the input level.
– The joint representation form various modalities provides more information than the representation from individual modalities however, modalities in real-world scenarios may be missing. It is therefore important that the model provides mean-ingful representation in such situations.
– The missing modalities in some case should be fill-in with the help of observed one. – Typically, the extracted representation is employed in various applications includ-ing cross-modal verification and retrieval. It is therefore important that the ex-tracted representation should be discriminative for improved performance.
In recent years, the combination of various modalities has been extensively studied to solve various tasks including classification [4, 5, 6], cross-modal retrieval [7] seman-tic relatedness [8, 9], Visual Question Answering [10, 11], image captioning [12, 13], multimodal named entity recognition [14, 15, 16, 17].
1.2 Challenges
This doctoral thesis identifies and explores the following core technical challenges con-cerning multimodal representation and learning. Besides, we focus on three modalities including text, audio and visual signals for various multimodal applications such as classification, cross-modal retrieval and verification on benchmark datasets.
– The first fundamental challenge is learning how to represent and summarize multi-modal data to exploit meaningful information from individual multi-modality. However, the heterogeneity nature of multimodal data makes it difficult to construct joint representation. For example, language is often symbolic, while audio and visual modalities are represented as signals.
– The second challenge is to join information from multiple modalities to perform various tasks. For example, for audio-visual speech verification, the visual de-scription of the face is fused with the audio signal to verify if audio and face image belongs to the same identity or not. The information coming from multiples modal-ities may have different predictive power, with possibly missing information in at least one of the modalities. In other words, the joint representation should have discriminative power to be employed for various tasks.
The unimodal representations have been extensively studied [18, 19]. In recent years, there is a paradigm shift in unimodal representations from hand-crafted for particular applications to data-driven representations. For example, visual descriptors learned from data using neural architectures such as Convolutional Neural Networks (CNNs) have outperformed hand-craft descriptors, namely the scale invariant feature transform [20]. Therefore, representations will be extracted from CNNs in accordance with guidelines from Bengio et al. [18] for unimodal representations and Srivastava and Salakhutdinov [3] for multimodal representations.
1.3 Contributions 5
1.3 Contributions
In a multimodal approach, typically, data is obtained from various modalities and repre-sentation for a particular modality is extracted. In this doctoral thesis, reprerepre-sentations from individual modalities are improved to extract enhanced representations. These contributions are listed as follow:
– In Chapter 2, “visual word embedding scheme” is presented to transform word embedding to visual space. The aim of the approach is to employ state-of-the-art image classification models for text classification. The visual word embedding is evaluated against state-of-the-art text classification methods on 8 benchmark datasets. The work results in the following publications:
1. Shah Nawaz, Alessandro Calefati, Ignazio Gallo. Visual Word Embedding for Text Classification. Submitted: Journal of Machine Vision and Applications 2019.
2. Ignazio Gallo, Shah Nawaz, Alessandro Calefati. Semantic Text Encoding for Text Classification using Convolutional Neural Networks. In 2017 14th IAPR International Conference on Document Analysis and Recognition (ICDAR) (Vol. 5, pp. 16-21). IEEE.
– In Chapter 3, multimodal framework named “deep latent space
representa-tions” is presented for cross-modal retrieval, matching and verification. The
frame-work is coupled with a single stream netframe-work to bridge the gap between multiple modalities (text/image and audio/image) without needing a separate network for each modality. It is interesting to note that the text embedding in the multimodal framework is extracted from “visual word embedding scheme”. In addition, the visual word embedding helped to employ single stream network because rep-resentations from text and the visual signal is extracted with the same neural network. The cross-modal retrieval application is evaluated against state-of-the-art methods on a benchmark dataset named MSCOCO. Similarly, the cross-modal matching verification application is evaluated on VoxCeleb benchmark dataset that includes audio and visual information. This work results in the following publica-tions covering cross-modal retrieval and verification applicapublica-tions evaluated aganist state-of-the-art works:
1. Shah Nawaz, Muhammad Kamran Janjua, Ignazio Gallo, Arif Mehmood, Alessandro Calefati. Deep Latent Space Learning for Cross-modal Mapping of Audio and Visual Signals. In Digital Image Computing: Techniques and Applications 2019.
2. Shah Nawaz, Muhammad Kamran Janjua, Alessandro Calefati, Ignazio Gallo and Arif Mehmood. Do Cross-Modal Systems Leverage Semantic Relation-ships? In International Conference on Computer Vision Workshop 2019. – In Chapter 4, “deep fused representations framework” is presented for
multi-modal classification. The multimulti-modal representation is obtained by fusing “visual
word embedding” and visual signals. Finally, the information enriched (fused)
image is classified with single stream state-of-the-art image classification model. The proposed approach is evaluated against state-of-the-art methods on three benchmark multimodal datasets including Ferramenta, UPMC Food 101 and Ama-zon Product Data. This work results in the following publication:
1. Shah Nawaz, Alessandro Calefati, Muhammad Kamran Janjua, Muhammad Umer Anwaar, Ignazio Gallo. Learning Fused Representations for Large Scale Multimodal Classification. In IEEE Sensors Letters 2018.
– In Chapter 5, an “inwardly scale feature representations” in proportion to projecting them onto a hypersphere manifold for discriminative analysis is pre-sented. The proposed approach will render similar instances closer while dissimilar instances distant. For this purpose, an inward scaling layer is paired with different deep network architectures. Extensive experiments are performed on multitude of datasets to establish the empirical gain achieved with the purposed method on image classification and retrieval. Comparison with current state-of-the-art tech-niques demonstrated the excellent performance of the purposed method.
– In Chapter 6, a new handwritten dataset named “Urdu-Characters” with set of classes suitable for deep metric learning is created. The performance of two state-of-the-art deep metric learning methods i.e. Siamese and Triplet network, is compared. We show that a Triplet network is more powerful than a Siamese network. In addition, we show that the performance of a Triplet or Siamese network can be improved using the most powerful underlying Convolutional Neural Network architectures. This work results in the following publication:
1. Shah Nawaz, Alessandro Calefati, Nisar Ahmed Rana, Ignazio Gallo. Hand Written Characters Recognition via Deep Metric Learning. In 13th IAPR International Workshop on Document Analysis Systems (DAS), pp. 417-422. IEEE, 2018.
In Chapter 2, 5 and 6, representations from individual modalities are discussed which in turn are employed in two multimodal frameworks for classification, cross-modal re-trieval and verification in Chapter 3 and 4.
2
Visual Word Embedding for Text
2.1 Introduction
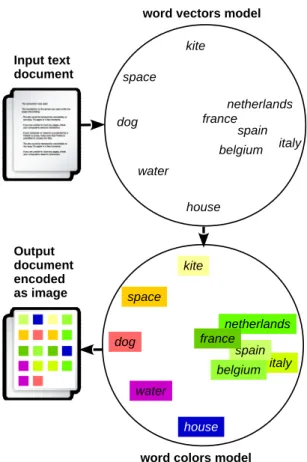
Text classification is a common task in Natural Language Processing. Its goal is to assign a label to a text document from a predefined set of classes. In recent years, CNNs have remarkably improved performance in image classification [21, 22, 23] and researchers have successfully transferred this success into text classification [24, 25]. Im-age classification models [21, 23] are adapted to accommodate text [26, 24, 25]. We, therefore, leverage on the recent success in image classification and present a novel text classification approach to cast text documents into visual domain to categorize text with image classification models. Our approach transforms text documents into encoded im-ages or visual embedding capitalizing on Word2Vec word embedding. Word embedding models [27, 28, 29] for text classification convert words into vectors of real numbers. Typically word embedding models are trained on a large corpus of text documents to capture semantic relationships among words. Thus, these models can produce similar word embeddings for words occurring in similar contexts. We exploit this fundamental property of word embedding models to transform a text document into a sequence of colors (visual embedding), obtaining an encoded image, as shown in Figure 2.1. In-tuitively, semantically related words obtain similar colors or encodings in the encoded image while uncorrelated words are represented with different colors. Interestingly, these visual embeddings are recognized with state-of-the-art image classification models.
We present a text classification approach to transform word embedding of text doc-uments into the visual domain. We evaluated the method on several large scale datasets
Figure 2.1: We exploited a well-known property of word embedding models: semanti-cally correlated words obtain similar numerical representation. It turns out that if we interpret real-valued vectors as a set of colors, it is easy for a visual system to cope with relationships between words of a text document. It can be observed that green colored words are related to countries, while other words are represented with different colors.
obtaining promising and, in some cases, state-of-the-art results.
2.2 Related Work
Deep learning methods for text documents involved learning word vector representations through neural language models [27, 28]. These vector representations serve as a founda-tion of our work where word vectors are transformed into a sequence of colors or visual embedding. Image classification model is trained and tested on these visual embeddings. Kim [26] proposed a simple shallow neural network with one convolution layer followed by a max pooling layer over time. The final classification is performed with one fully con-nected layer with drop-out. The work in [24] presented rather deep convolutional neural
2.3 Proposed Approach 9
network for text classification. The network is similar to the convolutional network in computer vision [21]. Similarly, Conneau et al. [25] presented a deep architecture that operates at character level with 29 convolutional layers to learn hierarchical representa-tions of text. The architecture is inspired by recent progress in computer vision [30, 31]. In our work, we leverage on recent success in computer vision, but instead of adapting the deep neural network to be fed with raw text information, we propose an approach that transforms word embedding of text documents into encoded text. Once we have encoded text, we can apply state-of-the-art deep neural architectures used for image classification. We compared our proposed approach with deep learning models based on word embedding and lookup tables along with the method proposed in [24] and [25, 32] using the same datasets. In Section 2.5, experimental results of our proposed approach are shown, highlighting that, in some cases, it overtakes state-of-the-art results while in other cases, it obtains comparable results.
2.3 Proposed Approach
In this section, we present our approach to transforming Word2Vec word embedding into the visual domain. In addition, we explained the understanding of CNNs with the propose approach.
2.3.1 Encoding Scheme
The proposed encoding approach is based on Word2Vec word embedding [27]. We encode a word tk belonging to a document Di into an artificial image of size W ×H. The approach uses a dictionary F(tk, vk) with each word tk associated with a feature vector
vk(tk) obtained from a trained version of Word2Vec word embedding model. Given the word tk, we obtained a visual word ˆtk having width V that contains a subset of a feature vector, called superpixels. A superpixel is a square area of size P ×P pixels with a uniform color that represents a sequence of contiguos features (vk,j, vk,j+1, vk,j+2)
extracted as a sub-vector of vk. A graphical representation is shown in Fig. ??. We normalize each component vk,j to assume values in the interval [0. . .255] with respect to k, then we interpret triplets from feature vectorvk as RGB sequence. For this very reason, we use feature vector with a length multiple of 3.
The blank space s around each visual word ˆtk plays an vital role in the encoding approach. We found out that the parametersis directly related to the shape of a visual word. For example, if V = 16 pixels, thensmust also have a value close to 16 pixels to let the network understand where a word ends and another begins.
Figure 2.2: In this example, the word “pizza” is encoded into a visual word ˆtk based on Word2Vec feature vector with length 15. This visual word can be transformed into different shapes, varying the V parameter (in this exampleV = 2,3,6 superpixels).
2.3.2 Encoding Scheme with CNN
It is well understood that a CNN can learn to detect edges from image pixels in the first layer, then use the edges to detect trivial shapes in the next layer, and then use these shapes to infer more complex shapes and objects in higher layers [33]. Similarly, a CNN trained on our proposed visual embedding may extract features from various convolu-tional layers (see example in Fig. 2.4). We observed that the first convoluconvolu-tional layer recognizes some specific features of visual words associated to single or multiple superpix-els. The remaining CNN layers aggregate these simple activations to create increasingly complex relationships between words or parts of a sentence in a text document.
To numerically illustrate this concept, we use the receptive field of a CNN. The receptive fieldris defined as the region in the input space that a particular CNN feature is looking at. For a convolution layer of a CNN, the sizer of its receptive field can be computed by the following formula:
rout=rin+ (k−1)·jin (2.1)
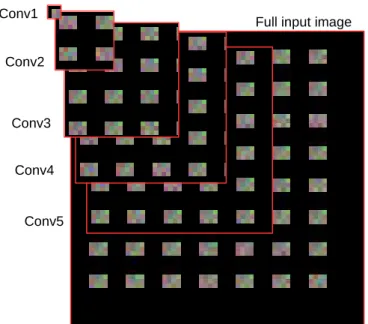
where k is the convolution kernel size and j is the distance between two consecutive features. We can compute the size of the receptive field of each convolution layer using the formula in Eq. 2.1. For example, the five receptive field of an AlexNet, showed in Fig. 2.3, have the following sizes: conv1 11×11, conv2 51×51, conv3 99×99, conv4
131×131 and con5 163×163. This means that the conv1 of an AlexNet, recognizes a small subset of features represented by superpixels, while the conv2 can recognize a visual word (depending on the configuration used for the encoding), up to thecon5 layer where a particular feature can simultaneously analyze all the visual words available in the input image.
2.3 Proposed Approach 11
Figure 2.3: The receptive fields of the five convolution layers of an AlexNet. Each receptive field is cut from a 256×256 image to analyze the quantity of visual words that each conv layer is able to analyze on each pixel of its feature map.
conv1 conv2 conv3 conv4 conv5
Figure 2.4: An example of five feature maps (conv1,. . . , conv5) displayed over the input image of the DBPedia dataset. In this particular example images are encoded with 12 Word2Vec features and 16 pixels of space between visual words. The convolutional map generated by the conv1 layer shows activations of individual superpixel or sequence of superpixels, while other convolutional layers show larger activation areas affecting more visual words.
Figure 2.5: Five different sizes of encoded image (100×100, 200×200, 300×300, 400×400, 500×500) obtained using the same document belonging to the 20news-bydate dataset. All images use the same encoding with 24 Word2Vec features, spaces= 12, superpixel size 4×4. It is important to note that the two leftmost images cannot represent all words in the document due to the small size.
2.4 Datasets
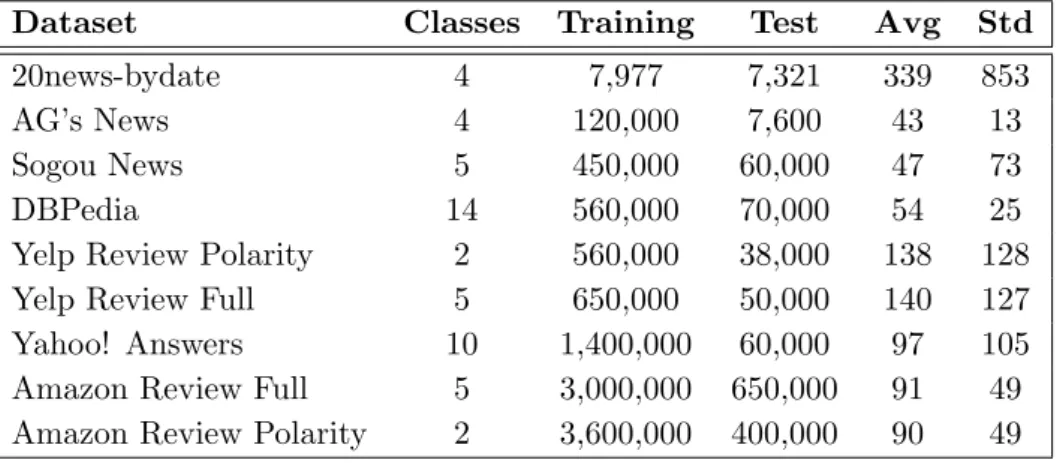
Zhanget al. [24] introduced several large-scale datasets which covers several text clas-sification tasks such as sentiment analysis, topic classification or news categorization. In these datasets, the number of training samples varies from several thousand to mil-lions, which is considered ideal for deep learning based methods. In addition, we used the 20news-bydate dataset to test various parameters associated with the encoding ap-proach. A summary of the statistics for each dataset is listed in Table 2.1.
Table 2.1: Statistics of 20news-bydate and large-scale datasets presented in Zhang et al.[24]. The 2 rightmost columns show the average (Avg) and standard deviation (Std) for the number of words contained in text documents.
Dataset Classes Training Test Avg Std
20news-bydate 4 7,977 7,321 339 853
AG’s News 4 120,000 7,600 43 13
Sogou News 5 450,000 60,000 47 73
DBPedia 14 560,000 70,000 54 25
Yelp Review Polarity 2 560,000 38,000 138 128 Yelp Review Full 5 650,000 50,000 140 127 Yahoo! Answers 10 1,400,000 60,000 97 105 Amazon Review Full 5 3,000,000 650,000 91 49 Amazon Review Polarity 2 3,600,000 400,000 90 49
2.5 Experiments and Results 13
Figure 2.6: Five encoded images obtained using different Word2Vec features length and using the same document belonging to the 20news-bydate dataset. All the images are encoded using spaces= 12, superpixel size 4×4, image size = 256×256 and visual word widthV = 16. The two leftmost images contain all words in the document encoded with 12 and 24 Word2Vec features respectively, while 3 rightmost encoded images with 36, 48 and 60 features length cannot encode entire documents.
2.5 Experiments and Results
The aim of these experiments is as follow: (i) to evaluate configuration parameters associated with the encoding approach; (ii) to compare the proposed approach with other deep learning methods.
In experiments, percentage error is used to measure the classification performance. The encoding approach mentioned in Section 2.3.1 produces encoded image based on Word2Vec word embedding. These encoded images can be used to train and test a CNN. We used AlexNet [21] and Googlenet [22] architectures as base models from scratch. We used a publicly available Word2Vec word embedding with default configuration parame-ters as in [27] to train word vectors on all datasets. Normally, Word2Vec is trained on a large corpus and used in different contexts. However, in our work, we trained this model with the same training set for each dataset.
2.5.1 Parameters Setting
We used 20news-bydate dataset to perform a series of experiments with various settings to find out the best configuration for the encoding scheme.
In our first experiment, we changed the space samong visual words and Word2Vec feature length to identify relationships between these parameters. We obtained a lower percentage error with higher values of s parameter and higher number of Word2Vec features as shown in Table 2.2. We observed that the length of feature vector vk(tk) depends on the nature of the dataset. For example in Fig. 2.6, a text document composed of a large number of words cannot be encoded completely using high number of Word2Vec features, because each visual word occupies more space in the encoded image. Moreover, we found out that error does not decrease linearly with the increase of Word2Vec features, as shown in Table 2.3.
Table 2.2: Comparison between CNNs trained with different configurations on our proposed approach. The width V (in superpixels) of visual words is fixed while the Word2Vec encoding vector size and space s (in pixel) varies. H is the height of visual word obtained. s V H w2v feat. error (%) 4 4 1 12 7.63 8 4 1 12 5.93 12 4 1 12 4.45 16 4 1 12 4.83 4 4 2 24 6.94 8 4 2 24 5.60 12 4 2 24 5.15 16 4 2 24 4.75 4 4 3 36 6.72 8 4 3 36 5.30 12 4 3 36 4.40 16 4 3 36 4.77 2 4 6 8 10 12 14 16 18 4 8 12 16 E rro r (%) space (s) Image augmentation crop 227, no mirror crop 227, mirror no crop, no mirror
(a) Classification error using data augmentation: (mirror andcrop) over the 20news-bydate test set.
2.5 Experiments and Results 15 V W−1 V W−2 V W−3 V W−4 V W−5 4.5 5 5.5 6 6.5 7 7.5 4 8 12 16 E rro r (%) space (s) Different visual word shapes
VW-1 VW-2 VW-3 VW-4 VW-5
Figure 2.8: On the left, five different designs for visual words (V W) represented by 36 Word2Vec features, over the 20news-bydate dataset. The width V of these words is 4 for the first two on the top and 6 for the rest. The first four visual words consist of super pixels with different shapes to form particular visual words. On the right, a comparison over these different shapes of visual words.
We tested various shapes for visual words before selecting the best one, as shown in Fig. 2.8 (on the left). We showed that the rectangular shaped visual words obtained higher perforance as highlighted in Fig. 2.8 (on the right). Moreover, the spacesbetween visual words plays an important role in the classification, in fact using a high value for the
sparameter, the convolutional layer can effectively distinguish among visual words, also demonstrated from the results in Table 2.2. The first level of a CNN (conv1) specializes convolution filters in the recognition of a single superpixel as shown in Fig. 4.3. Hence, it is important to distinguish between superpixels of different visual words by increasing the parameter s.
These experiments led us to the conclusion that we have a trade-off between the number of Word2Vec features to encode each word and the number of words that can be represented in an image. In fact, increasing the number of Word2Vec features increases the space required in the encoded image to represent a single word. Moreover, this aspect affects the maximum number of words that may be encoded in an image. The choice of this parameter must be done considering the nature of the dataset, whether it is characterized by short or long text documents. For our experiments, we used a value of 36 for Word2Vec features, considering results presented in Table 2.3.
2.5.2 Data Augmentation
We encode the text document in an image to exploit the power of CNNs typically used in image classification. Usually, CNNs use “crop” data augmentation technique to obtain robust models in image classification. This process has been used in our experiments and we showed that increasing the number of training samples by using thecrop parameter,
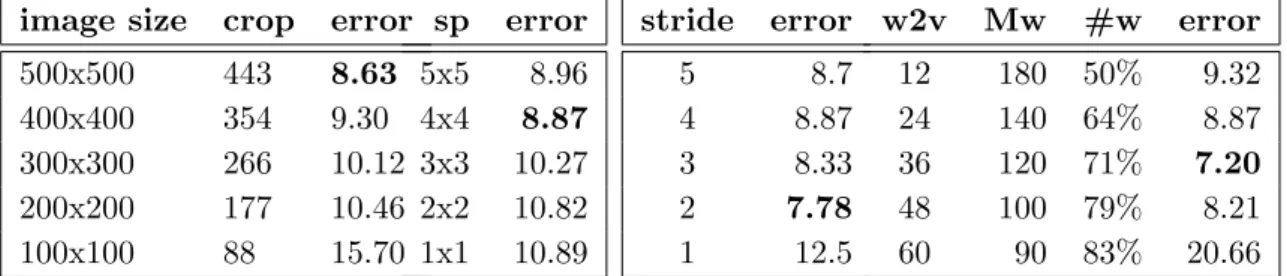
Table 2.3: Comparison of different parameters over the 20news-bydate dataset. In the leftmost table we changed the size of the encoded image from 100×100 to 500×500 and the crop size is also changed by multiplying the image size with a constant i.e. 1.13. Here sp stands for superpixel, w2v is for number of Word2Vec features, Mw stands for Max number of visual words that an image can contain and#w is the number of text documents in the test set having a greater number of words than Mw. We fixed the remaining non-specified parameters as follow: s= 12,V = 4,sp= 4, image size= 256.
image size crop error
500x500 443 8.63 400x400 354 9.30 300x300 266 10.12 200x200 177 10.46 100x100 88 15.70 sp error 5x5 8.96 4x4 8.87 3x3 10.27 2x2 10.82 1x1 10.89 stride error 5 8.7 4 8.87 3 8.33 2 7.78 1 12.5 w2v Mw #w error 12 180 50% 9.32 24 140 64% 8.87 36 120 71% 7.20 48 100 79% 8.21 60 90 83% 20.66
results are improved. More precisely, during the training phase, 10 random 227×227 crops are extracted from a 256×256 image (or proportional crop for different image size, as reported in the leftmost Table 2.3) and then fed to the network. During the testing phase we extracted a 227×227 patch from the center of the image. It is important to note that thanks to the space sintroduced around the encoded words, the encoding of a text document in the image is not changed by cropping. So, cropping is equivalent to producing many images with the same encoding but with a shifted position.
The “stride” parameter is very primary in decreasing the complexity of the network, however, this value must not be bigger than the superpixel size, because larger values can skip too many pixels, which leads to information lost during the convolution, invalidating results.
We showed that the mirror data augmentation technique, successfully used in im-age classification, is not recommended here because it changes the semantics of the encoded words and can deteriorate the classification performance. Results are presented in Fig. 2.7a.
2.5.3 Encoded Image Size
We used various image sizes for the encoding approach. Fig. 2.5 shows artificial images built on top of Word2Vec features with different sizes. As illustrated in Table 2.3, percentage error decreases by increasing the size of an encoded image; however, we observed that sizes above 300×300 is computationally intensive; hence, this lead us to chose an image size of 256×256, typically used in AlexNet and GoogleNet architectures.
2.5 Experiments and Results 17
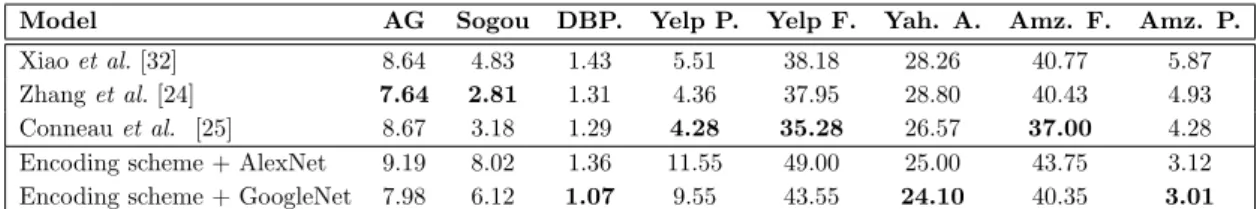
Table 2.4: Testing error of our encoding approach on 8 datasets with Alexnet and GoogleNet.
Model AG Sogou DBP. Yelp P. Yelp F. Yah. A. Amz. F. Amz. P.
Xiaoet al.[32] 8.64 4.83 1.43 5.51 38.18 28.26 40.77 5.87
Zhanget al.[24] 7.64 2.81 1.31 4.36 37.95 28.80 40.43 4.93 Conneauet al. [25] 8.67 3.18 1.29 4.28 35.28 26.57 37.00 4.28 Encoding scheme + AlexNet 9.19 8.02 1.36 11.55 49.00 25.00 43.75 3.12 Encoding scheme + GoogleNet 7.98 6.12 1.07 9.55 43.55 24.10 40.35 3.01
Table 2.5: Percentage errors on 20news-bydate dataset with three different CNNs. CNN architecture error
Encoding scheme + AlexNet 4.10 Encoding scheme + GoogleNet 3.81 Encoding scheme + ResNet 2.95
2.5.4 Comparison with Other State-of-the-art Text Classification
Meth-ods
We compared our approach with several state-of-the-art methods. Zhang et al. [24] presented a detailed analysis between traditional and deep learning methods. From their work, we selected best results and reported them in Table 2.4. In addition, we compared our results with Conneau et al. [25] and Xiaoet al. [32] . We obtained state-of-the-art results on DBPedia, Yahoo Answers! and Amazon Polarity datasets, while comparative results on AGnews, Amazon Full and Yelp Full datasets. However, we obtained higher error on Sogou dataset due to the translation process [24].
It is interesting to note that the works in [24, 25] are text adapted variants of con-volutional neural networks [21, 31] developed for computer vision. Therefore, we obtain similar results to these works. However, there is a clear performance gain compared to the hybrid of convolutional and recurrent networks [32].
2.5.5 Comparison with State-of-the-art CNNs
We obtained better performance using GoogleNet, as expected. We therefore believe that recent state-of-the-art network architectures, such as Residual Network would fur-ther improve the performance of our proposed approach. To work successfully with large datasets and powerful models, a high-end hardware and large training time are required, thus we conducted experiments only on 20news-bydate dataset with three network archi-tectures: AlexNet, GoogleNet and ResNet. Results are shown in Table 2.5. We achieved better performance with powerful network architecture.
2.6 Conclusion
We presented a novel text classification approach to transform Word2Vec word embed-ding of text documents into encoded images to exploit CNNs models for text classi-fication. In addition, we presented a detailed study on various parameters associated with the encoding scheme. We obtained state-of-the-art results on some datasets while in other cases our approach obtained comparative results. We showed that the CNN model generally used for image classification is successfully employed for text classifica-tion. As shown in the experiment section, the trend in results clearly show that, we can further improve results with more recent and powerful deep learning models for image classification.
3
Learning Deep Latent Space Representations
3.1 Introduction
The recent success in various computer vision tasks including visual object classifica-tion [21, 22] and speech recogniclassifica-tion [34], demonstrated that representaclassifica-tions play a crucial role in the performance of machine learning models. Bengio et al. [18] pointed out some of the properties of good representations including smoothness, temporal and spatial co-herence, sparsity, and natural clustering. In last decade, there has been a paradigm shift in representations from hand crafted to convolutional neural networks based representa-tions. Moreover, Razavian et. al [35] showed that CNNs based representations are more powerful than hand crafted on various image recognition tasks. Similarly, CNNs based word embeddings or representations [36] in natural language processing have replaced text representations developed on counting word occurrences. Furthermore, good multi-modal representations are important for the improved performance of machine learning models. CNNs have become a de facto method to extract representation from unimodal modality [18]. and are extensively employed to represent audio, textual and visual data. In addition, these CNNs are increasingly used in the multimodal domain [37, 38, 39].
Recent years have seen a surge in tasks based on multimodal tasks including classi-fication [4, 5, 6], semantic relatedness [8, 9], Visual Question Answering [10, 11], mul-timodal named entity recognition [14, 15, 16, 17], cross-modal retrieval [7, 40] and ver-ification [41, 42]. In the existing systems, neural network based mappings have been commonly used to bridge the gap between multiple modalities in building a joint repre-sentation of each modality [43, 44]. Typically, separate networks are trained to predict
features of each modality and a supervision signal is employed to reduce the distance be-tween modalities [7, 40, 41, 42, 45, 46, 47, 48]. In addition, these works require pairwise or triplet selection at the input for training. Though by using separate networks in pairs or triplets, these systems were able to achieve good performance, however, they incur significant memory overheads. In many modern applications such as mobile devices, memory is a scarce resource therefore less memory demanding systems are required. Furthermore, both pairwise and triplet based systems suffer fromata expansion when constituting the sample pairs or sample triplets from the training set.
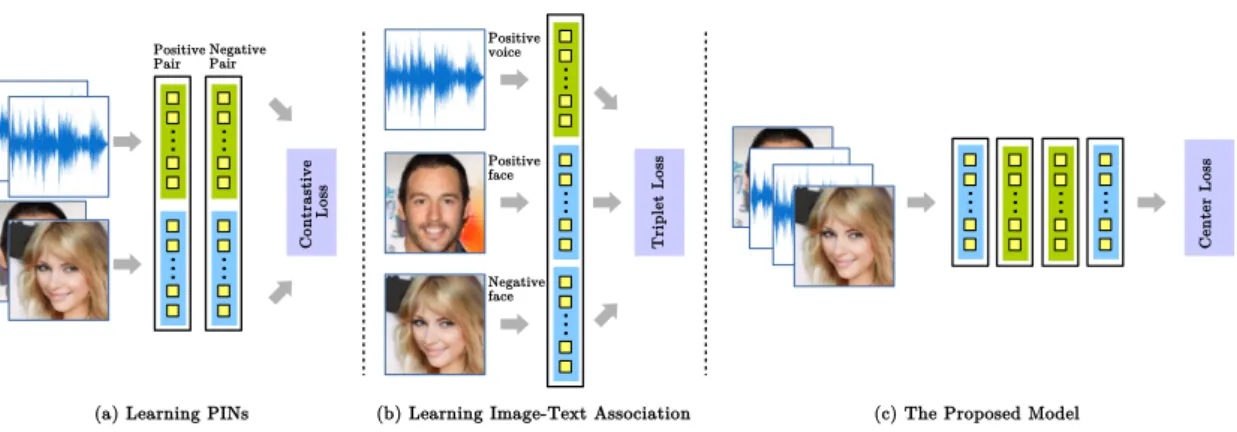
To address these issues, we introduced a deep latent space representations coupled with a single stream network (SSNet) to merge multiple modalities (text/image and audio/image) without needing a separate network for individual modality. We propose a loss function inspired from [49] as a supervision signal to map multiple modalities “nearer” to each other in the shared latent space. As a result, the proposed framework does not require complex recombination at the input. Figure 3.1 shows a generic illustra-tion of existing systems along with the proposed framework. We employed the proposed framework in three cross-modal tasks including retrieval, matching and verification using benchmark datasets.
3.2 Related Work
Several works in the field of multimodal representation and learning have been proposed over recent years. Although each multimodal task is different from others, the underlying principle is relatively the same: to achieve semantic multimodal alignment. In this section we explore the related literature under different subsections.
One of the classical approaches towards image-text embedding is Canonical Cor-relation Analysis (CCA) [50]. The method finds linear projections that maximize the correlation between modalities. Works such as [51, 52] incorporate CCA to map rep-resentations of image and text to a common space. Although it is rather a classical approach, the method is efficient enough. Recently, deep CCA has also been employed to the problem of obtaining a joint embedding for multimodal data [53]. However, the major drawback is that using CCA it is computationally expensive i.e. it requires to load all data into memory to compute the covariance score.
Deep metric learning based approaches have shown promising results on various computer vision tasks. Metric learning to multimodal tasks requires within-view neigh-borhood preservation constraints which is explored in several works [54, 55, 56]. Triplet networks [57, 58] along with Siamese networks [59, 60] have been used to learn a sim-ilarity function between two modalities. However, most of these techniques [7, 42, 40] require separate networks for each modality which increase the computational complex-ity of the whole process significantly. Furthermore, these networks suffer from dramatic
3.3 The Proposed Framework 21
Figure 3.1: The proposed cross-modal framework (c) based on single stream network and a novel loss function to embed both modalities in the same latent space, compared with a Siamese network (a) and a Triplet network (b). In (c) the single stream network extracts the representation from both modalities while the loss function learns to bridge the gap between them.
data expansion at the input while creating sample pairs and triplets from training set. Many different multimodal approaches employ some kind of ranking loss function as a supervision signal. Works presented in [61, 62] employ a ranking loss which penalizes when incorrect description is ranked higher than the correct one. Similarly, the ranking loss can be employed in bi-directional fashion where the penalty is based on retrieval of both modalities.
Jointly representing multiple modalities on a common space can also be employed for classification purposes. Work in [63] employs classification loss along with two neural networks for both modalities (text and image) for zero-shot learning. Work in [64] employs attention-based mechanism to estimate the probability of a phrase over different region proposals in the image. In nearly every visual question answering (VQA) method, separate networks are trained for image and text; however, [65] treats the problem as a binary classification problem by using text as input and predicting whether or not an image-question-answer triplet is correct using softmax.
In the current chapter, we extract representation from multiple modalities with a sin-gle stream network instead of two branch network without pairwise or triplet information at the input.
3.3 The Proposed Framework
The proposed framework reduces the gap between multiple modalities. The approach eliminates the need for multiple networks for each modality, since representation can be extracted with a single stream network. Figure 4.2(c) shows the proposed model.
The details of the proposed approach are presented in the following subsections. In Subsection 3.3.1, 3.3.2 and 3.3.3, we explain various mechanisms employed to extract the representations of text, audio and image modalities. While Subsection 3.3.4 provides details of the single stream network along with the objective function to bridge the gap between various modalities.
3.3.1 Encoding Text Descriptions
Semantics plays a crucial role to understand the meaning of a text description. Humans can understand semantics easily, however the same performed automatically becomes a challenging task. Word2Vec word embedding [36] takes one step towards mathemat-ically representing the semantic relationships between words. Its objective function causes words that occur in a similar context to have similar word embedding. We pro-pose presented an encoding scheme exploiting Word2Vec to reconstruct the semantics associated with a text description as an image [66]. We employ this encoding scheme to encode text descriptions as images and use these encoded text images as input to the neural networks originally developed for image input. We explain the encoding scheme to transform a text description into an image in Figure 3.2. The encoding scheme extracts the Word2Vec emdedding of a word, then normalize each component to assume values in the interval [0. . .255]. Finally, the normalized values are interpreted in triplets as RGB sequence. This encoding scheme enabled us to use a single stream network for both text to image and image to text retrieval. The single stream network based cross-modal re-trieval has potential for memory efficient and computationally-inexpensive applications on low powered devices.
3.3.2 Audio Signals
In addition to the encoded text input, audio signals are also fed to the network. The encoded audio signals are short term magnitude spectrograms generated directly from raw audio of length three seconds. The audio stream is extracted, converted to a single channel at 16 kHz sampling rate, spectrograms are then generated in a sliding window fashion using a hamming window [67, 41]. The generated spectrograms are used as input to a standard neural network.
3.3.3 Visual Signals
The input to the proposed single stream network consists of three channel (RGB) image. Other modalities (audio and text) are transformed into similar visual signals through en-coding schemes mentioned earlier in Subsection 3.3.1 and 3.3.2. These enen-coding schemes are extremely helpful to employ the the single stream network.
3.3 The Proposed Framework 23
Figure 3.2: The word “tablet” is encoded into an image using Word2Vec encoding with vector length 15. Consecutive words in the text descriptions are encoded as image preserving relative position of each word. Note that words that occur in similar context will have similar embedding, thus the encoding will be similar in color space. (Best viewed in color)
3.3.4 The Single Stream Network
The deep latent space representation and learning framework coupled with a single stream network extracts features from multiple modalities to minimize intra and cross modality variations. Suppose there are ns samples of a modality associated with ni samples of second modality in a class c. Data from both modalities is input to the network andns+ni feature vectorsfc are obtained at the output of the network. During training, geometric centers of ns+ni feature vectors is computed and the objective function consisting of the distancedof each feature vector from the center, is minimized for all the classes.
d(fc) = ns+ni X i=1 kfi− 1 ns+ni ns+ni X j=1 fj k22 (3.1) Thus, during the training phase, data from both modalities is treated in similar fashion and the proposed single stream network can effectively bridge the gap between two modalities removing the need of multiple networks. In the implementation, instead of using the traditional loss functions, we extend center loss for learning deep latent space jointly trained with softmax loss [49]. This loss function simultaneously learns centers for all classes and minimizes the distances between each center and the associated samples from both modalities. It thus imposes neighborhood preserving constraint within each modality as well as across modalities. If there are n classes in a mini batch M with m
samples, the loss function is given by
L(M) =− m X i=1 log e WT yifi+byi Pn j=1eW T jfi+bj + λ 2 n X c=1 d(fc) (3.2)
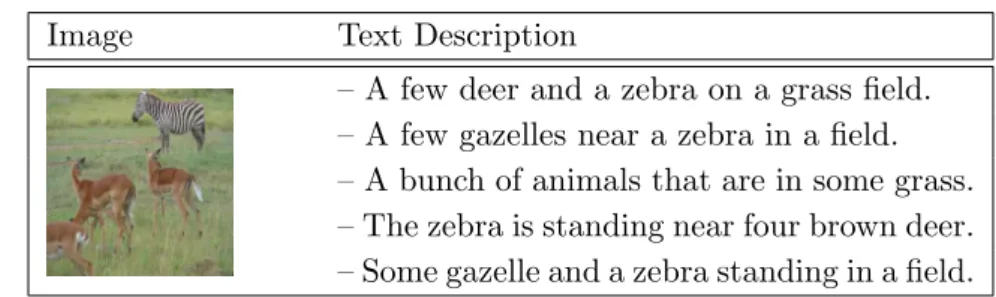
Image Text Description
– A few deer and a zebra on a grass field. – A few gazelles near a zebra in a field. – A bunch of animals that are in some grass. – The zebra is standing near four brown deer. – Some gazelle and a zebra standing in a field.
Figure 3.3: A random example taken from MSCOCO dataset. The dataset consists of samples made of an image and 5 representative text descriptions.
In Eq. 3.2, fi ∈Rd denotes the i-th deep feature, belonging to the yj-th class. d is the feature dimension. Wj ∈Rddenotes thej-th column of the weightsW ∈Rd×nis the last fully connected layer andb ∈Rn is the bias term. A scalarλis used for balancing the two loss functions. The conventional softmax loss can be considered as a special case of this joint supervision, if λis set to 0 [49].
This loss function minimizes the variation between the two modalities and effectively preserves the neighborhood structure. In this way, modalities which do not belong to the same class do not occur in the same neighborhood. The proposed framework is generic and an appropriate deep network can be employed to extract representations from both modalities. In the implementation, InceptionResNet-V1 is used as a single stream network for joint embedding of two modalities (text/image or audio/image).
3.4 Experiments
We perform series of experiments on various tasks consisting of cross-modal retrieval,
matching and verification to evaluate the embedding learned by the single stream net-work under the proposed framenet-work. The experimental setup and dataset details are explained below.
3.4.1 Datasets
We evaluate the proposed framework on two publicly available benchmark datasets in-cluding MSCOCO [68] and VoxCeleb [67]. MSCOCO dataset is employed for cross-modal task on text/image, while VoxCeleb dataset is used for cross-modal matching and ver-ification tasks on audio/image. MSCOCO dataset contains 123,287 images, and each image is annotated with 5 captions. Figure 3.3 shows a random example selected from MSCOCO dataset. We use 1000 images for testing and the rest for training as proposed by the original authors [68] and used by Wanget al. [7] and referred it as COCO-1k.
ex-3.4 Experiments 25
Figure 3.4: An audio-visual example extracted from Voxceleb dataset.
tracted from interview videos uploaded to YouTube [67]. Figure 3.4 shows an example of audio-visual information taken from VoxCeleb dataset. We two train/test splits out of this dataset to perform various cross modal tasks as recommended by [42]. The first split consists of disjoint videos from the same set of speakers while the second split contains disjoint identities. We train the model using two training sets, allowing us to evaluate on both test sets, the first one for seen-heard identities and the second for
unseen-unheard identities.
3.4.2 Experimental Setup
We perform three different experiments which are as below.
3.4.2.1 Cross-modal Retrieval
In the first task, we evaluate the learned embedding onretrieval with MSCOCO dataset. Given a single modality input, the task is to retrieve all the semantic matches of the opposite modality. We perform this task for both Image → Text and Text → Image formulation. For the sake of comparison with other techniques, we use R@K metric as described in [69]. We employ theR@1,R@5 andR@10 which means that the percentage of queries in which the first 1, 5 and 10 items are found in the ground truth.
3.4.2.2 Cross-modal Verification
The second task is to perform verification on VoxCeleb dataset where the goal is to verify if audio segment or a face image belong to the same identity. Two inputs are considered i.e. face and voice and verification between the two depends on a threshold on the similarity value. The threshold can be adjusted in accordance to wrong rejections of true match and/or wrong acceptance of false match. We report results on verification metrics i.e. ROC curve (AUC) and Equal Error Rate (EER).
3.4.2.3 Cross-modal Matching
Finally, the last task consists of matching on VoxCeleb dataset where the goal is to match the input modality (probe) to the varying gallery size nc which consists of the other modality. We increase nc to determine how the results change. For example, the 1 : 2 task, we are given a modality at input, e.g. face, and the gallery consists of two inputs from other modality, e.g. audio. One of them contains a true match and other serves as an imposter input. We employ matching metric i.e. accuracy to report results. We perform this task in five settings where in each setting the nc is increased i.e. 2,4,6,8,10.
3.4.3 Implementation Details
We learn the proposed single stream network with standard hyper-parameters setting. The size of the input image and encoded text is set to 128×128 on MSCOCO dataset for retrieval task while the input image and spectrogram is set to 256×256 on VoxCeleb dataset for verification and matching tasks. The output feature vector is 128−dextracted from the last fully connected layer of the single stream network. For optimization we employ Adam optimizer [70] because of its ability to adjust the learning rate during training. We use Adam’s initial learning rate of 0.05 and employ weight decay strategy with decaying by a factor of 5e−5. Two networks are trained for 100 epochs on MSCOCO and VoxCeleb. The mini-batch size was fixed to randomly select 45 samples from the training set.
3.5 Evaluation
3.5.1 Cross-modal Retrieval
In this section we evaluate the results ofcross-modal retrieval task employing both text and image as probe with other modality at the retrieval end. We report results in terms of R@K metric which evaluates the top K retrieved results. Table 3.1 demonstrates quantitative results of our approach on the said task. Compared to the current state-of-the-art, our proposed framework performance is comparatively low. The main reason is due to the fact that R@K is based on whether query’s pair appeared or not in the retrieval result. So, even if retrieval result is semantically similar and if query’s pair did not appear in the retrieval result, theR@K score is considerably low.
3.5.2 Cross-modal Verification
In this section we report results of the framework oncross-modal verification task, the aim of which is to determine whether an audio segment and a face image are from
3.5 Evaluation 27
Table 3.1: Comparison of the proposed framework with current state-of-the-art methods on cross-modal retrieval using R@K measure on MSCOCO dataset.
MSCOCO
Model Image-to-Text Text-to-Image R@1 R@5 R@10 R@1 R@5 R@10 DVSA [12] 38.4 69.9 80.5 27.4 60.2 74.8 HM-LSTM [71] 43.9 - 87.8 36.1 - 86.7 m-RNN-vgg [72]) 41.0 73.0 83.5 29.0 42.2 77.0 Order-embedding [69] 46.7 - 88.9 37.9 - 85.9 m-CNN(ensemble) [73] 42.8 73.1 84.1 32.6 68.6 82.8 TextCNN [74] 13.6 39.6 54.6 10.3 35.5 55.5 FV-HGLMM [74] 14.3 40.5 55.8 12.7 39.0 57.2 Str. Pres. [7] 50.1 79.7 89.2 39.6 75.2 86.9 Proposed SSNet 40.0 64.4 76.7 30.9 62.7 73.7
the same identity or not. Recently [42] used VoxCeleb dataset to benchmark this task under two evaluation protocols, one for seen-heard identities and the other for unseen-unheard identities. We evaluate on the same test pairs1created in [42] for each evaluation
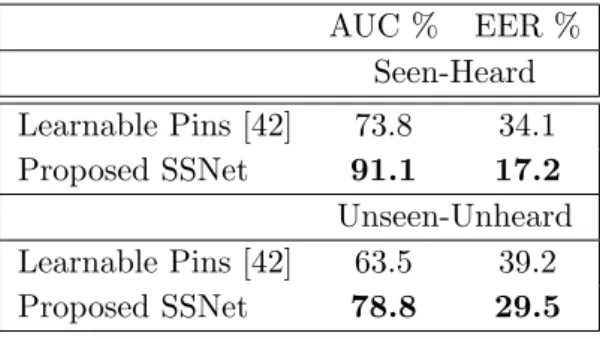
formulation. More specifically, 30,496 pairs fromunseen-unheard identities and 18,020 pairs fromseen-heard identities are selected. The results for cross-modal verification are reported in Table 3.2. We use AUC and EER metrics for verification. As can be seen from the table, our model trained from scratch outperformed the state-of-the-art work on seen-heard and unseen-unheard protocols.
Furthermore, we examine the effect of Gender (G), Nationality (N) and Age (A) separately, which influence both face and voice verification. It is important to note that [42] employed pre-trained network, whereas we trained the model from scratch. Our network outperformed on G, N, A and the combination (GNA) inseen-heardformulation regardless of pre-trained network as a backbone, see Table 3.3. However, our network shows comparable results on unseen-unheard formulation for N,A and GNA, whereas it outperformed on random and G regardless of pre-trained network, see in Table 3.3.
3.5.3 Cross-modal Matching
In this section we perform thecross-modal matching task employing the framework. We perform the 1 :nc wherenc = 2,4,6,10 matching tasks to evaluate the performance of our approach. Unlike others [41, 42], we do not require positive or negative pair selection since under the proposed framework, the network learns in a self-supervised manner.
1
Table 3.2: Cross-modal verification results on seen-heard and unseen-unheard configu-rations with model trained from Scratch.
AUC % EER % Seen-Heard Learnable Pins [42] 73.8 34.1 Proposed SSNet 91.1 17.2 Unseen-Unheard Learnable Pins [42] 63.5 39.2 Proposed SSNet 78.8 29.5
Table 3.3: Analysis of cross-modal biometrics under varying demographics for seen-heard and unseen-unheard identities. Note that SSNet has produced best results when trained from scratch.
Demographic Criteria Configuration Random G N A GNA Seen-Heard (AUC %)
Learnable Pins [42] Scratch 73.8 - - - -Learnable Pins [42] Pre-train 87.0 74.2 85.9 86.6 74.0 Proposed SSNet Scratch 91.2 82.5 89.9 90.7 81.8
Unseen-Unheard (AUC %)
Learnable Pins [42] Scratch 63.5 - - - -Learnable Pins [42] Pre-train 78.5 61.1 77.2 74.9 58.8
Proposed SSNet Scratch 78.8 62.4 53.1 73.5 51.4
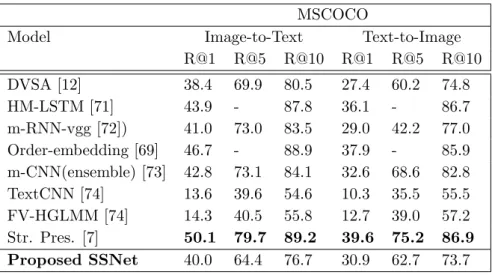
Table 3.4 reports results on said task along with comparison with recent approaches on the same task. In Table 3.4, the probe is voice while the matching gallery consists of faces. For instance consider the case where the input is voice and is 1 : 2 matching task, we figure out the entry in gallery that matches the input. It is important to note that for nc > 2 tasks, the work in [41] trains separate network for each nc. However, the major advantage of training under the proposed framework is that it is not restricted by increasing nc. Thus, the proposed single stream network can effectively handle nc size without increasing sub-network size to categorize each nc. However, increasing nc decreases performance in a linear fashion due to increase in challenge.
3.5 Evaluation 29
Table 3.4: Accuracy score of cross-modal forced matching task comparing Learnable PINS [42], SVHF-Net [41] and SSNet.
Inputs Learnable PINS. SVHF-Net Proposed SSNet Voice →Face (%) 2 84 78 78 4 54 46 56 6 42 39 42 8 36 34 36 10 30 28 30 3.5.4 Qualitative Evaluation
Figure 3.5 is t-SNE [75] visualization of features from MSCOCO test set i.e. 1k images with five text descriptions for each image. Once the network is trained on the dataset, features of the test set are extracted from the model and are fed to t-SNE, Visualiza-tion verify that the proposed framework is capable of bridging gap between image and encoded text description in the latent space. The image and text encoding description are overlapped and distributed enough for being discriminated in retrieval. Some bidi-rectional retrieval results from MSCOCO test set are also present in Figure 3.6. It can be seen that query and retrieved objects are related.
Figure 3.6 is tSNE [75] embedding result of learned features extracted from test set of VoxCeleb dataset for 10 identities. We visualize learned embedding for both formulations i.e. seen-heard and unseen-unheard. Visual illustrations support the hypothesis that no pair selection knowledge at pre/post processing stage is required for network to learn mapping of identities in shared latent space. Given the faces and voices at input, the network learns to map both modalities conditioned at class information due to formulated loss function in Eq. 3.2. Note that, unseen-unheard formulation has very high level of difficulty even though results shown in Figure 3.6 are impressive.
3.5.5 Ablation Study
We experiment with the hyperparameterλwhich is used to couple conventional softmax with the proposed loss signal, see Eq 3.2. When the value of λ is fixed to 0, the loss function is a special case where only softmax’s penalization is employed. Increasing value of λintroduce the increasing effect of coupled penalization. We experiment with two values of λ where we set it to 0 and 1 for two evaluation protocol of cross-modal verification and forced matching. The quantitative scores are reported in Table 3.5 and 3.6. In these experiments, onlyλis varied otherwise joint formulation configuration is same as for previous experiments. These experiments explain the crucial need for
Text
- A group of people on a pavement and one flying a kite. - A group of people flying a kite on a sunny day.
- A group of people walking in a single file up a slope.
- Some people on a hill flying their kites. - A group of people flying a kite by the ocean.
- A train that is on a railroad track. - A train runs on rails, visible through a fence. - Train tracks in the background taken from behind a fence. - A read train going along a track during the day. - A train on the tracks behind a fence.
A street with busses and cars next to a bus stop.
- A living room with a picture window and outside view. - A daylight lit neatly decorated living room with sliding glass doors.
- A living room with furniture, a fireplace and a large scenic window.
- There is a living room with chairs and tables and a mirror on it. - A view into a living room containing several pieces of furniture.
Skierstanding in the sun holding ski poles.
A manriding on top of a board on water.
- Man hitting a tennis ball on a blue tennis court. - A man plays tennis on a tennis court. - A male tennis player is swinging to hit the ball. - A male in a white shirt is playing tennis - A man is playing tennis on the tennis court.
Figure 3.5: Embedding of MSCOCO test set in latent space visualized using t-SNE [75]. The similar text feature vectors (shown in red) and the image feature vectors (shown in blue) are close in the embedding space. Few bidirectional retrieval results are also shown which are similar. (Best viewed with color)
Figure 3.6: Visualization of learned voice and face embedding extracted from test set of the VoxCeleb dataset for 10 identities. The pink oval encloses female entities while the male entities are enclosed in blue one. (Best viewed in color)
penalization beyond softmax in the proposed setting and establish the effectiveness of penalization based on centers for tasks such as verification, matching and retrieval.
3.6 Conclusion
In this chapter, a framework is proposed for deep latent space representation and learning based on a single stream network for multimodal applications. The proposed framework is applied on three cross-modal tasks including retrieval, verification and matching on
3.6 Conclusion 31
Table 3.5: Cross-modal Verification results on seen-heard and unseen-unheard configu-rations to illustrate the effect of proposed loss function.
Configuration AUC % EER % Seen-Heard λ= 0.0 81.2 26.3 λ= 1.0 91.1 17.2 Unseen-Unheard λ= 0.0 72.6 33.6 λ= 1.0 78.8 29.5
Table 3.6: Accuracy score of cross-modal forced matching task to illustrate the effect of proposed loss function.
Inputs λ= 0.0 λ= 1.0 Voice →Face (%) 2 73 78 4 49 56 6 38 42 8 34 36 10 29 30
text/image and audio/image modalities. The proposed framework was able to reduce the gap between different modalities by learning a shared latent space. Thus the frame-work can generate discriminative representations of various modalities. The proposed framework requires encoding schemes to transform text or audio signals to images. The performance of the proposed system may increase if better encoding schemes are learnt. In future, we will investigate other encoding schemes more suitable for single stream networks. One of the core strengths of reliance on learning features in a shared la-tent space is no overhead of pair or triplet selection at the input. As dataset increases exponentially over time, so does the overhead of pairs or triplets selection in the exist-ing methods. The proposed framework ensures that class information is leveraged to penalize distance between learned embedding. We achieved state-of-the-art results for verification and matching on VoxCeleb dataset while promising results on MSCOCO dataset.
4
Learning Deep Fused Representation
4.1 Introduction
Information in real-world applications usually comes from multiple sources. Images are often associated with tags or captions; for example in the world of e-commerce products on sale are displayed using one or more images with one or more text descriptions such as product title, summary and technical details. Each source is characterized by distinct statistical properties that makes it difficult to create a joint representation that uniquely captures the “concept” in the real-world. For example, Figure 4.1 shows four advertisements, where, in the first row, two objects have seemingly similar images but different text descriptions, conversely, in the second row, we have two different images but similar text descriptions. For an image classification model it would not be easy to distinguish two images on the first row while it would have no difficulty in distinguishing images on the second one. Similarly, for a text classification model it would be difficult to classify two text descriptions on the second row while it would have no difficulty in classifying correctly descriptions shown on the first one. Such scenarios present a challenge to create a joint representation of an image and associated text description. This leads us to create a representation for such classification problem. This representation can exploit such scenarios to remove ambiguity and improve classification performance.
The use of joint representation based on image and text features is extensively em-ployed on a variety of tasks including modeling semantic relatedness, compositionality, classification and retrieval [76, 77, 78, 9, 5]. Typically, in such approach, image features
are extracted using CNNs. Whereas, to generate text features, Bag-of-Words models or Log-linear Skip-gram Models [79] are commonly employed. This represents a challenge to find relationships between features of multiple modalities along with representation, translation, alignment, and co-learning as stated in [80]
(a) Huawei Mediapad M3 Lite Tablet, 10” Display, Qualcomm MSM8940 CPU, Octa-Core, 3 GB RAM, 32 GB ROM.
(b) DVD player with 25.7 cm HD 1024 * 600 monitor, HDMI, USB, SD. Ultra thin touch screen LCD key by Hengweili.
(c) Men’s hybrid bicycle with alu-minum frame and Shimano SLX M7000 11-speed gearbox.
(d) Shimano SLX M7000 11-speed gearbox with derailleur gears and chain.
Figure 4.1: In the upper row, two examples of ambiguous images that can be disam-biguated through analysis of the respective text description. In the lower row, two examples of ambiguous text description that can be disambiguated through analysis of respective images.
Traditionally, there are two general strategies for text and image fusion referred to as early and late fusion [81, 80]. In early fusion [82, 78], features from each modality are concatenated in a single vector and fed as input to a classification unit. In contrast,
4.2 The Proposed Approach 35
Figure 4.2: The proposed encoded text and image fusion model for deep multimodal classification. The text is encoded within the image so that the CNN model can exploit semantics along with the information of the image.
late fusion [6, 83] uses decision values from each classification unit and fuses them using a fusion mechanism employing a weight sharing strategy. The work in [6] showcases a comparative study of multimodal fusion methods to perform multimodal classification in real-world scenarios. Specifically, in [6], late fusion produced better performance com-pared to early fusion method, however, late fusion comes with the price of an increased learning effort. Recently, [5], fuses data from discrete (text) and continuous (image) domains and showcases the efficiency of fusion strategies in terms of learning and com-putational expense. Our approach is similar to early fusion strategy, where a single classifier is needed to perform multimodal classification, as stated in [81, 80]. However, we concatenate encoded text features into an image to obtain an information enriched image. Finally, an image classification model is trained and tested on these images. In-tuitively, concatenating text d
![Table 3.4: Accuracy score of cross-modal forced matching task comparing Learnable PINS [42], SVHF-Net [41] and SSNet.](https://thumb-us.123doks.com/thumbv2/123dok_us/39203.2505485/43.892.202.634.211.374/table-accuracy-score-forced-matching-comparing-learnable-ssnet.webp)