University of Massachusetts Medical School
University of Massachusetts Medical School
eScholarship@UMMS
eScholarship@UMMS
Program in Bioinformatics and Integrative
Biology Publications and Presentations
Program in Bioinformatics and Integrative
Biology
2013-01-01
Factorbook.org: a Wiki-based database for transcription
Factorbook.org: a Wiki-based database for transcription
factor-binding data generated by the ENCODE consortium
binding data generated by the ENCODE consortium
Jie Wang
University of Massachusetts Medical School Et al.
Let us know how access to this document benefits you.
Follow this and additional works at: https://escholarship.umassmed.edu/bioinformatics_pubsPart of the Biochemistry, Biophysics, and Structural Biology Commons, Bioinformatics Commons, Computational Biology Commons, and the Systems Biology Commons
Repository Citation
Repository Citation
Wang J, Zhuang J, Iyer S, Lin X, Greven MC, Kim B, Moore J, Pierce BG, Dong X, Virgil D, Birney E, Hung J, Weng Z. (2013). Factorbook.org: a Wiki-based database for transcription factor-binding data generated by the ENCODE consortium. Program in Bioinformatics and Integrative Biology Publications and
Presentations. https://doi.org/10.1093/nar/gks1221. Retrieved from https://escholarship.umassmed.edu/bioinformatics_pubs/4
This material is brought to you by eScholarship@UMMS. It has been accepted for inclusion in Program in Bioinformatics and Integrative Biology Publications and Presentations by an authorized administrator of eScholarship@UMMS. For more information, please contact [email protected].
Factorbook.org: a Wiki-based database for
transcription factor-binding data generated by
the ENCODE consortium
Jie Wang
1, Jiali Zhuang
1, Sowmya Iyer
2, Xin-Ying Lin
1, Melissa C. Greven
1,
Bong-Hyun Kim
1, Jill Moore
1, Brian G. Pierce
1, Xianjun Dong
1, Daniel Virgil
1,
Ewan Birney
3, Jui-Hung Hung
4and Zhiping Weng
1,*
1
Program in Bioinformatics and Integrative Biology, Department of Biochemistry and Molecular Pharmacology, University of Massachusetts Medical School, Worcester, MA 01605, 2Bioinformatics Program, Boston
University, Boston, MA 02215, USA, 3Vertebrate Genomics Group, European Bioinformatics Institute
(EMBL-EBI), Wellcome Trust Genome Campus, Hinxton, Cambridgeshire CB10 1SD, UK and 4Department of Biological Science & Technology and Institute of Bioinformatics & Systems Biology, National Chiao-Tung University, 75 Bo-Ai Street, Hsin-Chu, 300, Taiwan
Received September 28, 2012; Revised October 30, 2012; Accepted October 31, 2012
ABSTRACT
The Encyclopedia of DNA Elements (ENCODE) con-sortium aims to identify all functional elements in the human genome including transcripts, transcrip-tional regulatory regions, along with their chromatin states and DNA methylation patterns. The ENCODE project generates data utilizing a variety of tech-niques that can enrich for regulatory regions, such as chromatin immunoprecipitation (ChIP), micro-coccal nuclease (MNase) digestion and DNase I di-gestion, followed by deeply sequencing the resulting DNA. As part of the ENCODE project, we have developed a Web-accessible repository ac-cessible at http://factorbook.org. In Wiki format, factorbook is a transcription factor (TF)-centric re-pository of all ENCODE ChIP-seq datasets on TF-binding regions, as well as the rich analysis results of these data. In the first release, factorbook contains 457 ChIP-seq datasets on 119 TFs in a number of human cell lines, the average profiles of histone modifications and nucleosome positioning around the TF-binding regions, sequence motifs enriched in the regions and the distance and orien-tation preferences between motif sites.
INTRODUCTION
Transcription factors (TFs) are regulatory proteins that bind to genomic DNA. Many TFs bind in close proximity
to a gene, thereby activating or repressing the expression of that gene. Mutations or deletions of TFs as well as their binding sites in the genome are responsible for a number of diseases. The UCSC Encyclopedia of DNA Elements
(ENCODE) web portal (http://genome.ucsc.edu/
ENCODE/) is a widely used tool for visualizing raw ENCODE data in specific genomic loci (1,2). However, no tool exists for accessing summarized data centered on TFs, e.g. the average nucleosome occupancy profile around all binding regions of a particular TF in a particu-lar cell line. Such summary data need to be derived from the raw data and cannot be readily displayed using the UCSC browser. To meet this need, we performed exten-sive analysis on the chromatin immunoprecipitation followed by deep sequencing (ChIP-seq) data generated by the ENCODE consortium (3) and made the results available through a web-accessible, TF-centric database called factorbook (http://factorbook.org). Here, we describe the content and user interface of factorbook.
In a ChIP-seq experiment, cells are treated with formal-dehyde which crosslinks chromatin with bound TFs, and the cells are lysed in order to make the chromatin access-ible. The chromatin is then sheared by sonication, result-ing in DNA fragments roughly 300 bp long (about two nucleosomes). An antibody that specifically recognizes a TF is used to pull down the chromatin fragments that are bound to the TF, the crosslinks are reversed and the genomic DNA in the chromatin fragments is deeply sequenced (4,5). Mapping these sequences back to a refer-ence genome then reveals peaks at genomic regions con-taining the most reads. These regions are called ChIP-seq
*To whom correspondence should be addressed. Tel: +1 508 856 8866; Fax: +1 508 856 2392; Email: [email protected] The authors wish it to be known that, in their opinion, the first five authors should be regarded as joint First Authors.
ßThe Author(s) 2012. Published by Oxford University Press.
This is an Open Access article distributed under the terms of the Creative Commons Attribution License (http://creativecommons.org/licenses/by-nc/3.0/), which permits non-commercial reuse, distribution, and reproduction in any medium, provided the original work is properly cited. For commercial re-use, please contact [email protected].
peaks and correspond to the binding regions of the TF; the genes near these regions are likely regulated by the TF. There are1400 TFs in the human genome (6). Data for roughly 119 TFs currently are available at factorbook, most in three ENCODE Tier 1 cell lines (K562, GM12878 and H1 human embryonic stem cells or H1hESC) and two Tier 2 cell lines (HeLa-S3 and HepG2). To present the ChIP-seq data in a comprehensive and easy to access fashion, we performed a series of analyses on the ChIP-seq peaks: (i) we generated the average histone modification profiles around the peaks in the cor-responding cell lines; (ii) we generated the average nucleo-some occupancy profiles around the ChIP-seq peaks in the two Tier 1 cell lines for which nucleosome positioning data are available (GM12878 and K562); (iii) we used the MEME-ChIP tool to discover ab initio sequence motifs in the top 500 peaks and then analyzed the enrichment of these motifs in all peaks; (iv) we identified distance
and orientation preferences of neighboring sites between all pairs of motifs discovered in the same cell line and (v) for the peaks of any specified TF, we generated heatmaps showing histone modifications and the binding profiles of other TFs in the same cell line. We are adding additional analyses performed by the ENCODE analysis working group and plan to update factorbook whenever more ENCODE data are available.
FACTORBOOK MAIN PAGE
The factorbook home page displays an alphabetized matrix of TFs and cell lines (Figure 1). Each number in the matrix represents the number of ChIP-seq experiments performed for that factor in a given cell line. The user can choose to display only the TFs that belong to a specific protein family. Clicking the TF name opens the page on the TF.
Figure 1. The matrix on the factorbook home page. The user can click on a specific TF and go directly to its page, or specify a protein family to display its TF members. Each number in the matrix represents the number of ChIP-seq experiments (and resultant ENCODE datasets) performed for that factor in a given cell line.
A TF PAGE
Each individual factor page contains a number of sections (descriptions below) and a panel on the top right of the page, which provides an image of the three-dimensional protein structure of the TF (when available) and links to outside databases (PDB, HGNC, Gene Card, Entrez, RefSeq, UCSC, UniProt and Wikipedia). The UCSC link points to the Genome Browser at University of California Santa Cruz displaying all raw ENCODE data on this TF.
TF function
This section contains a brief overview of the molecular function of the TF. When known, factorbook provides information about its protein family, consensus-binding sequence, functional-binding partners (e.g. if it is part of a complex which acts as an expressional regulator) and disease phenotypes. The information was taken from the UCSC annotation for these factors, supplemented with information from RefSeq and Gene Card.
ENCODE ChIP-seq datasets
Each TF has a matrix organized by cell line and labora-tory that generated the data. The number displayed rep-resents the number of ChIP-seq experiments performed
for that factor in that cell line. In some of these experi-ments, cells were subjected to treatment (e.g. with dexa-methasone) to detect potential differences in TF binding. The user can toggle to show or hide this matrix, which can be convenient when there are many datasets for a TF (e.g.
the insulator-binding protein CTCF and RNA
Polymerase II). Clicking on the number opens a new page containing a sortable table of available data. The download links allow the user to download the datasets from the UCSC genome browser.
Average profiles of modified histones around the summit of ChIP-Seq peaks
Average histone modification profiles are shown for the [ 2 kb, +2 kb] window around the summits (the position with the most sequence reads) of TF ChIP-seq peaks (Figure 2). These are separated into peaks that are proximal to (within 1 kb of) an annotated transcription start site or TSS (dashed lines) and peaks that are distal to all annotated TSS (solid lines). Only histone modification data from the same cell line as the TF ChIP-seq data are shown. The Broad Institute team in the ENCODE consortium performed the ChIP experi-ments with antibodies specific for various modified histones to generate the histone modification data used in factorbook (7).
Figure 2. Average profiles of modified histones around the summit of ChIP-seq peaks. Profiles are shown for the [ 2 kb, +2 kb] window around the summits of TF ChIP-seq peaks, with proximal peaks shown as dashed lines and distal peaks shown as solid lines. The graphs are designed in an interactive fashion to allow the user to select data for a specific histone modification.
These graphs are designed in an interactive fashion. A user can hover the cursor over a curve to reveal its histone modification identity or hover over a histone modification in the legend to show its curves and gray out other histone modifications in the figures. The user also can click a histone modification in the legend to toggle on/off its curve in all figures, as well as click the ‘Proximal’ or ‘Distal’ button in the legend to show only the average histone modification profiles anchored around ChIP-seq peaks that are proximal or distal to annotated transcripts. Furthermore, the legend remains on the right of the page even when there are many datasets available and the user scrolls down the page.
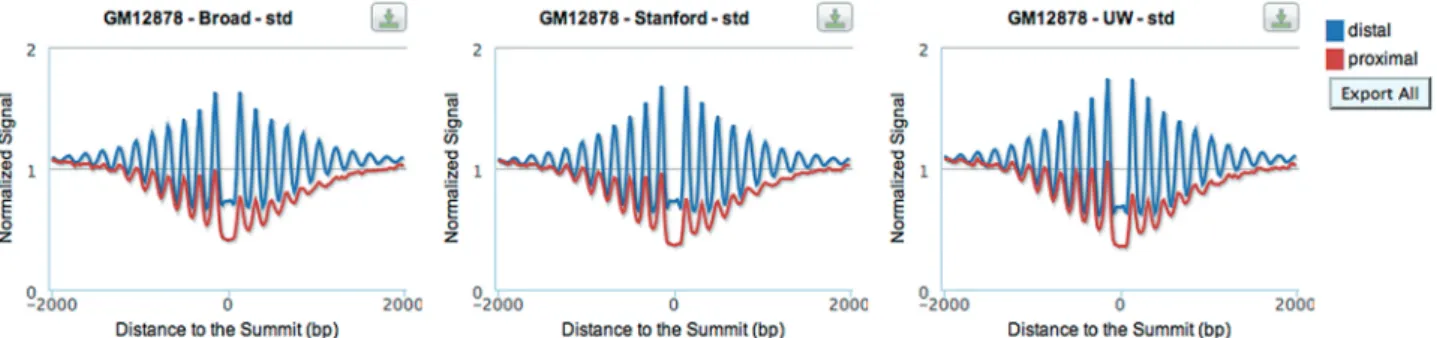
Average profiles of nucleosomes around the summit of ChIP-Seq peaks
This section shows the effect of bound TFs on regional nucleosome positioning (Figure 3). Average nucleosome occupancy profiles are shown for the [ 2 kb, +2 kb] window around the summits of TF ChIP-seq peaks. Red lines represent peaks that are proximal to an annotated transcript (within 1 kb of a TSS) and blue lines show peaks
that are distal to all annotated transcripts (>1 kb of all TSS). As for histone modifications, proximal profiles of nucleosome occupancy are arranged such that the tran-scriptional direction of the nearest transcript is toward the right. The Stanford team generated the nucleosome positioning data in cell lines GM12878 and K562, using MNase digestion of chromatin followed by deep
sequencing of mononucleosomal DNA (8). Three
examples shown in Figure 3 are normalized nucleosome occupancy around the ChIP-seq peaks of CTCF from the GM12878 cell line; the ChIP-seq datasets were generated by three different laboratories. The plots consistently show that CTCF positions nucleosomes more strongly in distal regions (higher signal, blue lines in Figure 3) than in regions proximal to the TSS (lower signal, red lines in Figure 3) and there is a loss of nucleosomes in gene body. More details are explained in our recent pub-lication (3).
Motifs enriched in the top ChIP-seq peaks
We built a computational pipeline that takes advantage of the MEME-ChIP suite of tools to discover the motifs
Figure 4. Motifs enriched in the top 500 ChIP-seq peaks of CTCF. This section displays five motifs (M1–M5), with motif name and sequence logo as well as the number of peaks out of the top 500 ChIP-seq peaks containing a motif site. The user can customize the motifs shown by cell line, laboratory, protocol, treatment and antibody.
Figure 3. Average profiles of nucleosomes around the summit of ChIP-seq peaks. Average nucleosome positioning profiles are shown for the [ 2 kb, +2 kb] window around the summits of TF ChIP-seq peaks. Red lines represent proximal peaks and blue lines show distal peaks.
enriched in the sequences of the top 500 TF ChIP-seq peaks (3). We display five motifs (M1–M5), with motif name (when it is known, otherwise shown as no match) and sequence logo, as well as the number of peaks out of the top 500 peaks containing a motif site. This section allows the user to customize the motifs shown by cell line, laboratory, protocol, treatment and antibody. The five motifs shown in Figure 4 are from the top 500 ChIP-seq peaks of CTCF in GM12878 generated by the Broad Institute. Among the five motifs, M1 and M2 are variants of the canonical CTCF motif and M3 is the ex-tension of the CTCF motif. However, M4 and M5 do not match any known motifs.
We used the FIMO tool (9) to scan thede novoidentified motifs in the entire set of ChIP-seq peaks and the two equal-length regions flanking the peaks as control. A series of graphs report two quantities for each motif on bins of peaks sorted by their ChIP-seq q-values: (left y-axis)
percentage of the peaks that contain a site for the motif and (right y-axis) the distribution of the distances of the motif site to the summit of the peak (the position in a TF ChIP-seq peak that corresponds to the most sequencing reads). For the previous CTCF example (Figure 4), comparison between the peak and the regions flanking the peak shows that M4 is not more enriched in peaks than in flanking regions. Thus, M4 does not appear to be a valid motif, nor does M5 (data not shown). More details are ex-plained in our recent publication (3).
Comparison of the binding profile of a TF to those of other TFs and histone modifications
This section shows a detailed view of the relationship between a pivoting TF and other TFs or histone marks. Figure 5A shows a heatmap for which the pivoting TF is c-Fos in the HUVEC cell line. The first column represents
Figure 5. Heatmaps of TF-binding profiles and histone modification profiles around c-Fos peaks. Binding strengths of TFs and enrichment of histone marks are represented in a normalized scale. Rows indicate the ChIP-seq peaks of the pivoting TF (in this case c-Fos) and are inversely ordered by the ChIP signals of c-Fos peaks. TF-binding profiles are shown over a span of 2 kb while histone marks are shown over a span of 10 kb. Heatmaps for each TF are specific to the dataset and cell line of the pivoting TF.
the binding profile of c-Fos in a [ 1 kb, +1 kb] window centered on the peak summit, with each row being a peak and the rows sorted inversely by ChIP signal. Other columns represent the binding profiles of other TFs in the same regions as in the first column. Figure 5B is the same as Figure 5A except that the other columns represent the profiles of histone modifications in a wider window ([ 5 kb, +5 kb] centered on the peak summit). Analyses are limited to TFs and histone marks from the same cell line as the pivoting TF.
FUTURE DEVELOPMENT
Our future plans for factorbook include the addition of more TFs, as well as more data types, including RNA-seq and DNase I. Further analysis results from the ENCODE Data Analysis Center (motif analysis from the Kellis Lab and the CAGT plots from Kundajeet al. (8), cross-species sequence conservation and sequence variation within the human population, and allele-specific sites) are forth-coming as well.
ACKNOWLEDGEMENTS
We thank all members of the ENCODE consortium for the rich data and stimulating discussions. We thank Mike Pazin at NHGRI, NIH for many insightful comments on the factorbook Web site.
FUNDING
Funding for open access charge: National Institutes of Health [U01 HG004695 and U41 HG007000].
Conflict of interest statement. None declared.
REFERENCES
1. ENCODE Project Consortium; Myers,R.M., Stamatoyannopoulos,J., Snyder,M., Dunham,I., Hardison,R.C., Bernstein,B.E.,
Gingeras,T.R., Kent,W.J., Birney,E., Wold,B.et al. (2011) A user’s guide to the encyclopedia of DNA elements (ENCODE).PLoS Biol.,
9, e1001046.
2. ENCODE Project Consortium; Dunham,I., Kundaje,A., Aldred,S.F., Collins,P.J., Davis,C.A., Doyle,F., Epstein,C.B., Frietze,S., Harrow,J., Kaul,R.et al. (2012) An integrated encyclopedia of DNA elements in the human genome.Nature,
489, 57–74.
3. Wang,J., Zhuang,J., Iyer,S., Lin,X., Whitfield,T.W., Greven,M.C., Pierce,B.G., Dong,X., Kundaje,A., Cheng,Y.et al. (2012) Sequence features and chromatin structure around the genomic regions bound by 119 human transcription factors.Genome Res.,
22, 1798–1812.
4. Mardis,E.R. and Mardis,E.R. (2007) ChIP-seq: welcome to the new frontier.Nat. Methods,4, 613–614.
5. Robertson,G., Hirst,M., Bainbridge,M., Bilenky,M., Zhao,Y., Zeng,T., Euskirchen,G., Bernier,B., Varhol,R., Delaney,A.et al. (2007) Genome-wide profiles of STAT1 DNA association using chromatin immunoprecipitation and massively parallel sequencing.
Nat. Methods,4, 651–657.
6. Vaquerizas,J.M., Kummerfeld,S.K., Teichmann,S.A. and Luscombe,N.M. (2009) A census of human transcription factors: function, expression and evolution.Nat. Rev. Genet.,10, 252–263.
7. Ernst,J., Kheradpour,P., Mikkelsen,T.S., Shoresh,N., Ward,L.D., Epstein,C.B., Zhang,X., Wang,L., Issner,R., Coyne,M.et al. (2011) Mapping and analysis of chromatin state dynamics in nine human cell types.Nature,473, 43–49.
8. Kundaje,A., Kyriazopoulou-Panagiotopoulou,S., Libbrecht,M., Smith,C.L., Raha,D., Winters,E.E., Johnson,S.M., Snyder,M., Batzoglou,S. and Sidow,A. (2012) Ubiquitous heterogeneity and asymmetry of the chromatin environment at regulatory elements.
Genome Res.,22, 1735–1747.
9. Grant,C.E., Bailey,T.L. and Noble,W.S. (2011) FIMO: scanning for occurrences of a given motif.Bioinformatics,27, 1017–1018.

![Figure 2. Average profiles of modified histones around the summit of ChIP-seq peaks. Profiles are shown for the [ 2 kb, +2 kb] window around the summits of TF ChIP-seq peaks, with proximal peaks shown as dashed lines and distal peaks shown as solid lines](https://thumb-us.123doks.com/thumbv2/123dok_us/382560.2542355/4.918.106.830.582.1054/figure-average-profiles-modified-histones-profiles-summits-proximal.webp)