Using Accounting and Financing
to Recover the Value of
Natural Capital
by
Raul Martinez-Oviedo
First supervisor: Prof. Francesca Medda
Second supervisor: Prof. Benjamin Heydecker
A thesis submitted in partial fulfillment for the
degree of Doctor of Philosophy
in the
Faculty of Engineering
Department of Civil, Environmental and Geomatic Engineering
Declaration of Authorship
I, Raul Martinez-Oviedo, declare that this thesis titled, “Using Accounting and Financing to Recover the Value of Natural Capital” and the work presented in it are my own. I confirm that:
This work was done wholly or mainly while in candidature for a research
degree at this University.
Where any part of this thesis has previously been submitted for a degree or
any other qualification at this University or any other institution, this has been clearly stated.
Where I have consulted the published work of others, this is always clearly
attributed.
Where I have quoted from the work of others, the source is always given.
With the exception of such quotations, this thesis is entirely my own work.
I have acknowledged all main sources of help.
Where the thesis is based on work done by myself jointly with others, I have
made clear exactly what was done by others and what I have contributed myself.
Signed:
Date:
Abstract
The value of natural capital in countries around the world, including the UK, has been continuously decreasing due to the degradation of natural resources. The lack of accounting and financial mechanisms dedicated to measure and recover the value of natural capital, combined with low investment allocations from private investors, have been a determinant factor contributing to this decline. Given this consideration, the present work defines three objectives in relation to natural capi-tal accounting and finance. First, to investigate the use of natural capicapi-tal accounts to study changes in natural capital value and identify the major factors impacting the risk of declining natural capital and wealth using the case study of the UK. Second, to analyse the performance of investments in natural capital assets. Fi-nally, to examine the use of Sovereign Wealth Funds as a financial mechanism to dedicate major investments in natural capital. In relation to the first objective, a stochastic model for risk analysis is developed to estimate changes in UKs wealth using data on produced, human, and natural capital asset values reported by UK authorities between 1992 and 2012. Results show that natural capital losses in the UK have been mainly driven by a decrease in value of non-renewable natural capital, together with variations in the value of ecosystem services. Nevertheless, as non-renewable natural capital reach depletion, focus shall be given over coming years to recover renewable natural capital. As part of the second objective, the present work evaluates the performance of investments in real and non-real natu-ral assets and compare it with those of traditional asset classes using time series analysis of historical returns. The obtained results indicate that, when investing in natural capital, investors should focus on real natural assets as their finan-cial benefits are higher than those from equities, bonds, real estate or even some infrastructure assets. Regarding the final objective, this work models the invest-ment portfolio of an oil-based SWF using Norways Pension Fund Global as a case study and employs out-of-sample simulation technique to estimate global efficient portfolios while considering their relationship with oil prices. In this regard, the final results demonstrate that SWFs are able to challenge their current allocation range in natural assets (2-5%) to a higher range (15-20%) while still benefiting from those investments. The overall conclusion from this research suggests that combining the importance of effective natural capital accounts, the financial ben-efits of natural capital investments, and the role of financial mechanisms such as SWFs is essential to increase the value of natural capital.
• Martinez-Oviedo, R. and Medda, F. (2017) UK’s Natural and Wealth
ac-counting. Working Paper.
• Martinez-Oviedo, R. and Medda, F. (2017) Real natural assets: The real
green investment alternative. Accepted in the Journal of Alternative
Invest-ments.
• Martinez-Oviedo, R. and Medda, F. (2017) Assessing the effects of adding
timberland and farmland into resource-based Sovereign Wealth Fund
port-folios. Journal of Economics and Business, 91, pp. 24-40.
CONFERENCE PUBLICATIONS
• Martinez-Oviedo, R. and Medda, F. (2017) Real Natural assets: The real
green investment alternative. 16th Finance, Risk and Accounting Perspec-tives Conference. Acrn Oxford, Cambridge, UK.
• Martinez-Oviedo, R. and Medda, F. (2015) Assessing the impact of natural
capital on the risk of depleting UK wealth. Regional Studies Association Winter Conference 2015, November, London, UK.
• Martinez-Oviedo, R. and Medda, F. (2014) Building the green economy with
Sovereign Wealth Funds. Regional Studies Association Winter Conference 2014, November, London, UK.
Acknowledgements
I would like to express my sincere gratitude to my supervisors, Professors Francesca Medda and Benjamin Heydecker, for their continuous support and guidance through-out the whole process of the PhD project. They have always been fantastic men-tors and I enjoyed very much working with them and learning from them all these years.
I would also like to extend my gratitude to Dr. Thomas Schroeder, external
visitor and friend of QASER Lab, for his continuous feedback and suggestions that contributed in every occasion to improve my work.
I would like to give special thanks to the Liveable Cities team for providing me with the opportunity to take part of this project. It has been a great experience to share with the team during all this time and to contribute to the aim of delivering more liveable spaces for the future.
Special gratitude goes also for all my friends and colleagues at QASER Lab, in-cluding Alessandra, Athena, Simone, Francesco, Minette, Luca, Hiral, Ioannis, Candace, Mira, Song, Gabriela and Susan. It has been a great pleasure to have met you all and shared with you during four fantastic years.
In addition, I would like to acknowledge the Engineering and Physical Science Research Council (EPSRC) for funding this research work.
Finally, a very special thank to my parents, my brother Fernando and Nana OTA for your unconditional support always.
Raul
Declaration of Authorship i
Acknowledgements v
List of Figures ix
List of Tables xii
Abbreviations xv
Symbols xvi
1 Introduction 1
1.1 Background . . . 1
1.2 Objectives and research questions . . . 6
1.3 Thesis contribution . . . 8
1.4 Thesis structure . . . 10
2 An overview of Natural Capital 13 2.1 Definition . . . 13
2.2 Natural Capital and the Capital Approach . . . 18
2.3 Natural Capital Accounting . . . 22
2.4 Natural Capital and Commodity Prices . . . 24
2.5 Natural Capital and Macroeconomic . . . 30
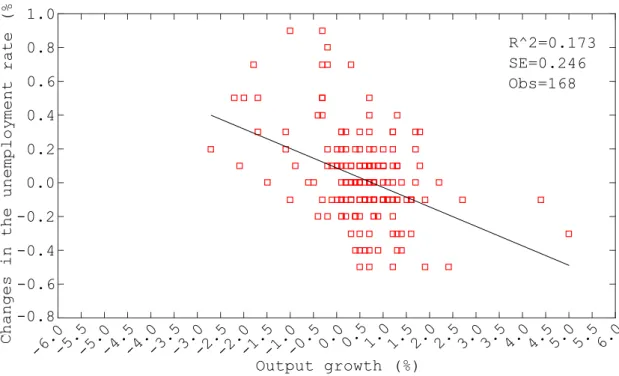
2.5.1 Changes in unemployment and output growth (Okun’s Law) 32 2.5.2 Employment rate and economic growth . . . 33
2.5.3 Unemployment and real wages . . . 35
2.6 Natural Capital Investment Approaches. . . 36 vi
Contents
2.7 Natural Capital in the UK . . . 39
3 Theoretical framework 43 3.1 Stochastic processes for commodity pricing . . . 43
3.1.1 Geometric Brownian Motion . . . 45
3.1.2 Mean-Reversion . . . 47
3.2 Global Sensitivity Analysis . . . 49
3.3 Mean-Variance Portfolio Optimization . . . 55
3.4 Asset Allocation for Oil-sourced Sovereign Wealth Funds . . . 57
4 Natural capital and wealth accounting 60 4.1 Related work on natural capital and wealth accounting . . . 63
4.2 Methodology . . . 66
4.2.1 Stochastic model for wealth and risk analysis. . . 66
4.2.2 Data sources. . . 72
4.3 Simulation results . . . 73
4.3.1 UK wealth composition between 2003 and 2013 . . . 73
4.3.2 Scenario evaluation 2015-2020 . . . 83
4.3.3 Sensitivity analysis . . . 90
4.4 Discussion . . . 94
5 Performance of investments in natural assets 99 5.1 Literature review on green investments . . . 101
5.2 Data description . . . 103
5.2.1 Non-real green assets . . . 104
5.2.2 Real green assets . . . 107
5.2.3 Traditional assets: equities, bonds, real estate, and infras-tructure . . . 108
5.3 Investment performance . . . 109
5.3.1 Performance of non-real green assets . . . 109
5.3.2 Performance of real green assets . . . 125
5.4 Discussion . . . 137
6 Sovereign Wealth Funds and Natural Capital Investments 140 6.1 Literature review on Sovereign Wealth Funds. . . 144
6.2 Case study: Norway’s Government Pension Fund Global . . . 147
6.3 Research methodology . . . 150
6.3.1 Analytical model . . . 150
6.3.2 Data and portfolio construction . . . 154
6.3.3 Portfolio analysis . . . 156
6.4 Results . . . 157
6.4.1 Analysis of asset returns . . . 157
6.4.2 Analysis of the SWF performance . . . 160
6.4.3 Oil exposure analysis . . . 165
7 Conclusions 172
7.1 Summary and implications . . . 172
7.2 Research limitations . . . 182
7.3 Future research . . . 183
A Globally efficient portfolios 188
B List of assumptions 191
C Empirical relations defined in the wealth model 197
D Data for UK wealth Estimation 205
E Unsmoothing approach 209
List of Figures
1.1 Natural capital values reported by the Inclusive Wealth Report in
trillions of constant 2005 US$ (UNEP&UNU-IHDP, 2014). . . 2
1.2 Schematic representation of the thesis structure . . . 11
2.1 Natural capital categories . . . 14
2.2 The role of ecosystem services for human wellbeing . . . 16
2.3 The three capital model of wealth creation . . . 21
2.4 Historical prices of crude oil (in US$/barrel) . . . 26
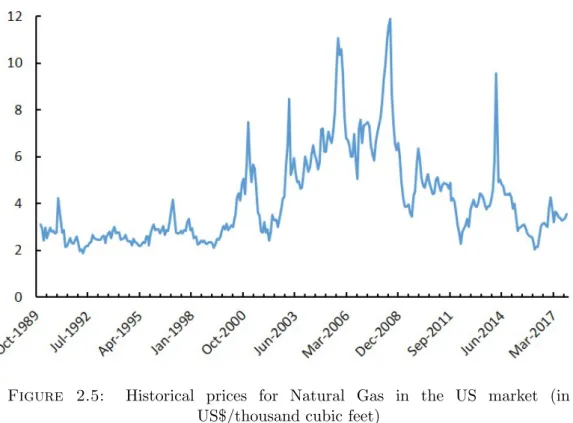
2.5 Historical prices for Natural Gas in the US market (in US$/thousand cubic feet) . . . 27
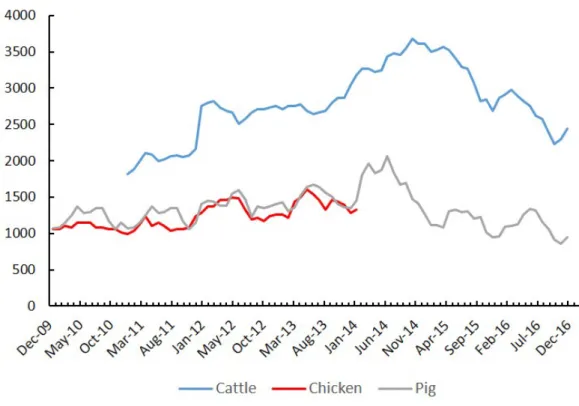
2.6 Historical prices for cereal products in the US market (in US$/tonne) 28 2.7 Historical prices for live meat in the US market (in US$/tonne) . . 29
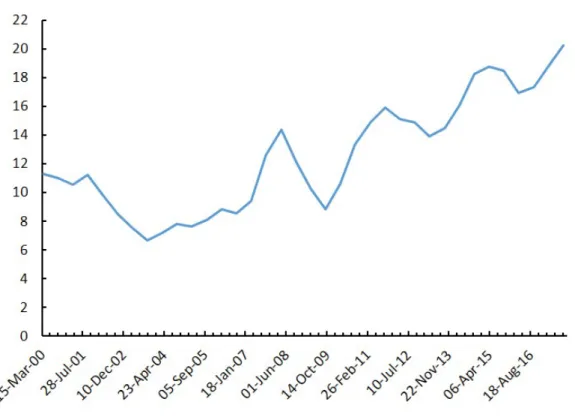
2.8 Historical prices of conifer wood for the GB market (in 2016£/m3) 31 2.9 Quarter changes in unemployment rate and GDP growth in the UK, June 1971 - March 2013 . . . 33
2.10 UK natural capital monetary estimates reported by national au-thorities between 2009 and 2014, in millions of constant 2014 £. Source ONS (2016c). . . 40
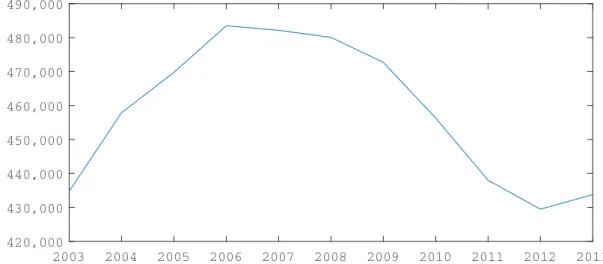
4.1 UK per capita wealth trajectory between 2003 and 2013 (in £, 2014) 75 4.2 UK human capital per capita values between 2003 and 2013 (in £, 2014) . . . 77
4.3 UK produced capital per capita values between 2003 and 2013 (in £, 2014) . . . 77
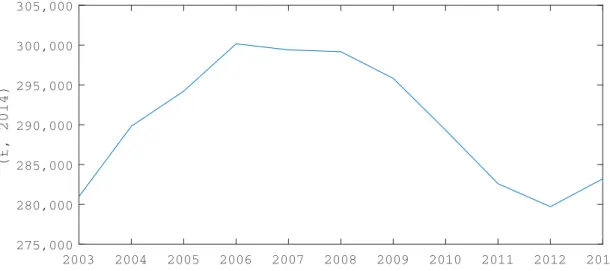
4.4 UK’s non-renewable natural capital per capita value between 2003 and 2013 (in£, 2014). . . 78
4.5 UK’s renewable natural capital per capita value between 2003 and 2013 (in £, 2014) . . . 78
4.6 UK’s ecosystem services per capita values between 2003 and 2013 (in £, 2014) . . . 79
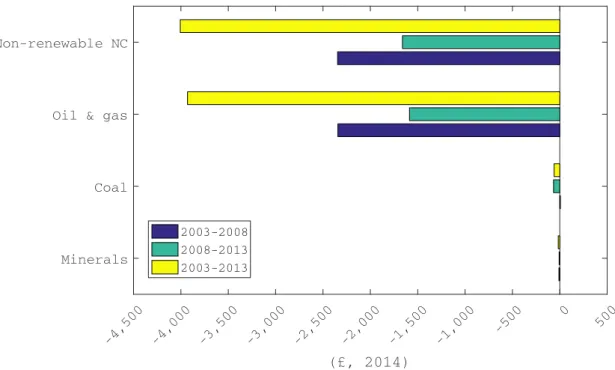
4.7 Changes in non-renewable per capita natural capital value, 2003-2013 (£, 2014). . . 80
4.8 Changes in renewable per capita natural capital value, 2003-2013 (£, 2014) . . . 81
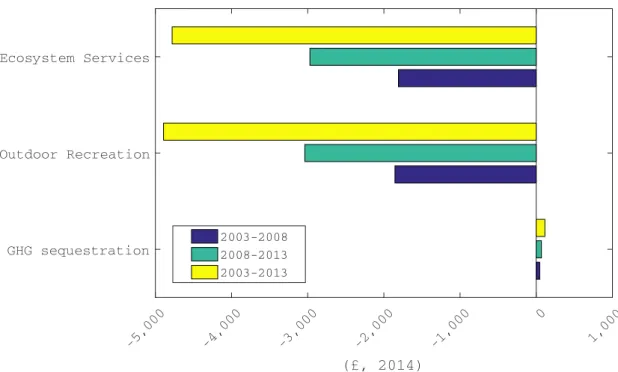
4.9 Changes in per capita ecosystem services natural capital value, 2003-2013 (£, 2014). . . 82
4.10 Output variables as a function of the number of Monte Carlo sim-ulation runs. . . 84
4.11 Uncertainty analysis of changes in per capita wealth and per capital natural capital for the tested scenarios between 2015 and 2020. . . . 88
4.12 Estimated trajectories of per capita wealth and per capita natural capital for the period 2015-2020 . . . 91
5.1 Relationship between indexes and natural capital categories . . . . 106
5.2 Cumulative investment performance of an initial £1 investment, 2008-2016) . . . 111
5.3 Monthly changes in US CPI, 2008-2016. . . 115
5.4 Cumulative investment performance for a portfolio including and excluding non-real green assets, 2010-2016 . . . 118
5.5 Monthly overall returns of an investment portfolio with and without non-real greet assets, 2010-2016 . . . 119
5.6 Optimal weight allocations in a portfolio containing equities, gov-ernment bonds, infrastructure, real estate, and non-real green as-sets, 2010-2016. . . 120
5.7 Average monthly return and volatility for portfolios combining non-real green assets with traditional assets, 2010-2016. . . 121
5.8 Monthly changes in the liquidity index in the aggregate stock mar-kets of NYSE and NASDAQ, 2000-2016. . . 124
5.9 Cumulative investment performance of an initial £investment in real green assets, June 2000 - March 2016. . . 127
5.10 Cumulative investment performance for a portfolio including and excluding real green assets, 2004-2016 . . . 133
5.11 Quarterly returns of portfolio . . . 134
5.12 Optimal weight allocations in a portfolio containing equities, bonds, infrastructure, real estate, and real green assets, 2004-2016 . . . 134
5.13 Average quarterly return and volatility for portfolios combining real green assets with traditional assets, 2004-2016 . . . 135
6.1 Sovereign Wealth Funds to preserve the value of natural capital . . 141
6.2 Returns and market value evolution for the baseline portfolio (Eq=60%, Fi=35%, Re=5%) and the GPFG, Q1. 2007 - Q1. 2016 . . . 161
6.3 Returns and market value evolution for portfolios 1, 4, 13 and 16, Q1. 2007 - Q1. 2016 . . . 164
6.4 Globally efficient allocations for portfolio 4 (Eq=45%, Fi=35%, Re = 5%, Na=15%) . . . 165
List of Figures
6.6 Normalized cumulative capital transferred to the fund and portfolio growth . . . 167
1.1 Natural capital value change per country, 1990-2010. Source:
UNEP&UNU-IHDP (2014). . . 3
4.1 UK per capita wealth between 2003 and 2013 (in£, 2014) . . . 75
4.2 Correlation matrix for UK per capita wealth, produced capital, hu-man capital, and GDP value between 2003 and 2013 . . . 76
4.3 Correlation matrix for UK natural capital components and GDP per capita between 2003 and 2013 . . . 81
4.4 Model parameters and scenarios for 2015-2020. . . 85
4.5 Statistics for changes in per capita wealth and natural capital and the risk of declining their value for the period 2015-2020. . . 89
4.6 First-order and total-effect sensitivity indices obtained for the risk of declining per capita wealth and natural capital . . . 92
5.1 Performance of historical returns for non-real assets, December 2008 - November 2016 . . . 109
5.2 Correlation of monthly returns, 2008-2016 . . . 112
5.3 Alpha estimates for non-real green assets, 2008-2016 . . . 114
5.4 Beta estimates for non-real green assets, 2008-2016 . . . 114
5.5 Investment performance of non-real greet assets and changes in CPI 117 5.6 Performance of a portfolio with non-real green assets . . . 119
5.7 Fifty largest companies traded in the NYSE and NASDAQ accord-ing to their market capitalization . . . 123
5.8 Aggregate stock market liquidity and non-real green assets, 2008-2016.125 5.9 Performance of historical quarterly returns for real green assets, June 2000 - March 2016 . . . 126
5.10 Correlation of quarterly returns, June 2000- March 2016 . . . 128
5.11 Alpha estimates for real green assets, 2000-2016 . . . 129
5.12 Beta estimates for real green assets, 2000-2016 . . . 129
5.13 Investment performance of real green assets and changes in CPI . . 131
5.14 Statistics on the quarterly returns of a portfolio with real green assets133 xii
List of Tables
5.15 Aggregate stock market liquidity and real green assets, 2000-2016 . 136
6.1 Norway’s annual petroleum production, petroleum revenues and capital transferred to the fund Source: Norwegian Petroleum Di-rectorate (NPD, 2015) . . . 149
6.2 Mandates adopted by the Government Pension Fund Global in Jan-uary 2016. Source: NorgesBank (2016) . . . 151
6.3 Investment universe for the Sovereign Wealth Fund portfolio model 155
6.4 Strategic asset allocation of the evaluated portfolios . . . 158
6.5 Historical performance of quarterly returns for assets in our invest-ment universe, Q1. 2007 - Q1. 2016 . . . 159
6.6 Statistics on the performance of the tested portfolios ranked accord-ing to the risk to overall return ratio . . . 162
C.1 Regression coefficients for the relationship changes in employment rate and GDP growth, expressed in Equation (C.1) . . . 198
C.2 Regression coefficients for the relationship annual wages and unem-ployment, expressed in Equation (C.2) . . . 199
C.3 Regression coefficients for the relationship between UK unemploy-ment rate and GDP growth, expressed in Equation (C.3) Source: Olusegun (2015). . . 200
C.4 Regression coefficients for the relationship between UK mortality rate by age and time, expressed in Equation (C.4) . . . 200
C.5 Regression coefficients for the relationship hourly wages and unem-ployment, expressed in Equation (C.5) . . . 201
C.6 Regression coefficients for GHG sequestration per land area of forest-land, croplands, and others, expressed in Equation (C.6) . . . 202
C.7 Regression coefficients for GHG sequestration per land area of grass-land, expressed in Equation (C.7) . . . 203
C.8 Regression coefficients for GHG sequestration per land area of wet-lands, expressed in Equation (C.8) . . . 204
D.1 Current value of UK produced capital assets (£million), 1999-2013. Source: UK National Balance Sheet by Assets, Office for National Statistics, TheBlueBook (2014) . . . 205
D.2 UK minerals export value (£million), 1999-2012. Source: British Geological Survey (BGS), UK Mineral Yearbook 2013, (BGS, 2013) 205
D.3 UK minerals export volume (Tonnes ’000), 1999-2012. Source: British Geological Survey (BGS), UK Mineral Yearbook 2013, (BGS, 2013) . . . 205
D.4 Data on UK oil & gas reserves, level of production, prices, capital expenditure associated to oil & gas activities, 1999-2014. Source: UK OilandGasAuthority (2016) . . . 206
D.5 Output (in current £million) for the UK agriculture, fishery, and water supply industries, 1999-2012. Source: UK National Accounts, Supply and Use tables, TheBlueBook (2014). . . 206
D.6 UK stumpage price of coniferous standing wood, forest stocked area, and forest new planing, 1999-2014. Source: UK Forestry Commis-sion and National Forest Inventory (NFI), Timber statistics. . . 206
D.7 UK data on the number of visits to recreational sites, duration of visits, and average expenditure per visit, 2009-2013. Source: UK MENE (2014).. . . 206
D.8 UK annual greenhouse gas emissions (tCO2e/year) for the land cat-egories forestland,croplands, grassland, wetlands, settlements and others, 1990-2012. Source: Centre for Ecology & Hydrology, DEFRA.207
D.9 UK land area (in Kha) for the land categories forestland,croplands, grassland, wetlands, settlements and others, 1990-2013. Source: Centre for Ecology & Hydrology, DEFRA. . . 208
Abbreviations
AIC Akaike Information Criterion
CBI ClimateBond Initiative
CPI Consumer Price Index
DECC DepartmentEnergy Climate Change
DEFRA Department for Environment Food & Rural Affairs
ET Ecological Taxes
GBM Geometric BrownianMotion
GDP Gross DomesticProduct
GHG Green House Gases
GPFG Government PensionFund Global
GSA Global Sensitivity Annalysis
LHS Latin Hypercube Sampling
LULUCF Land Use,Land Use Change and Forestry
MENE Monitor of Engagement with theNatural Environment
MVO Mean Variance Optimization
MPT Modern Portfolio Theory
MR Mean Reverting
PES Payment for Ecosystem Services
PIM Perpetual Inventory Method
SAA Strategic Asset Allocation
SWF Sovereign Wealth Fund
Symbol Name Unit
Chapter 4
Wt Total wealth at time t £mn
CtP Produced capital at time t £mn
CH
t Human capital at time t £mn
CtN Natural capital at time t £mn
AP Set of produced capital assets
AN Set of natural capital assets
Ia
t Investment in capital asseta at timet, ∀a∈AP £mn
γta Depreciation rate for asset a at time t, ∀a∈AP
Yg,d,t Lifetime labour income £
Ng,d,t Number of employed individuals
Eg,d,t Employment rate
Bg,d,t Annual labour income £
Πg,d,t Probability of upgrading educational attainment level
hg,t Mortality rate for age groupg at time t
κ Productivity growth rate
ρ Discount rate
et Changes in employment rate at timet
Symbols
Dt GDP growth at timet
Ut Unemployment rate at timet
Ka
t Resource rent for capital asset a at timet, ∀a∈AN £mn
χa Life span of capital asset a, ∀a ∈AN Years
Pa
t Market price for capital asseta at time t, ∀a∈AN £
δat resource rent ratio at timet for asseta,∀a ∈AN
Sa
t Production level of asset a at timet, ∀a∈AN
Pto Crude oil market price at time t £/barrel
Ptg Gas market price at time t p/therm
Sto Oil production at time t barrels
Stg Gas production at time t bn therms
qot Oil & gas operating cost £mn
qd
t Oil & gas decommissioning cost £mn
qut Oil & gas user cost of produced assets £mn
θa
t Industrial output for asset a at time t, ∀a∈AN £mn
ωta Intermediate consumption for asset a at timet,∀a ∈AN £mn
νa
t Compensation of employees for asset a, ∀a∈AN £mn
ηat Difference between taxes and subsidies for asset a, ∀a∈AN £mn
ζa
t Fixed capital consumption for asset a, ∀a∈AN £mn
φat Return to produced assets for asset a, ∀a∈AN £mn
LT
t Timberland stocked area at time t ha
li,tT Stock area of timberland associated to age category i at timet ha
Pw
t Stumpage price of wood at time t £/m3
ϕ Volume of timber per area at harvesting age m3 / ha
Mt Transport fuel cost at time t £
Zt Average hourly wage at time t £
Ft Average duration of a visit to recreational sites at time t h
vt Annual number of visits to recreational sites at time t
L UK total land area ha
Λjt Net GHG emissions for land category j at time t tCO2e
Ps
Xt UK total population at time t
RW Risk of declining per capita wealth
RN Risk of declining per capita natural capital
Chapter 5
θk,t2 Liquidity index for company k on a month t
rk,d,t Return on the stock for company k on day d on a month t
rxsk,d,t Excess return on the stock for company k on dayd on a month t
rmkt
k,d,t Market return on the stock for company k on day d on a month t
volmktk,d,t Volume of stocks traded for companyk on dayd on a month t US$bn
Chapter 6
vt Fund’s market value at time t US$bn
It Cash inflows to the fund at time t US$bn
Ct Fund’s management cost at timet US$bn
γ Percentage of oil revenues allocated to the fund
et Crude oil exports at time t barrels
pt Crude oil price at timet US$/barrel
reqt Composite return for equities at time t
rret Composite return for real estate at time t
rna
t Composite return for natural assets at time t
Neq Set of equity investments
Nre Set of real estate investments
Nf i Set of fixed income investments
Nna Set of natural asset investments
αeq Percentage of assets allocated into equities
αre Percentage of assets allocated into real estate
αf i Percentage of assets allocated into fixed income
αna Percentage of assets allocated into natural assets
weqt Set of weights allocated to equity assets
wre
Symbols
wf it Set of weights allocated to fixed income assets
wna
t Set of weights allocated to natural capital assets
weqG,t Global efficient weights allocated to equity assets
wreG,t Global efficient weights allocated to real estate assets
wf iG,t Global efficient weights allocated to fixed income assets
wnaG,t Global efficient weights allocated to natural capital assets
zeqt Set of returns for equity assets at time t
zret Set of returns for real estate assets at time t
zf it Set of returns for fixed income assets at time t
1
Introduction
1.1
Background
T
he value of natural capital in countries around the world has beencon-sistently declining over the past decades. In the UK, for instance, the Office for National Statistics’s (ONS) initial estimates suggest that
nat-ural capital losses in this country were as high as£183 billion (in constant 2014£s)
between 2009 and 2014, indicating a drop of 32.3% in only five years (ONS,2016c).
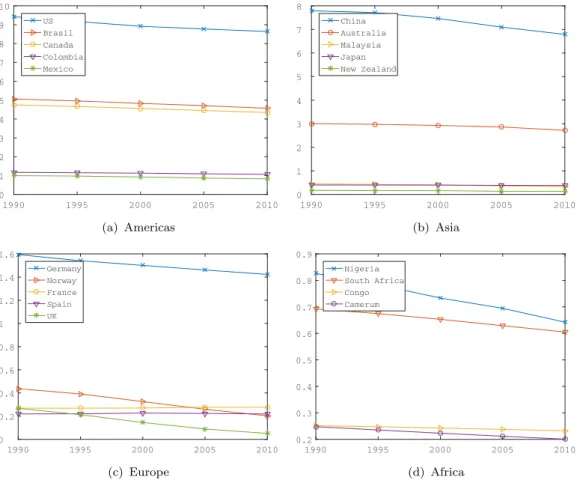
Similar trends are also found in many other countries. Figure1.1shows the trends
of natural capital value between 1990 and 2010 in 19 different countries across the Americas, Europe, Asia and Africa, using the most recent estimations provided by the UN University International Human Dimension Programme (UNU-IHDP) and the UN Environmental Programme (UNEP) in the Inclusive Wealth Report (UNEP&UNU-IHDP,2014). The information from the figure is also given in Table
1.1, which presents the changes in natural capital net value per country and their
corresponding percentages. From the values shown in the figure and the table, we can conclude that, with the exception of France, the value of natural capital in the rest of the countries is on downward trajectory. Moreover, when we examine the Inclusive Wealth Report data in detail, we can confirm that this situation is actually shared by the vast majority of countries worldwide.
Many scholars, including Rands et al. (2010);Hails and Ormerod (2013); Barbier
(2014b) and Mace et al. (2015), agree that the generalised loss of natural capital 1
1990 1995 2000 2005 2010 0 1 2 3 4 5 6 7 8 9 10 US Brasil Canada Colombia Mexico (a) Americas 1990 1995 2000 2005 2010 0 1 2 3 4 5 6 7 8 China Australia Malaysia Japan New Zealand (b) Asia 1990 1995 2000 2005 2010 0 0.2 0.4 0.6 0.8 1 1.2 1.4 1.6 Germany Norway France Spain UK (c) Europe 1990 1995 2000 2005 2010 0.2 0.3 0.4 0.5 0.6 0.7 0.8 0.9 Nigeria South Africa Congo Camerum (d) Africa
Figure 1.1: Natural capital values reported by the Inclusive Wealth Report
in trillions of constant 2005 US$ (UNEP&UNU-IHDP,2014).
value is mainly the result of human-induced factors such as overexploitation of natural resources, soil erosion, water pollution, loss of biodiversity, and increasing
population. These factor are also recognized by Benwell et al. (2014), who in
addition point to the inadequate consideration for nature within decision-making as one of the most important reasons for nature’s decline. It has become widely accepted that the lack of accounting and financial mechanisms dedicated to the measurement and recovery of the value of natural capital has contributed to the
degradation of nature (Smith et al.,2017;MEA,2005). Rapacioli et al.(2014), for
instance, suggest that because of the absent of proper accounts, natural capital have been largely hidden from the corporative narrative, ignored by most investors, and excluded from government agendas, resulting in declining trends of natural
capital reserves. Moreover, Guerry et al. (2015) argue that the value of natural
capital is not always clear to decision makers or the public, limiting the adoption of tangible changes in the operation of business and governments. This argument
1.1. Background 3
Table 1.1: Natural capital value change per country, 1990-2010. Source:
UNEP&UNU-IHDP(2014).
Region Country Value change % of change
(in million 2005 US$)
US -784,631 -8.3% Canada -405,394 -8.5% Americas Mexico -172,269 -17.3% Brasil -493,630 -9.8% Colombia -103,471 -8.8% Germany -170,403 -10.7% Spain -90 -0.0% Europe France +8,452 +3.1% UK -216,281 -81.0% Norway -234,100 -53.6% Nigeria -184,234 -22.3% Africa Congo -18,759 -7.5% Cameroon -47,153 -19.0% South Africa -87,100 -12.6% China -1,003,511 -12.9% Japan -20,769 -5.2%
Asia & Oceania Malasya -113,155 -25.4%
Australia -288,567 -9.6%
NZ -38,652 -22.5%
is also supported by Zhang et al. (2010) and Jones (2010), who report that in
the absence of robust natural capital accounting systems and support investment mechanisms, the valuation of nature stays outside the realm of economic activity and decision-making, and also prevents private enterprise and public authorities from developing strategies to reverse the declining trends witnessed today.
Therefore, as stressed by Helm (2015), if the value of natural capital is to be
re-covered, actions must be taken to develop and implement natural capital accounts that provide information on the condition of natural resources. In this regards,
Bateman et al. (2015) show an example of how monetary valuation of natural assets and ecosystem services can be helpful to this purpose. Moreover, natu-ral capital accounts are an important additional tool for informing on sustainable
development (WAVES,2014). Such accounts allow to identify areas of natural
TheTEEB (2010) recognizes that accounting for natural capital provides a mean-ingful approach to treat ecosystem impacts as externalities and put sustainability into practice. In addition to natural capital accounts, novel financial mechanisms able to dedicate significant investments in natural capital assets should be also
introduced in order to maintain and recover the value of natural capital (NCC,
2014b). Recovering natural capital value and reversing decreasing trajectories are essential to national and regional authorities in their aim to achieve sustainable
development goals (Dasgupta, 2010), they are important for the society to
se-cure levels of well-being (Dasgupta,2004), and they are integral to the long-term
decision-making strategies of businesses (NCC, 2016).
Many international organisations, national governments, private sector entities, and academics have nevertheless focused strongly in recent years on creating nat-ural capital accounts and furthering the development of financial mechanism for natural capital. Examples of efforts by international organisations include the introduction of ecosystem assessments, such as the Millennium Ecosystem
Assess-ment (MEA, 2005) and the TEEB report (TEEB, 2010), for identifying and
clas-sifying the range of economic benefits derived from nature. In addition, the UN Statistical Commission has introduced the System for Environmental-Economic
Accounting (SEEA-CF, 2012) as an international framework to provide guidance
on how to quantify natural capital value. Similarly, institutions such as
TheWorld-Bank (2001) and the UNEP&UNU-IHDP (2014) have presented some of the first
valuations of natural capital in multiple countries as part of their work to ac-count for the wealth of nations. A number of national authorities worldwide have also developed and implemented their own national natural capital accounting
systems. Prominent examples include the national governments of Norway (
Alf-sen and Greaker, 2006), the UK (ONS, 2012), Australia (BureauOfMethodology,
2013), Sweden (StatisticsSweden, 2015), and Canada (StatisticsCanada, 2016),
leading countries in the practical implementation of natural capital accounts. Con-tributions from the private sector include the Natural Capital Coalition’s creation
of the Natural Capital Protocol (NCC, 2016), a set of natural capital accounting
1.1. Background 5 academic side, most of the research focused primarily on the study of two different aspects of natural capital: the relationship between natural capital and
sustain-able development (e.g. Hamilton and Hartwick(2005),Arrow et al.(2012),Arrow
et al. (2013), Dasgupta (2010)), and the integration of natural capital accounts
into decision-making (e.g. Ruckelshaus et al. (2015),Oosterhuis and Ruijs(2015),
Greenhalgh(2015),Hedden-Dunkhorst et al.(2015),Schaefer et al. (2015),Galler et al. (2016)).
Despite the significant progress achieved to date in the study of natural capital, only scant research is dedicated to the specific study of the use of natural cap-ital accounts to assess changes in the value of natural capcap-ital over time. A few
examples in the literature include Lange (2004), who measures natural capital
value changes in Botswana and Namibia; Ollivier and Giraud (2011), who
evalu-ate natural capital trajectories in Mozambique; andDasgupta(2014), who assesses
changes in natural capital value in India. Yet, to the best of our knowledge, no work in the literature has previously addressed this challenge for the specific case
of the UK. In addition, the Natural Capital Committee (NCC, 2014a) also
recog-nises that very little research has been carried out to investigate the performance of natural capital investments and on how to develop new approaches for natu-ral capital financing. Investments in natunatu-ral capital continue to be regarded as alternative investments of secondary importance for private investors when com-pared to traditional asset classes (i.e., equities, bond instrument or real estate); and this is likely due to the lack of consensus on their financial benefits (see e.g.,
Olsson (2007),Eichholtz et al. (2012),Chan and Walter (2014), Silva and Cortez
(2016)). Moreover, approaches for natural capital investments are still limited in
number or do not yet present the most appropriate types of natural capital in
which to invest (CLA, 2016). By examining the financial performance of natural
capital investments and contrasting their outcomes with those of other financial instruments, we will have demonstrated in the present thesis the attractiveness of natural capital investments to private investors.
1.2
Objectives and research questions
In view of the aforementioned considerations, the research conducted here investi-gates the importance of natural capital accounting in the measurement of changes of natural capital value over time, and in the use of financial mechanisms to invest in natural capital. We examine three specific aspects of natural capital in detail from both a financial and a macroeconomic perspective. First, we analyse the ma-jor factors driving changes in the value of natural capital stock and its relationship with other capital assets such as produced and human capital. Second, we study the performance of investments in natural capital and discuss their implications for private investors. And third, we examine the use of Sovereign Wealth Funds (SWFs) as a unique financial instrument for investing in and preserving the value of natural capital. In the present research we identify three specific objectives
• To evaluate changes in natural capital value within the framework of total
wealth by considering the UK case study.
• To study the performance of investments in natural asset forms and to
com-pare them with the performance of traditional asset classes (i.e., equities, fixed income, and real estate instruments).
• To investigate the capability of SWFs to act as financial mechanisms for
preserving the value of natural capital by dedicating significant investments in natural assets.
The first objective aims to provide an answer to the research questions: What are the main drivers of changes in natural capital value? And how can this informa-tion be used to improve natural capital management? Moreover, which natural assets are more exposed to the risk of declining in value? And what are the major factors impacting that risk? To answer these questions and in order to address
the first objective, the work presented in Chapter 4 focuses on the wealth
com-position of the UK and analyses the changes in the value of its natural capital. A stochastic model for risk analysis is developed to estimate changes in the UK’s
1.2. Objectives and research questions 7 produced, human, and natural capital through the use of data reported by na-tional authorities between 1999 and 2012. The model incorporates some of the most relevant empirical relationships existing among capital assets and macroeco-nomic variables of interest for which data was available. In addition, the model estimates the risk of declining per capita values of natural capital and wealth and identifies the major factors influencing those risks using sensitivity analysis in fu-ture scenarios. Results from this part of the research suggest that the decline of natural capital value in the UK, between 2003 and 2013, has mainly been driven by a loss of non-renewable natural capital, together with variations in the value of ecosystem services. However, as levels of non-renewable natural capital continue to be depleted, attention is expected to be paid over the coming years to recover renewable natural capital.
The second objective addresses the following questions. What are the main fi-nancial benefits and challenges associated with natural capital investments? How do these investments need to be attractive and convenient for private investors? Moreover, how do investments in natural capital assets impact an investor’s port-folio composed of traditional asset classes (i.e., equity, real estate, fixed income) and other non-traditional assets (i.e., infrastructure)? To this end, we conduct an analysis of price time series, extending from 2000 to 2016, for real and non-real
natural assets in Chapter 5. The financial evaluation focuses on estimating the
average return, volatility, downside risk, diversification potential, inflation protec-tion, and liquidity risk exhibited by the assets. Optimal portfolios are constructed using Markowitz optimisation models that are periodically updated employing out-of-sample simulation techniques. Our findings reveal, importantly, that invest-ments in real natural assets outperform investinvest-ments in traditional asset classes. Moreover, it is demonstrated that investments in real natural assets provide higher expected returns, lower volatility, protection against unexpected inflation, reduced downside risk, and lower exposure to liquidity shocks in financial markets com-pared to traditional portfolios. Thus, real natural assets may be regarded as very attractive for investors. However, the same level of benefits does not hold true for non-real natural asset investments.
Finally, our third objective answers the questions: Can specific financial mecha-nisms such as SWFs actually support the preservation of natural capital value? Can this emerging type of fund benefit from increased investments of their
re-source rent in renewable forms of natural capital? As a case study in Chapter 6,
we model the investment portfolio of an oil-funded SWF using Norway’s Pension Fund Global (the world’s largest SWF by 2017). We evaluate the performance of the fund, when including allocations in natural capital, over a nine-year period
extending from March 2007 to March 2016. We employ Gintschel and Scherer
(2008)’s optimisation method to estimate global efficient portfolios for asset
allo-cation while also considering the relationship between investments and commodity price fluctuations. Results in this case demonstrate that the inclusion of real nat-ural asset investments in the portfolio of an oil-based SWF has a positive effect on the performance of the portfolio. The benefits manifest as higher expected returns, lower volatility, greater savings, and hedging against oil price risk. In fact, results suggest that SWF investors can reconsider their traditional allocation levels in natural assets (2-5%) by raising them significantly (15-20%) and still benefiting from these investments. And in doing so, SWFs would also support other major investments dedicated to the recovery of natural capital value.
1.3
Thesis contribution
The main contributions of this thesis are, accordingly, oriented towards increasing the understanding of (i) the major factors driving changes in natural capital value for the specific case of the UK, (ii) the types of natural capital investments that are more attractive to private investors, and (iii) how specific financial mechanisms such as SWFs can be implemented to support significant investments in natural capital.
In this regard, results derived from the work on natural capital and wealth ac-counting contribute to building a picture of the current condition of the UK’s natural capital. Natural capital in the UK represents by far the lowest fraction
1.3. Thesis contribution 9 of wealth in this country when compared to the values of human and produced capital. The majority of the UK’s natural capital value is found in the measure-ment of ecosystem services rather than in non-renewable or renewable natural capital. Additionally, unlike human or produced capital, natural capital values are less associated with variations in the economic performance of the country as reflected in GDP changes. And yet, the value of all forms of natural capital in the UK has been decreasing in the last 10 years, with the rate of decline being particularly fast for non-renewable natural capital. A significant contribution of the present work is the finding that the loss of natural capital value has not been mainly driven by variations in GDP, but rather by the progressive depletion and deterioration of natural capital reserves. This particular contribution confirms the findings reported by the ‘Nature and Wellbeing Act’ Green paper published by Benwell et al. (2014) on UK’s nature condition. Another contribution is that we have identified that future trajectories of aggregate natural capital may be re-versed from declining trends, under optimistic scenarios, if the value of ecosystem services is increased. Nevertheless, an apparent overall increase of natural capital due to higher valuation of ecosystem services may mask falls in the value of other natural capital forms. Finally, we also find that as non-renewable natural capital reaches depletion, factors from renewable natural capital such as the output of the agriculture and water industries will overtake in importance those of fossil fuel production for impacting the risk of declining per capita levels of natural capital. With regard to the second point, it is noteworthy that the thesis findings on natural capital investments contribute by identifying some of the benefits for institutional investors who dedicate major investments in real natural capital assets. Supported by results, in this part of the work, we argue that investments in real natural cap-ital assets will be regarded as an investment option with the same relevance as traditional asset classes, and not as a mere alternative. The present thesis shows that investments in real natural assets can out perform certain assets such as eq-uities, bonds, real estate, and even infrastructure. Moreover, when adding real natural assets into a portfolio composed of traditional assets, financial benefits are observed as higher expected returns, lower volatility, and increased diversification
potential. The results obtained in this thesis also contribute to confirming that investments in real natural assets provide hedging against inflation, and in partic-ular against unexpected inflation. Nevertheless, we also emphasise that in order to access the benefits of real natural capital investments, investors should ideally possess long investment horizons and large amounts of capital under management. These two factors still represent the greatest barriers against increasing allocations in real natural assets.
Lastly, the present research on SWFs contributes insights via our demonstration of how these funds can be successfully implemented as natural capital funds to main-tain the value of natural capital. SWFs are able to manage the revenues received from non-renewable natural capital exploitation, convert them into a financial wealth form, and reinvest them in renewable natural capital. Thesis results also show that SWF portfolios can significantly increase their allocations in natural capital from current standard levels (3-5%) to a much higher level (15-20%) and still benefit from these investments. By including natural assets as a large frac-tion of the investment portfolio, an SWF can increase its level of returns, reduce volatility, and hedge inflation against commodity risk. Moreover, we find that these benefits are higher during periods of financial hardship and in circumstances where natural asset investments are carried in replacement of equity investments. Thus, if SWFs push their allocations in natural capital assets to higher levels, these funds are likely not only to improve their performance but also to be reconfigured as a new investment approach for natural capital.
1.4
Thesis structure
The structure of the thesis is illustrated in Figure1.2, and the content of the next
chapters is organised as shown below.
In Chapter 2, we provide an overview of the concept of natural capital within the
framework of the capital approach to sustainability. The chapter also discusses the importance of natural capital accounting to support decision making and presents
1.4. Thesis structure 11
ACCOUNTING & VALUATION
Natural capital trajectories and changes in value
(Chapter 4)
INVESTMENT PERFORMANCE
Comparison of the investment performance of real and non-real natural assets: benefits & risks
(Chapter 5)
Investigate the capacity of Sovereign Wealth Funds to preserve the value of natural wealth
(Chapter 6) NATURAL CAPITAL
Context, problems, and research objectives
(Chapter 1)
The capital approach to sustainability and natural capital accounting
(Chapter 2)
Economic
interpretation interpretationFinancial
Theoretical foundation
(Chapter 3)
FINANCIAL INSTRUMENTS
Findings, contribution, recommendations, and future research
(Chapter 7)
Figure 1.2: Schematic representation of the thesis structure
the latest progress in this subject achieved worldwide and in the UK. In addition, we discuss some of the major challenges faced in natural capital accounting, which is one of the motivations for the present research.
In Chapter 3, we introduce the theoretical foundation for this research. This
chapter describes the relevant theoretical concepts, methods, and fundamental definitions underlying the methodologies implemented in the chapters to follow. A description of some of the stochastic processes most commonly used to model commodity prices in natural capital valuation is presented, in addition to an in-troduction to global sensitivity analysis which we use to estimate the sensitivity of the natural capital model developed in this work. Here, we discuss some of the most relevant relationships in macroeconomic theory and which are also relevant to natural capital value changes. Lastly, we provide a description of the portfolio optimisation techniques for asset allocations.
Chapter 4presents the analysis of the UK’s natural capital accounting and asset
applications, a description of the methodology followed by a stochastic model for UK wealth, and a discussion of the relationships established among capital assets. The simulation results on assessing the trajectories of natural capital changes are also provided.
Chapter 5introduces the study on the performance of investments in natural
as-sets. This chapter presents a comparison of the investment performance between non-real and real natural capital assets, focusing in particular on the risk-return characteristic, downside risk, correlation with traditional asset classes, diversifi-cation potential, their ability to hedge inflation, and their exposure to shocks in stock market liquidity.
Chapter 6 sets out the analysis of SWFs as instruments for the preservation of
natural capital. This chapter introduces a model of an SWF portfolio based on the portfolio of Norway’s Government Pension Fund Global and assesses its per-formance when investing in real natural assets. The capacity of these funds to manage and invest in natural capital is evaluated, and the results describing the significant benefits from these investments are discussed.
Finally, in Chapter7, we provide a summary of the main conclusions and findings
derived from this work. This last chapter discusses the main contributions of the thesis to the literature, introduces the limitations of the work conducted here, and provides suggestions for further research.
2
An overview of Natural Capital
2.1
Definition
Natural capital refers to the stock of natural assets and ecosystem services that
provide value, directly or indirectly, to people and the economy (NCC,2014c). The
concept of natural capital was first introduced at the end of the 1980’s as a result
of a more ecologically aware thinking in economics (Akerman,2003). As explained
by Akerman (2003), Pearce (1988) was the first economist to use the expression ‘natural capital’ to refer to the set of natural resources and services provided by na-ture. During the 1990’s, the emergence of environmental and ecological economics broadly adopted the concept in order to incorporate environmental constraints
into economic analysis (Costanza,1991). And later, in the 2000’s, the Millennium
Ecosystem Assessment (MEA, 2005) work on assessing the benefits derived from
nature, agreed on natural capital as the sum of exhaustible or non-renewable nat-ural resources, renewable natnat-ural resources, and ecosystem services. The current application of the term ‘ecosystem services’ encompasses the different stream of benefits derived from nature that are essential for supporting human wellbeing and
economic development. MEA (2005) bundles ecosystem services into four main
categories: (i) provisioning services (e.g., food provision, freshwater provision, wood and fiber, fuel, energy, etc.); (ii) regulating services (e.g., climate regula-tion, food regularegula-tion, disease regularegula-tion, water purificaregula-tion, etc.); (iii) supporting services (e.g., nutrient cycling, soil formation, primary production, etc); and (iv)
cultural services (e.g. aesthetic, recreational, spiritual, educational, etc). Figure
2.1 sets out a schematic representation of the different forms of natural capital.
Figure 2.1: Natural capital categories
Source: Eden Tree.
Human wellbeing is fully dependent on the services and products provided by nat-ural capital. Nature provides essential life supporting elements including the air we breath, the water we drink, the food we eat, the climate in which we live, and
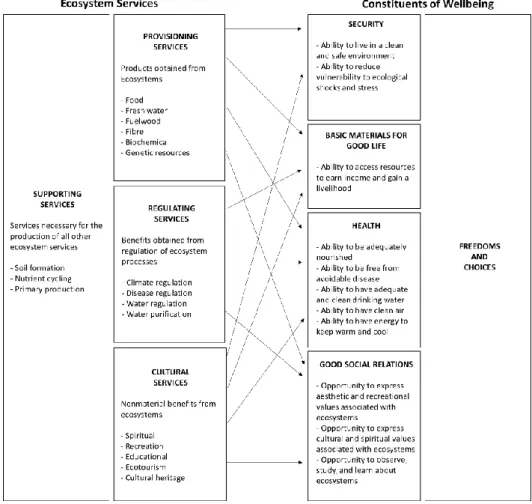
the places and other species that define our environment. Figure2.2 illustrates the
linkages between categories of ecosystem services and several components of human wellbeing. Provisioning services are the products people obtain from ecosystems,
2.1. Definition 15 such as food, fuel, fibre, wood, fresh water, and genetic resources. Regulating services are the benefits people gain from the regulation of ecosystem processes, including air quality regulation, climate regulation, erosion control, human dis-eases prevention, and water purification. Cultural services are the non-material benefits people obtain from ecosystems through spiritual fulfilment, cognitive de-velopment, reflection, and recreation. And supporting services are those necessary for maintaining all other services, such as primary production, oxygen generation, and soil formation. Changes in these services affect human wellbeing in many ways through impacts on security, the basic material for good life, health, and social and cultural relations. These constituents of wellbeing, ultimately, have an influence on the freedoms and choices available to people. Security may be affected by changes in provisioning and regulating services, which impact supply of food, water and other goods, the likelihood of conflict over declining resources, or the frequency and severity of natural hazards. For example, food shortage has been a serious concern among some Sub-Saharan African nations over the last
decade (FAO, 2017), and mangrove forests are a essential to protect coastal
resi-dents from storms in Vietnam (Kousky,2010). The ability to access resources for
a good life is related to provisioning services such as food and fibre production and regulating services including water purification. People’s health is strongly as-sociated to both provisioning services, including food production, and regulating services such as those influencing the spread of transmitting diseases. Degradation of fishery resources, for example, may derive in a declined protein consumption
for local coastal communities (Tidwell and Allan, 2001), and degradation of water
and forest resources may increase the burden attributable to malaria in tropical
countries (Pruss-Ustun and Corvalan, 2006). Human spiritual values and social
relationships are influenced and shaped by changes to cultural services, which
im-pact the degree of human experience. For instance, Osuri et al. (2014) describe
how local villages in India preserve sacred groves of forest for spiritual reasons, and
Mexia et al. (2018) show how urban parks provide important recreational and so-cial hubs in cities around the world. The capability of people to access to freedoms and make choices is subjected to the degree of existence of all these components
of wellbeing. Therefore, maintaining minimum levels of natural capital stock and services is necessary to ensure and enhance multiple factors of human’s life.
Figure 2.2: The role of ecosystem services for human wellbeing
Source: MEA (2005).
In addition to human wellbeing components, countries economic growth and de-velopment is also dependent upon the flow of natural capital services. Traditional natural resource-based industries such as agriculture, forestry, mining, energy, fish-ery or tourism are vital for many countries, particularly for developing economies (Jovic et al.,2016). Moreover, macroeconomic factors such as income and employ-ment, relevant indicators of an economy’s health, are also influenced by the con-dition of natural resources in both developed and developing countries. Changes in natural capital services may also impact the economic performance of nations and their capability to develop urban and industrial centres. Increased produc-tion of crops, fishery, forest, and mining products, as well as, ecotourism services
2.1. Definition 17 have been associated with significant growth in local and national economies,
in-creased employment, and improved labour productivity (Onate-Calvin et al.,2018;
Cuellar, 2017; Horsley et al., 2015). Similarly, in regions where productivity has declined due to land degradation, overharvesting, or resource depletion the im-pacts on local economies and employment can be devastating to those who rely on
those services for income. As an example, BSF (2018) describes how the collapse
of the Newfound-land cod fishery due to overfishing in the early 90’s resulted in the loss of thousands of jobs with an estimated cost of at least $2 billion in income support. Changes in ecosystems may also contribute to increased green-house gas (GHG) emissions which has a significant economic impact, particularly in
devel-oped economies (Hamilton, 2017). Furthermore, the ability of developing urban
areas may also be compromised due to changes in ecosystem services. Urban de-velopment is often threatened by the inability of securing water and air quality provision. Recent examples of this have been witnessed in Cape Town (South Africa), Sao Paulo (Brasil), Mexico City (Mexico), Bangalor (India) or Beijin
(China), which are facing the risk of water shortages (BBC, 2018).
The current issue with natural capital is that, unlike other capital forms such as human or produced capital, its value has been steadily decreasing over the years
and the stream of services derived from nature are degrading (refer to Section1.1).
The degradation of natural capital value have been primarily driven by an exces-sive demand for ecosystem services stemming from economic growth, demographic changes, and individual choices. However, this degradation has also been exacer-bated by a lack of sufficient knowledge and understanding of the current condition of natural assets and the factors driving changes on natural capital value. De-cision makers in the public and private sector often must balance their choices between economic growth and social development with the need of environmental conservation. Nevertheless, current decision-making processes normally exclude or underestimate the value of ecosystem services, leading to a mismanagement of natural assets. Poorly managed natural capital not only results in ecological detriment but also generates social and economic liabilities. At present, the over-exploitation of natural capital is reducing the flow of benefits derived from nature,
and therefore, severely impacting economies and jeopardising the ability to deliver
sustainable development. For instance, the Truscost-TEEB (2013) report
esti-mates that the global top 10 environmental externalities, including gas emissions, water use, land use, air pollution, land and water pollution, and waste, are costing the global economy nearly US$ 4.7 trillion a year in term of degradation of natural capital. The same source estimates that, in Europe alone, the economic cost of natural capital depletion due to GHG emissions, land use degradation, and water supply scarcity, has been on the order of approximately US$ 337 billion per year.
As discussed by Helm (2015), in order to reverse the declining trends of natural
capital and save the associated costs, the situation requires the development and implementation of accounting mechanisms and financial approaches dedicated to natural capital. Natural capital accounts are not only essential for capturing the value of natural capital in financial terms, but they are also crucial for tracking changes in the value of natural capital assets over time, and identifying the
ma-jor factors driving the changes (Barbier, 2014b,a). Likewise, financial approaches
aiming to allocate significant investments in natural capital, are fundamental to
the recovery of downward-moving values of natural assets (Rands et al., 2010).
2.2
Natural Capital and the Capital Approach
The concepts of natural capital and sustainable development are closely related due to the importance of natural resources in delivering development over the long
run (Atkinson et al.,1997). When trying to define sustainable development within
natural capital economics, two major paradigms emerge: weak sustainability and
strong sustainability (Dietz and Neumayer, 2007). The key difference between
these paradigms lies in whether natural capital can be regarded as substitutable by other capital forms, especially produced capital. Weak sustainability provides a view in which some environmental assets can be substituted by man-made and human capital. Proponents of this pragmatic paradigm argue that although the three type of capital (produced, human, and natural) are not perfect substitutes,
2.2. Natural Capital and the Capital Approach 19 the degree of substitution is not zero. Possible substitutions can be found for nat-ural capital products such as raw materials used for production and consumption (Neumayer,2000). Weak sustainability stablishes that when non-renewable natu-ral capital is consumed, other assets need to set aside to compensate for what has been used. This may be achieved, for instance, by setting a specific fund for saving purpose or by reinvesting the utility obtained from non-renewables in improving
produced and/or human capital instead. However, as discussed by Barbier et al.
(1995), the major problem faced by this paradigm is that many life supporting
natural assets are impossible to substitute. Moreover, for those that is possi-ble, substitution may become more difficult as resource efficiency becomes higher. Based on this argument, the strong sustainability paradigm, on the other hand, establishes that substitution is not permissible for any form of natural capital, and all natural assets must be preserved. This paradigm places nature as the primary factor of production, and labour and fix capital are secondary, derived
from and dependent on nature. According to Helm (2015), the principal problem
with the strong sustainability paradigm is that it is extremely rigid as it rules out substitution between natural capital and other factors of production. There-fore, this paradigm goes against any economic development initiative. Given the extreme perspective provided by both approaches, a number of rules have been suggested by economists in order to find a middle ground between these conflicting
paradigms and operationalise sustainability. Neumayer (2000) identifies two main
schools of thought. One requires that non-renewable resource extraction should be compensated by an investment in renewable resources (e.g. green technologies, timberland, or agriculture). The second requires that a subset of so called ‘crit-ical assets’ (those strictly non-substitutable) remains intact in phys‘crit-ical terms for future generations. Regardless their differences, both schools of thought are asset based which have led economists to formulate the ‘capital approach’ in order to adhere natural capital into sustainably measurements.
The concept of natural capital has been endorsed by the ‘capital approach’ for
assessing sustainability in development (UN, 2008; Dasgupta, 2009). The capital
and at a time when traditional indicators such as GDP could not provide useful
information on sustainable asset management (Costanza et al., 2009, 2014). This
approach focuses on measuring the condition of the capital assets that compose the wealth of a region, including human, produced, and natural capital, and that
are used as an input factor for production. Figure 2.3 illustrates the focus of
the capital approach and compares it with the focus provided by GDP. GDP specifically measures current economic activity in the form of input and out flows, but does not address the condition of the capital stock necessary to maintain levels of production and consumption. On the contrary, the capital approach explicitly measures the condition of capital assets by estimating the monetary value of each capital component. The criteria for sustainability set by the capital approach establishes that sustainable development is a development that ensures
non-declining per capita wealth over time (see Polasky et al. (2015); Heal and
Kristrom (2005); Dasgupta and Maler (2001); Arrow et al. (2012, 2013)) where wealth is defined as the aggregate value of the stock of human, produced, and natural capital. Thus, the capital approach for sustainability analysis highlights two types of activity in relation to capital assets: (i) estimating the monetary value of the available capital stock, and (ii) tracking changes of the per capita value of capital assets in time.
The major strengths of the capital approach, different from GDP, are that it provides quantifiable criteria for sustainability and also incorporates the value of natural resources, aspects commonly neglected by the GDP approach. But de-spite the strengths offered by the capital approach, this approach also encounters several limitations in terms of valuation (i.e. practical issues found when valuing the capital stock) and critical capital appraisal (i.e. the degree of
substitutabil-ity among capital assets) (UN, 2008). Capital accounting requires us to measure
shadow prices, and the capital approach assumes that shadow prices can always be
measured. However, McFadden (1996) argues that this assumption is not
realis-tic, given that the valuation of all capital assets is not always feasible. McFadden
(1996)’s opinion is also supported by Cairns (2013) and Smulders (2012), who
2.2. Natural Capital and the Capital Approach 21
Figure 2.3: The three capital model of wealth creation
Source: The Inclusive Wealth Report (UNEP&UNU-IHDP,2014).
true in many cases. Moreover, the measure of sustainable development provided by the capital approach works under the condition of a high degree of substi-tutability among capital assets, in line with the weak sustainability paradigm.
Stern(1997), nevertheless, argues that in reality, the degree to which various cap-ital stocks, and in particular the stock of natural capcap-ital, can be substituted, is limited in accordance with the strong sustainability paradigm. Thus, it would be inadequate to aggregate values of non-critical capital with those of critical capital
because information for sustainable development would be lost. Roman and Thiry
(2016) also present a critical appraisal of the capital approach in their discussion of
the major limitations found in its unrealistic assumptions. Despite the aforemen-tioned criticism and limitations, the capital approach to sustainability continues to be the most viable mean of addressing sustainability issues in development. This approach has been broadly adopted by many international organisations and national authorities around the world for measuring wealth. Therefore, we can
assert that the capital approach has motivated the development of natural capi-tal accounting systems for incorporating the value of nature into national wealth accounts and therefore also tracking variations in the condition of natural capital over time. Furthermore, the capital approach prompts the necessity for investment mechanisms capable of maintaining per capita levels of natural capital in order to achieve sustainability.
2.3
Natural Capital Accounting
Natural capital accounts are mechanisms able to register the monetary value of natural capital stock and flows, as well as, monitor changes in the value of these
assets over time (TheWorldBank,2016). Accounting can be used to assess the total
contribution of ecosystem products and services to human wellbeing, to increase the understanding of the incentives faced by decision-makers, and to evaluate
the consequences of actions taken in favour or against the environment (MEA,
2005). Accounting system for natural capital is becoming an increasingly relevant
component of the national accounts of a country. The system of national accounts (SNA), developed by the UN Statistical Commission (UNSC), is the international statistical standard for compiling measures of economic activity of nations based
on common accounting conventions (SNA, 2009). SNA is used to derive some
of the most important statistics for a country, including GDP, household saving
ratio, public debt, and consumption. Nevertheless, as suggested byOchuodho and
Alavalapati (2016), there is an increasing recognition that SNA shall also provide an indication of the impact of economic activity on the environment and the services derived from nature. In response to this need, the UN created the UN’s
System of Environmental-Economics Accounting Central Framework (SEEA-CF,
2012) as a comprehensive accounting framework specifically designed for natural
capital.
The development of the SEEA framework marks a significant contribution to-wards the implementation of natural capital accounting. The framework allows
2.3. Natural Capital Accounting 23 for the full integration of natural capital into traditional SNA, thereby establish-ing a link between the environment and all sectors of the economy that can be
used for policy analysis (Bartelmus, 2014). As Ochuodho and Alavalapati (2016)
show, however, few countries have implemented or are currently in the process of implementing natural capital accounting into their national accounts. Prominent
examples include Norway (Alfsen and Greaker,2006), Canada (StatisticsCanada,
2016), Sweden (StatisticsSweden,2015), Australia (BureauOfMethodology,2013),
and the UK (ONS, 2012). Initiatives for natural capital accounting have also
emerged in the private sector with the creation of the Natural Capital Protocol by
the Natural Capital Coalition (NCC,2016). The natural capital protocol provides
a methodology for natural capital accounting specifically designed for corporations and businesses. The importance of natural capital accounting is that it contributes to increasing the understanding of the relationship between economic or business activities and the services derived from the environment. Moreover, they help to support better-informed decision making. Public policy makers and private cor-porations may recognise the role of natural capital if they are able to see the direct impact of the economy or business on nature in real world scenarios.
Although progress has been made in developing and implementing natural capital accounting systems, there are still challenges to be overcome in ensuring natural capital is fully integrated into the economy. Many countries still lack the capacity
to implement the SEEA framework (Ochuodho and Alavalapati,2016). Moreover,
in those countries where SEEA has been implemented, natural capital accounts
only capture partial estimations of natural assets (e.g. Khan et al.(2014)). Valuing
natural capital for accounting purposes is complex (in some cases even
impossi-ble), as benefits from nature are in many cases indirect or intangible (Craig and
DePratto,2014). A large amount of data regarding the characteristics and services of nature in a given area is required, and in most cases, data is non-existent or it
has only recently started to be collected (Spurgeon,2014). Most existing valuation
methodologies are based on a large number of assumptions that may be
consid-ered unrealistic. Added to these challenges,Ochuodho and Alavalapati(2016) also