CHAPTER 5
Troubleshooting DNA Sequencing Data
Instrument Artifacts Failed Injection High Background Color Balance Biased Reptation Electrophoresis Artifacts Weak Signal Overloading Current FluctuationsDye Terminator Sequencing Artifacts
Dye Blobs without Sequence Data Dye Blobs in the Sequence Data Cliff Effect
Amplification Artifacts Split peaks or “A” Tailing PCR Product Sequencing Contaminating Primer
Dye Primer Sequencing Artifacts
Primer Peak without Sequencing Data Sequencing Data is Missing a Base
2
Chapter 5
Troubleshooting DNA Sequencing Data
Prior to diagnosing problems with sequencing reaction chemistry, it is necessary to verify that the MegaBACE instrument is in optimal working condition. This can be accomplished by injecting a plate of MegaBACEM13 DNA sequencing standards (US79678) and performing electrophoresis according to the accompanying protocol. If the overall average read-length (98.5% accuracy) of this standard plate is < 500 bases per sample, it may indicate that the instrument is in need of some routine maintenance, such as capillary cleaning and focusing. For further details, call the Amersham Biosciences Field
Support office at:
North America: +1 800 743 7782.
Europe: Japan:
Instrument Artifacts: Failed Injection of Sample
• Failure to observe any signal above background in all four channels is known as a failed
injection.This problem can result from several factors related to either the sequencing chemistry or the instrument.
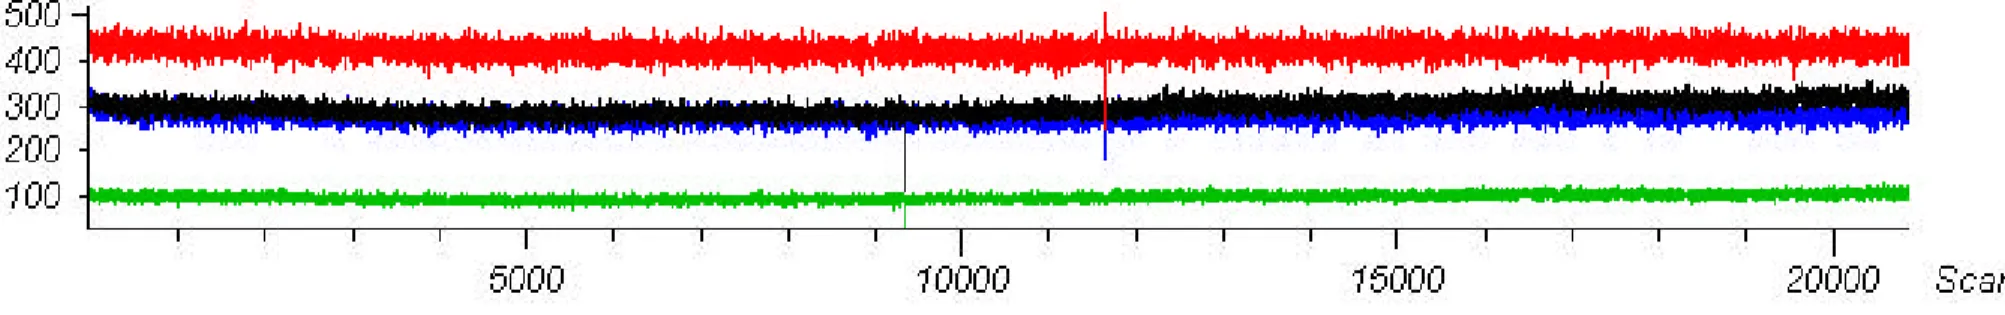
Dye primer and dye terminator sequencing data exhibit the same characteristics when samples fail to inject. Background is usually normal, and neither dye blobs of unincorporated terminator nor primer peak are observed, indicating that no fluorescent labelled material was injected into the capillaries (Fig 5.1). This may be observed in one or more capillaries (Table 5.1), in an entire array (Table 5.2), or in an entire plate (Table 5.3). Several possible reasons for this observation are discussed in the following pages. For instrument problems, consult the MegaBACE Users’ Manual and call the Amersham Biosciences Field Support office at 1-800-743-7782 for further details.
Figure 5.1. Failed injection. Failed injection is characterized by no signal above background. The same profile is observed for primers and terminators. In dye primer reactions, background is normal (see below), and no primer peak is observed. Similarly, in dye terminator data, there is no evidence of dye blobs (data not shown).
4
Failed Injection: Individual Capillaries
Occasionally, some capillaries fail to inject sample (Table 5.1). Such failures occur when either the capillary or the electrode fails to make contact with the sample during injection, or when the capillary becomes blocked. Potential causes of this problem include the following:
• The capillary was broken or too short.
Frequently, capillaries that fail to inject sample show no current during electrophoresis. Occasionally, if a capillary is broken, it will fail to make contact with the sample during injection, but it will still make contact with the running buffer. In this case, the capillary still registers current.
Suggestion: Verify capillary and instrument performance with a run of M13 standards. All capillaries should show signal and register current.
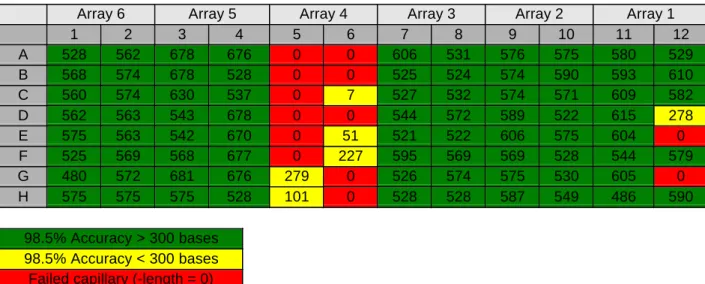
Table 5.1. Failed injection into individual capillaries. MegaBACE M13 sequencing standards were prepared according to protocol and injected at 2 kV for 75 s.
Electrophoresis was conducted at 9 kV for 100 min. Read-length was determined using the Readcheck utility to calculate the accuracy of basecalliing to 98.5%.
Array 6 Array 5 Array 4 Array 3 Array 2 Array 1
1 2 3 4 5 6 7 8 9 10 11 12 A 528 562 678 676 526 0 606 531 576 575 580 529 B 568 574 678 528 556 619 525 524 574 590 593 610 C 560 574 630 537 580 574 527 532 574 571 609 582 D 562 563 543 678 517 528 544 572 589 522 615 278 E 575 563 542 670 526 575 521 522 606 575 604 0 F 525 569 568 677 570 227 595 569 569 528 544 579 G 480 572 681 676 279 576 526 574 575 530 605 0 H 575 575 575 528 408 0 528 528 587 549 486 590 98.5% Accuracy > 300 bases 98.5% Accuracy < 300 bases Failed capillary (read-length = 0)
• The electrode was bent or broken.
Capillaries associated with bent electrodes do not inject sample and have no current during electrophoresis. Absence of current can be verified by checking the current monitor during electrophoresis.
Suggestion: Lower the cathode stage, and with a flashlight, inspect the electrodes. If the electrodes are bent, call for service.
• There was no sample solution at the bottom of the tube due to the presence of a bubble that
separated the sample from the end of the capillary.
During the process of handling the plate or pipetting loading solution, a bubble or air pocket can be introduced which separates the sample from the end of the capillary.
Suggestion: Bubbles or air pockets can be removed by briefly centrifuging the samples and the buffer plate immediately prior to placing in the instrument.
• No dissolved sample was present.
Occasionally, due to operator error in pipetting, samples are not dissolved in loading solution.
Suggestion: Verify that loading solution was delivered to all samples.
• The end of the capillary was blocked.
Capillaries can become blocked if the cathode stage tray is allowed to dry out. When this occurs, LPA crystallizes on the end of the capillary and acts as a plug. Blocked capillaries frequently exhibit lowered current profiles during electrophoresis.
Suggestion: Place a water tray on the cathode stage and allow the capillary ends to soak for 24–48 h. If the problem is chronic and present in several capillaries, consider replacing arrays as necessary.
6
Failed Injection: Arrays
Occasionally, an entire array fails to inject sample (Table 5.2). This can be due to the following: • The array was not filled with matrix.
Failed injection occurs when capillaries fail to make contact with the LPA matrix due to broken ends (anode side). It may also occur if less than the required amount of LPA is used as when attempting to perform more than one injection of matrix from a vial of LPA.
Suggestions:
• Examine the anode end of the capillary for breakage. If breakage is noted, replace the array.
• Examine the tube of LPA for proper fill-volume. Note: Matrix tubes are filled with sufficient LPA for one injection.
Table 5.2. Failed injection into an array. MegaBACE M13 sequencing standards were
prepared according to protocol and injected at 2 kV for 75 s. Electrophoresis was conducted at 9 kV for 100 min. Read-length was determined using the Readcheck utility to calculate the accuracy of basecalling to 98.5%.
Array 6 Array 5 Array 4 Array 3 Array 2 Array 1
1 2 3 4 5 6 7 8 9 10 11 12 A 528 562 678 676 0 0 606 531 576 575 580 529 B 568 574 678 528 0 0 525 524 574 590 593 610 C 560 574 630 537 0 7 527 532 574 571 609 582 D 562 563 543 678 0 0 544 572 589 522 615 278 E 575 563 542 670 0 51 521 522 606 575 604 0 F 525 569 568 677 0 227 595 569 569 528 544 579 G 480 572 681 676 279 0 526 574 575 530 605 0 H 575 575 575 528 101 0 528 528 587 549 486 590 98.5% Accuracy > 300 bases 98.5% Accuracy < 300 bases Failed capillary (-length = 0)
• Electrodes on the anode side were bent.
If the electrode on the anode side does not make contact with the matrix, then electrophoresis will not be possible in that array.
Suggestion: Examine the anode electrode to determine if it is bent or otherwise unable to make contact with the matrix. If this problem is detected, call for service.
• There was a problem with the CMON board.
8
Failed Injection: Entire Plate
Occasionally, an entire plate fails to inject sample (Table 5.3). Possible causes include the following:
• Due to operator error, the buffer plate rather than the sample plate was used for injection. Suggestion: Reinject the sample plate into freshly filled capillaries.
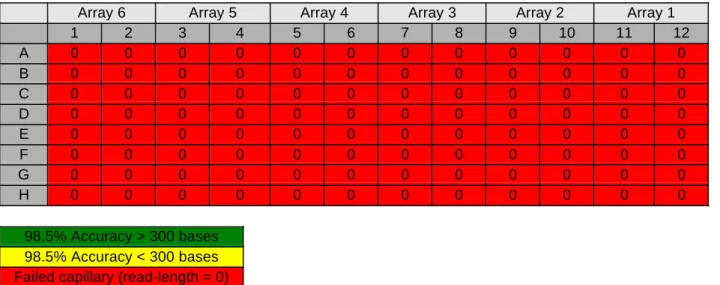
Table 5.3. Failed injection of an entire plate. MegaBACE M13 sequencing standards were prepared according to protocol and injected at 2 kV for 75 s. Electrophoresis was conducted at 9 kV for 100 min. Read-length was determined using the Readcheck utility to calculate the accuracy to 98.5%.
Array 6 Array 5 Array 4 Array 3 Array 2 Array 1
1 2 3 4 5 6 7 8 9 10 11 12 A 0 0 0 0 0 0 0 0 0 0 0 0 B 0 0 0 0 0 0 0 0 0 0 0 0 C 0 0 0 0 0 0 0 0 0 0 0 0 D 0 0 0 0 0 0 0 0 0 0 0 0 E 0 0 0 0 0 0 0 0 0 0 0 0 F 0 0 0 0 0 0 0 0 0 0 0 0 G 0 0 0 0 0 0 0 0 0 0 0 0 H 0 0 0 0 0 0 0 0 0 0 0 0 98.5% Accuracy > 300 bases 98.5% Accuracy < 300 bases Failed capillary (read-length = 0)
• One or more reaction components were omitted from the reaction mix. This is particularly true for dye terminator sequencing when the premix is not added, or for dye primer sequencing when the primer is not added.
Suggestions: Verify that all reaction components—premix, primer and template DNA—have been added to all termination reactions, and repeat the sequencing.
• There was a problem with the CMON board.
Suggestion: Call for service.
• There was a problem with the power supply.
10
Instrument Artifacts: High Background in DNA Sequencing Data
• The observance of high background in raw data is often symptomatic of dirty capillaries.
Data obtained from dirty capillaries is characterized by higher than normal baselines in one or all four channels. This is particularly true of the data recorded in channel 3 where a long-pass filter is used to collect fluorescence. In addition, each baseline will be noisy, resulting in a profile that appears “buzzy” (Figure 5.2). High background can interfere with the interpretation of sequencing data by hindering the ability of the analysis software to perform a correct spectral separation.
Capillaries become dirty over time. The application of high voltage gives a static charge to the capillaries that attracts dust particles. This process is accelerated if the instrument environment is not clean.
Suggestions:
• Clean the capillaries (Figure 5.3). Refer to Instrument Protocols for instructions on cleaning the array windows with a damp CleanTips™ swab (TX758B, The TEXWIPE Company).
• Clean the capillaries more thoroughly by removing them from the instrument and gently scrubbing the window surface with a CleanTips swab soaked in a 0.1% solution of Luquinox™. Rinse several times with water.
• Try photo-bleaching the window surface by scanning the capillaries for several hours or overnight.
Figure 5.2. High background. Data obtained using dirty capillaries is characterized by higher than normal baselines in one or all four channels. This is particularly true of the data recorded in channel 3 where a long-pass filter is used to collect fluorescence. In addition, each baseline will be noisy resulting in a profile that appears “buzzy”.
12
A. Dirty capillaries
B. Clean capillaries
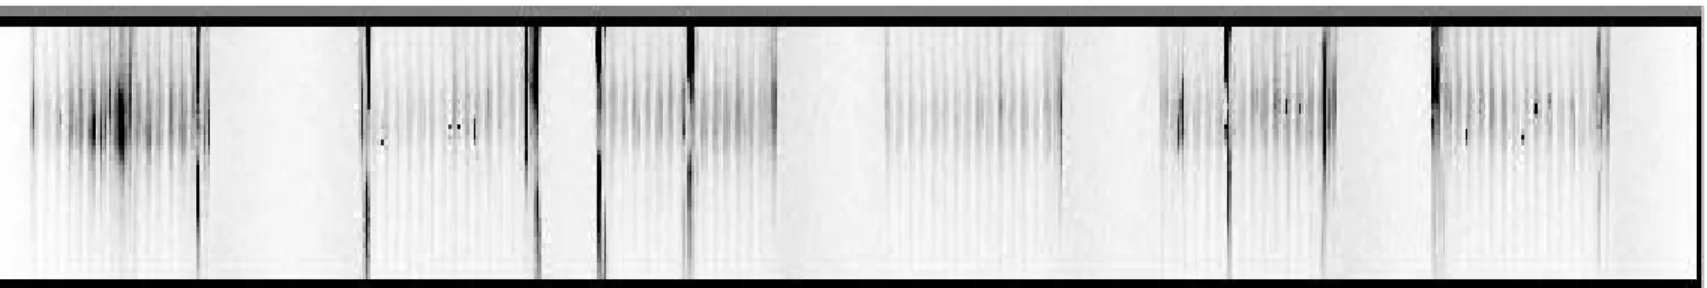
Fig 5.3. Image of capillaries displaying high backgroundComparison of the background observed in dirty and relatively clean capillaries based on images of capillary arrays taken during a step-through focus (see Chapter 6: Capillary Focus). The dark streaks in these images result from high
fluorescence background. A) Image of dirty capillaries cleaned once with a damp CleanTips swab; B) Image of the same capillaries after a thorough cleaning with detergent and several rinses with water.
Instrument Artifacts: Color Balance in DNA Sequencing Data
• Improper color balance of peaks may be indicative of incorrect instrument configuration.
Close examination of the data can provide information concerning the performance and configuration of the instrument. Figure 5.4 shows how improper color balance might appear when examining dye
terminator data generated using Thermo Sequenase II version 2.0. Note that the black (Channel 3 ROX) and green (Channel 1 R6G) peaks are significantly smaller than the blue (Channel 2 R110) and red (Channel 4 TMR) peaks. This problem is not related to sequencing chemistry because it is not possible to cause this condition in dye terminator sequencing by changing the reaction conditions or by clean-up of sequencing products.
Improper color balance can be caused by the following: • An incorrect set of filters and beam splitters was used.
• Filters or beam splitters were placed in the incorrect location. • An incorrect laser mode was selected.
• PMT voltages were significantly out-of-balance.
• Pooling errors resulted in dye primer sequencing data with poor color balance.
Suggestions:
• An excellent and quick diagnostic procedure can be carried out in Sequence Analyzer by selecting the MD basecaller and going through the analysis steps of baseline subtraction and spectral separation (but NOT normalization). If the instrument is set up properly, the colored spectrally separated peaks in channels 1, 2, and 4 should be roughly equivalent in size. The height of the channel 3 peaks, labelled with ROX, will be almost double t thaof the other three peaks (Fig 5.5) because the long-pass filter permits a greater amount of ROX fluorescence to be collected.
14
Spectral separated dataFigure 5.4. Instrument performance: Improper color balance. Data were obtained using Thermo Sequenase II version 2.0 dye terminators. Note that the black (Channel 3 ROX) and green (Channel 1 R6G) peaks are significantly smaller than the blue (Channel 2 R110) and red (Channel 4 TMR) peaks. In this example, the PMT voltages were significantly out-of-balance.
The example trace did not basecall with the MegaBACE analysis software.
Blue, green, red roughly the same size Black larger
Raw data
Spectral separated data Figure 5.5. Instrument performance: Proper color balance. Analysis of proper color balance using Sequence Analyzer. The MD basecaller was selected and the analysis steps of baseline subtraction and spectral separation (but NOT normalization) were carried out. If the instrument is set up properly, the colored spectrally separated peaks should be roughly equivalent in size (within about 2-fold) in channels 1, 2, and 4. In this example, the height of the G peaks (Channel 3 ROX) will be almost double that of the other three peaks.
[A][C] [G] [T]
16
Instrument Artifacts: Fluorescent Signal Prior to Raw Data
• Theappearance of extremely high fluorescent signal prior to the expected appearance of sequencing
data is symptomatic of a failure to completely flush the old matrix from a previous run.
In the case described by Figure 5.6, the biased reptation signal from a previous run passes the detection point well before the expected appearance of raw data (~ 20 min in a 9 kV run and 30 min in a 6 kV run). The
problem materializes when the applied high pressure is too low to fill the capillaries so that old matrix is not replaced with fresh matrix. Insufficient high pressure may be due to several factors, including a leak in the system, an empty nitrogen tank, or if the valve connecting the high-pressure tank to the instrument is in the closed position.
Suggestions:
• Verify that the high-pressure tank is delivering at least 1 000 psi to the system. If the pressure is < 1 000 psi, replace the tank with a new one.
• Check all external connections to make sure there are no leaks.
• Listen to the instrument when high pressure is applied during matrix filling. If a hissing sound is detected internally, call for service.
Figure 5.6. Fluorescent signal prior to raw data. DYEnamic ET terminator sequencing samples were injected at 2 kV for 75 s, and electrophoresis was performed at 6 kV. The biased reptation signal from a previous run passes the detection point well before the expected appearance of raw data. This occurs when old matrix is not replaced with fresh matrix. Such a condition can exist when the applied high
pressure is too low to fill the capillaries due to a leak in the system, an empty nitrogen tank, or if the valve connecting the high-pressure tank to the instrument is in the closed position.
Biased reptation from previous sample
18
Electrophoresis Artifacts: Weak Signal Strength
• Weak signal strength occurs when insufficient dye labelled DNA sequencing product is injected
into a capillary (Figure 2.5 and Figure 5.7).
Generally, this problem occurs when insufficient template DNA is used in the sequencing reaction. However, in some cases, the reaction may have successfully generated large amounts of signal-bearing product, but the reaction products were not injected efficiently. It is important to remember that
electrokinetic injection into capillaries is more efficient if the ionic strength of the loading solution is low. The following conditions can result in weak signal strength in sequencing data:
• Insufficient template DNA was used in the sequencing reaction.
Suggestion: Repeat the sequencing using more template DNA (Figure 5.7).
• The template DNA was of poor quality.
If DNA purification methods fail to produce template of consistent quality and mass, this will result in a greater occurrence of weak signal and overloading. There is a strong correlation between the consistent quantity of template DNA and the success of sequencing experiments.
Suggestion: Optimize methods for template preparation such that each sample to be sequenced contains a comparable amount of template. (See Chapter 2: DNA Sequencing Process, Appendix
B, Recommendations for the Millipore Plasmid Minipreparation using Multiscreen.)
• The number of thermal cycles performed was insufficient to generate adequate sequencing
product.
• Primer annealing temperatures were incorrect.
Suggestion: Check the primer melting temperature and adjust the annealing temperature accordingly.
• The amounts of reagents used were incorrect.
Suggestion: Check volumes of reagents added and follow the recommended protocol.
• The integrity of the premix was compromised.
Suggestion: Run the control reaction to verify reagent integrity. • The duration of electrokinetic injection was too short.
Suggestion: Confirm that recommended injection conditions were used. Increase the duration of injection by 50–100%.
• Too much salt was present in the samples.
The ionic strength of the sample was too high. It is critical that the ionic strength of the sample to be injected is low.
Suggestion: Confirm that the recommended salt was used for ethanol precipitation and that a wash step was performed. If sequencing products were prepared using resin-packed plates, confirm that they were eluted in water. Some preparations of size exclusion chromatography media are pre-swollen in a salt-containing buffer, and in many cases, must be washed several times in water to remove the salt. Some data indicate that several washes of dry media should be performed to remove residual ions that interfere with injection. Alternatively, sequencing reaction pellets can be resuspended in water rather than formamide. See guidelines for electrokinetic injection.
20
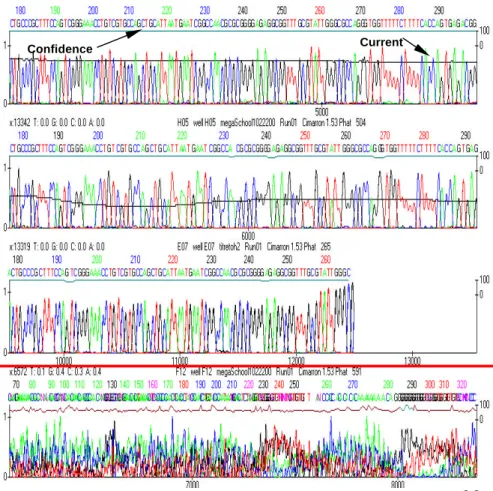
Figure 5.7.Relationship between signal strength and basecalling success. Basecalling was analyzed using
Cimarron 1.53 Slim Phredify software.Left panels show raw data of varying signal strengths. Bracketed regions representing the basecalled region are shown in the right panels. When signal is weak, as in panel A where the signal is < 800 RFU, basecalling fails.As long as the signal is marginal, as in panel B where the signal is near 1 000 RFU, the software can achieve some basecalling success. However, the accuracy is poor, and background is high (note confidence trace). If the background fluorescence is subtracted, the signal is < 600 RFU in both cases. In contrast, strong signal is observed in panel C. The success of basecalling is indicated by the low background and nearly straight confidence trace (panel C: Analyzed data panel).
Raw data Analyzed data
weak marginal good A B C Confidencetrace Did not analyze. Signal too weak
Electrophoresis Artifacts: Overloading of Capillaries
• The appearance of both late starts and loss of resolution in either dye primer or dye
terminator sequencing is the result of capillary overloading in which too much template DNA enters the capillary during electrokinetic injection (Figure 5.8).
The use of too much template DNA in a sequencing reaction results in a phenomenon known as “overloading” (Figure 2.5). When the mass of DNA injected into a capillary is too great, resistance in the capillary increases causing a reduced or sudden drop in the capillary current (Figure 2.6).
Fluctuations in current result in increased variability of resolution and shorter read-lengths (Figure 2.7). This change in current will manifest itself in the late appearance of sequencing data (Figure 5.8 panel C), and poorly resolved sequencing fragments (Figure 5.8 panel D). Note that signals are not necessarily strong in overloaded samples.
Suggestions:
• Reduce the concentration of template in the injected sample by increasing the volume of the resuspended DNA sequencing products by 100–200% and re-inject using the original parameters (Figure 5.9).
• Repeat the injection of these samples for a shorter duration (25–50% shorter), or at a lower injection voltage (25–50% lower voltage).
• Repeat the DNA sequencing reactions with less template DNA. A typical template preparation can be titrated over a 50-fold range (0.2 µl, 0.5 µl, 1 µl, 2 µl, 5 µl, and 11µl, for example) and easily analyzed in a single run with several templates and control DNA.
• Repeat the DNA sequencing reactions after using gel filtration as a clean-up step.
• If injecting from water, evaporate samples to dryness and inject from MegaBACE loading solution.
Note: Overloaded samples frequently have low signals since the peaks are broad and diffuse. It is very common to misdiagnose overloading as samples that have insufficient signal strength and
22
Analyzed data in bracketed regionsRaw data A B C Normal start Current profile
very late start D
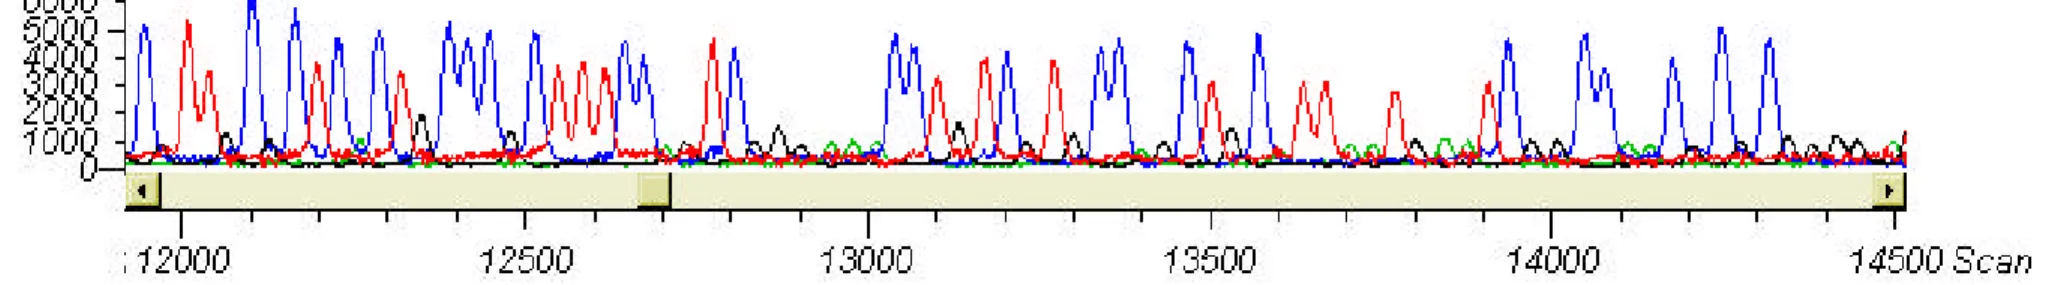
Figure 5.8.Relationship between overloading and basecalling success.Left panels show raw data representing various degrees of overloading. Panel A, normal data; panel B,slightly overloaded; panel C,
moderately overloaded; and panel D,extremely overloaded. Note the late starts and current fluctuations, even in slightly overloaded capillaries. The bracketed regions represent the basecalled region shown in the panels to the right. Even in the case of a moderately overloaded capillary, basecalling is successful and occurs throughout data collection (panel C, 12 500 scan lines). However, due to the low current in this capillary, the equivalent of 260 nucleotides has passed in ~ 12 000 scans. Compare this with the normal capillary (panel A) in which 260
nucleotides pass the detection window in ~ 5 000 scans. Since the resolution observed in the capillary shown in panel C is still good at 12 000 scans, extending the sequencing run time could have generated more called bases.
Current profile
Normal Start
Slightly delayed start
Delayed start
Current Confidence
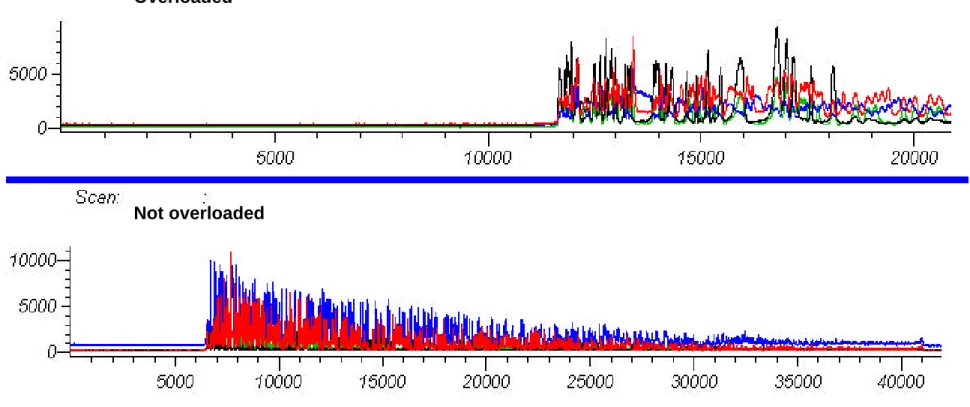
Fig 5.9. Overloading: Reducing the concentration of the sequencing sample. Raw data shown in the first panel are from an overloaded capillary. The sample was dissolved in 20 µl of water and injected at 5 kV for 10 s. Ten microlitersl was removed from this sample and transferred to a new plate. An additional 100 µl of water was added (11-fold dilution), and the sample was injected using the same parameters. Note: The late start and broad peaks are alleviated, and the signal is greater in the diluted sample. Overloading is concentration-dependent and not mass-dependent.
Overloaded
24
Electrophoresis Artifacts: The Accordion Effect
• Dramatic changes in peak spacing are due to fluctuations in capillary current.
Several factors may cause fluctuations in capillary current, including injection of too much DNA into the capillaries, the presence of bubbles in the matrix, or the introduction of salt fronts by injection of the sample. Fluctuations in current will affect the electrophoretic migration rate of the sequencing products, and consequently the band spacing and resolution. This phenomenon is known as the accordion effect. As seen in Figures 5.10–5.13, late starts and truncation of basecalling can occur as the result of this effect.
Suggestions:
• For samples that are almost overloaded, follow the suggestions for correcting overloading.
• Re-inject the sample. Bubbles may form in the LPA matrix either during the filling of capillaries or during electrophoresis.
Normal current profile
Fluctuating current profile
Fluctuating current profile
Figure 5.10. Current fluctuations in raw sequence data. Raw data are compared in the four panels with respect to current profile. Note the anomalous fluctuations in current and their effect on resolution.
MegaBACE M13 standards (~ 200 ng of M13 and 3.0 pmol of primer per 10 µl volume) were resuspended in 70% formamide, 1 mM EDTA and injected into capillaries filled with LPA for 20 s at 10 kV.
26
Figure 5.11. The effect of current fluctuations on raw sequence data. Sequencing products weredissolved in 70% formamide, 1 mM EDTA and injected into capillaries filled with LPA for 20 s at 10 kV. Electrophoresis was conducted at 9 kV for 100 min. Panel A, effect of current fluctuations on raw data; panel B, expanded view of the raw data from panel A. Note the effect on resolution that coincides with changes in current.
A.
B.
Figure 5.12. The effect of current fluctuations on raw sequence data. MegaBACE M13 standards (~ 200 ng of M13 and 1.5 pmol of primer per 10 µl volume) were resuspended in 70% formamide, 1 mM EDTA and injected into capillaries filled with LPA for 20 s at 10 kV.. Note the change in resolution (see arrows) and the late start due to fluctuating or low current.
Loss of resolution due to current fluctuation
Loss of resolution due to current fluctuation Late start due to
28
Fig 5.13. The effect of current fluctuations on analyzed sequence data. MegaBACE M13 standards (~ 200 ngof M13 and 1.5 pmol of primer per 10 µl volume) were resuspended in 70% formamide, 1 mM EDTA and injected into capillaries filled with LPA for 20 s at 10 kV. Changes in current during electrophoresis can affect the analysis of data, as demonstrated in the four panels below. Note the change in band spacing (see arrows), the late start, and the truncation of basecalling due to fluctuating or low capillary current.
Change in band spacing due to current fluctuation
Truncation of analyzed data Late start due to
Dye Terminator Sequencing Artifacts: Dye Blobs without Sequence Data
• Failure to produce sequencing fragmentsindicates a lack of either primer or template DNA in
the sequencing reaction, or a possible loss of activity in the enzyme.
A failed dye terminator sequencing reaction is shown in Figure 5.14.. This is characterized by the absence of peaks corresponding to sequencing products, and large dye artifacts associated with unincorporated dye terminator. The presence of dye blobs distinguishes a failed reaction from a failed injection where no fluorescent material is introduced into the capillary. When a reaction fails, dye blobs tend to generate very strong spikes (> 10 000 counts) and are carried through clean-up. The absence of sequencing products is typical of a sequencing reaction in which the primer was not extended. This can result from a lack of primer, template DNA or polymerase activity. It may also occur if the primer fails to anneal to the template due to incorrect cycling conditions.
Suggestions:
• Estimate the quality and quantity of the template DNA preparation on an agarose gel.
• Verify that primer was added to the sequencing reaction.
• Verify that a proper priming site exists in the DNA to be sequenced.
• Check the thermal cycling program and the primer sequence to establish the correct annealing conditions.
• Verify the integrity of the polymerase by running a sequencing reaction with control template and primer.
30
Figure 5.14. Failure to produce sequencing fragments. A failed dye terminator sequencing reactioncharacterized by the presence of terminator blobs and no sequencing products is shown. In this example, terminator blobs tend to generate very strong spikes (> 10 000 counts) and are carried through clean-up. The absence of sequencing products is typical of a sequencing reaction lacking either primer or template DNA, or polymerase activity.
Strong terminator blobs
Note absence of peaks corresponding to sequencing products
Dye Terminator Sequencing Artifacts: Dye Blobs in the Sequencing Data
• The presence of dye blobs in the sequencing data indicates failure to remove unincorporated dye
terminator during the post-sequencing clean-up.
In Figure 5.15, sequencing reactions were precipitated with ethanol in the absence of salt. Note the appearance of sequencing fragments as well as dye terminator blobs similar to those observed in a failed sequencing reaction (Figure 5.14). If final ethanol concentrations are > 75%, blob artifacts from
unincorporated dye terminator (Figure 2.15) are likely to occur in the sequence data. Unlike slab gel-based sequencing, the realized signal strength does not continue to increase with higher concentrations of ethanol.
Suggestions:
• For ethanol precipitation, add 7.5 M ammonium acetate to a final concentration of 0.75 M, followed by 95% ethanol to a final concentration of 70–75%. Centrifuge at 3 100 x g for 30 min. Wash the pellet once with 70% ethanol.
• If gel filtration columns were used for post-sequencing clean-up, verify that the manufacturer’s instructions for preparing and using the columns were followed correctly.
32
Figure 5.15. Dye blobs in the sequencing data. The presence of dye blobs in the sequencing data indicatesfailure to remove unincorporated dye terminators during the post-sequencing clean-up. Sequencing reactions were precipitated with 9 volumes of ethanol. Note the appearance of sequencing fragments as well as dye terminator blobs similar to those observed in a failed sequencing reaction (Figure 5.14). If final ethanol concentrations are > 75%, blob artifacts from unincorporated dye terminator are likely to occur in the sequence data.
Strong terminator blobs
Small peaks indicating sequencing products
Dye Terminator Sequencing Artifacts: The Cliff Effect
• The cliff effect is a term used to describe a sudden drop in the signal strength of longer sequencing products. It is indicative of a sequencing reaction problem induced by:
• Secondary structure in the template DNA.
• Homopolymer regions in the sequence.
• Too much template DNA in the sequencing reaction.
• Dilution of the premix.
Occasionally, secondary structure can form in template DNA that is stable even at the temperatures used in thermal cycling. This is particularly true for templates with regions of high GC content. DNA polymerases will pause at sites of exceptional secondary structure, fail to correctly incorporate the proper dNTP or dye-labelled ddNTP, and dissociate from the template. As a result, fewer sequencing products are produced beyond the region of secondary structure. These regions are commonly known as “STOPs” in the sequence. In dye terminator sequencing, a STOP manifests itself as a sudden reduction in raw data signal strength (Figure 5.16).
Suggestions:
• Increase the length of the extension step to 2–4 min. • Increase the number of cycles.
• Increase the extension temperature to 65 °C. This may help to melt secondary structure in the template. Note: Extension temperatures higher than 65 °C will compromise the activity of the enzyme and results will be sub-optimal.
34
Dye Terminator Sequencing Artifacts: The Cliff Effect (
continued
)
When sequencing PCR products, using too much DNA or sequencing primer, or sequencing through a homopolymer region can exhaust the supply of nucleotides, resulting in the sequence suddenly fading early (Figure 5.16). This is also prevalent if the ET terminator premix is diluted, or if DNA sequencing is performed in volumes < 10 µl. Reducing the molar amount of nucleotide without a proportional decrease in the amount of template DNA and primer will result in premature exhaustion of nucleotide. Dilution of the premix is not recommended since it will result in reduced performance (Figure 5.17). The volume of the sequencing reaction can be reduced as long as primer and template DNA are reduced accordingly. However, with 96-well plates, greater consistency will be achieved when using 8 µl of ET terminator premix in a 20 µl sequencing reaction as directed by the protocol.
Suggestions:
• Use the recommended amount of dye terminator premix.
• Use < 0.1 pmol of template DNA (20–80 fmol of template DNA is recommended).
• Use less primer (5 pmol is recommended) for each sequence. When sequencing extremely large templates such as BACs, it may be advantageous to increase the amount of primer to 20 pmol. Exceeding 20 pmol has no benefit.
Figure 5.16. The cliff effect. Occasionally, when sequencing through homopolymer regions, nucleotides in the reaction can be exhausted prematurely. This manifests as a sudden reduction in signal strength. Note the high T content in the region indicated by the arrow. The dsDNA sequencing product was generated with the
DYEnamic ET Terminator Kit for MegaBACE, using 4 µl of template DNA and 10 pmol of M13 (-40) primer.
Raw data: baseline subtracted
Raw data: baseline subtracted
[T] [G] [C] [A]
Probable location of STOP
36
Figure 5.17. The cliff effect. Diluting the ET terminator premix will eventually exhaust the supply ofnucleotides available in the sequencing reaction and cause the sequence to suddenly fade. Double-stranded DNA sequencing products were generated with the DYEnamic ET Terminator Kit for
MegaBACE using 200 ng of M13mp18 DNA and 5 pmol of M13 (-40) primer. Panel A shows a raw data trace obtained with premix used at full strength (8 µl of premix in a 20 µl reaction). Panel B shows a raw data trace obtained with one-fourth the amount of premix (2 µl of premix in a 20 µl reaction). Note the difference in overall signal intensity and the failure to generate sufficient quantities of longer sequencing fragments (panel B).
A.
B.
8 µµl of premix
2 µµl of premix
Signal strength AFU
Signal strength AFU
Dye Terminator Sequencing Artifacts: Amplification Artifacts
• The presence of very strong peaks in the initial 10–20 bases of sequencing data frequently
corresponds to artifacts of amplification created by spurious annealing of primer.
In some cases, if excess primer is used, it can spuriously anneal at alternative sites in the template, or it may form primer dimers. Occurrences such as these manifest themselves as shown in Figure 5.18. In this example, the primer to template DNA ratio was > 300:1 (25 pmol of primer and 0.06 pmol of
template), and the combination of excess primer and annealing conditions promoted primer
self-annealing. The resulting amplification artifacts appear early in the sequence. The analysis software was unable to basecall these data because the large artifact peaks prevented proper spectral separation. Similar sequencing reactions using 5 and 10 pmol of primer did not show these artifacts (data not shown). These artifacts should not be confused with dye blobs resulting from ineffective removal of unincorporated dye terminators. Dye blob artifacts occur in multiple areas and are not well-formed peaks. See Figure 5.16 for an example of dye blobs. Note that in Figure 5.18, the artifacts appear as relatively well-formed peaks consistent with short labelled fragments of DNA produced by the formation of primer dimers.
Suggestions:
• Verify that the primer does not have the ability to self-anneal and form primer dimers.
• Keep the ratio of primer to template DNA ≤100:1.
• Use less primer (5 pmol is recommended) for each sequence.
38
Sequencing artifact (magnified view)Sequencing artifact
Figure 5.18.Amplification artifacts. The combination of excess primer and annealing conditions promoted
the formation of primer dimers resulting in amplification artifacts that appear early in the sequence. Note: This
data could not be analyzed. Raw ET terminator sequence data was generated using 20 pmol of primer and 0.06 pmol of template DNA and cycling conditions described in the DYEnamic ET Terminator protocol.
Dye Terminator Sequencing Artifacts: Split peaks or “A” Tailing
• The appearance of split peaks is indicative of a spectral separation failure that is often due to low signal strength and an instrument that may be out-of- focus.
When analyzing data with low signal strength, the MegaBACE analysis software has a more difficult time performing correct spectral separation, and occasionally will split one peak into two. In the example presented in Figure 5.19, the software inserts an “A” peak after a “T” peak. This is referred to as “A” tailing. The raw data are characterized by low signal and rough, poorly resolved peaks. A MegaBACE instrument that is in optimal working condition will basecall quite accurately even in situations where the raw data signal is weak (Figure 5.20). Note that despite the weak signal in this data, the peaks are still well-resolved and relatively smooth. Therefore, the “A” tailing shown in Figure 5.19 may be more symptomatic of an instrument that is not focused properly.
Suggestions:
• Verify that the instrument is correctly focused and is in otherwise good working order.
• Verify that PMTs are balanced.
• Check the sequencing reaction conditions. Consider increasing the amounts of primer and/or template.
40
Figure 5.19. Split peaks or “A” tailing: Spectral separation failure. The appearance of split peaks isindicative of a spectral separation failure that is often due to low signal strength and an instrument that may be out-of-focus. Sequencing was performed using the DYEnamic ET terminators. Samples were injected at 3 kV for 50 s. Arrows indicate regions where peak splitting occurred.
Raw data
Baseline subtracted data
Analyzed data
Figure 5.20. Weak signal with correct spectral separation. Raw and analyzed data from a sample with very low signal strength are shown. In spite of weak signal, note the correct spectral separation, the sharpness of the peaks, and the accurate basecalling, as well as the absence of peak splitting. This instrument was known to be in perfect focus. Sequencing was performed using the DYEnamic ET terminators. Samples were injected at 2 kV for 75 s.
Raw data
Baseline Subtracted data
Analyzed data
42
Dye Terminator Sequencing Artifacts: PCR Product Sequencing
PCR products are very good templates for sequencing on MegaBACE. Because of their small size relative to larger templates such as plasmids, overloading of capillaries during electrokinetic injection is less likely. However, the amount of PCR product template used in sequencing remains an important consideration. As shown in Figure 5.17, the use of too much PCR product can exhaust the supply of ddNTPs and cause the signal strength to fade prematurely. The amount of template DNA needed for sequencing depends on the size of the PCR product. In general, the following are guidelines for the amount of template DNA to use: • For PCR products ≥ 1 000 base pairs, use 10–100 ng as a starting point.
• For PCR products ≤ 1 000 base pairs, use 5-50 ng as a starting point.
To avoid amplification artifacts, unused primer and nucleotides should be removed from PCR products prior to sequencing. This can be accomplished enzymatically using Exonuclease I and Shrimp Alkaline
Phoshatase, or by a variety of other commercially available methods. Though not recommended, pre-sequencing clean-up is not always necessary if the PCR is formulated to efficiently use the majority of the primers. The use of 0.01–0.05 pmol of PCR product with a large excess of sequencing primer (10 pmol) can sufficiently overwhelm any residual PCR primer and produce good sequencing results.
Dye Terminator Sequencing Artifacts: PCR Product Sequencing
• A loss of resolution in PCR product sequencing data is caused by over-injection of sequencing
fragments. This occurs when too much PCR template is used in the sequencing reaction.
As described earlier in Figure 5.9, overloading typically occurs when too much template DNA enters the capillary during electrokinetic injection and manifests asa late appearance of raw data and a loss of resolution. This results from a reduction in capillary current, and is common when sequencing large DNA templates, such as plasmids. When relatively small templates such as PCR products are sequenced, a loss of resolution is generally due to injection of too many sequencing products (Figure 5.21 and 5.22). This differs from previous examples of overloading in the following ways:
• There is no delay in the start of raw data. • Current through the capillary is not decreased.
• Very high signal strength with intensities of 30 000 rfu or greater is not uncommon.
Suggestions:
• Reduce the concentration of template in the injected sample by increasing the volume of the
resuspended DNA sequencing products by 100–200%. Re-inject using the original parameters (Figure 5.9).
• Repeat the injection of these samples for a shorter duration (25–50% shorter) or lower injection voltage (25–50% lower). See Figure 5.21 and 5.22.
• Repeat the DNA sequencing reactions with less template DNA.
44
Figure 5.21. Over-injection of PCR sequencing products. Sequencing reactions were performed usingthe DYEnamic ET Terminator Kit for MegaBACE with 20 ng of a 400 base-pair PCR product and 5 pmo of T3 primer. Sequencing reactions were cycled 30 times (96 °C for 10 s, 50 °C for 15 s, 60 °C for 60 s). The
sequencing products were purified by column filtration. Samples were injected as described below, and electrophoresis was conducted at 9 kV for 100 min. Note the very high signal strength and a loss of resolution that are characteristic of over-injection.
Same raw data start point
Injection: 2 kV 80 seconds
Fig 5.22. Over-injection of PCR sequencing products. Magnified view of the data from Figure 5.21 (see for details). Note the poor resolution and increased signal strength (Arrow A) and the improvement in resolution with decreased injection time (Arrow B).
A
B
Injection: 2 kV 80 seconds
46
Dye Terminator Sequencing Artifacts: PCR Product Sequencing
• Failure of the MegaBACE Sequence Analyzer to properly call bases when sequencing very short
PCR products can be due to the presence of dye blobs in the sequence data that prevent proper spectral separation.
The MegaBACE analysis software identifies each of the four fluorescent dyes used to label DNA
sequencing products by creating a spectral separation matrix. Approximately 100–200 bases of clean raw data are required to perform spectral separation and correctly assign base identification. Figure 5.23 shows raw data from short PCR sequences (~ 100–120 base) that MegaBACE Sequence Analyzer could not basecall with version 2.12 basecaller or less. In this case, failure to remove all of the unincorporated dye terminator from the sequencing sample resulted in the appearance of dye blobs in the sequence data and prevented proper spectral separation.
Suggestions:
• When purifying sequencing products by ethanol precipitation, a final concentration of 0.75 M ammonium acetate and 70% ethanol should be used. This should be followed by a 70% ethanol wash (see Figures 2.13, 2.14 and 2.15).
• Purify the sequencing products using gel filtration columns. For example, the AutoSeq™96 Spin Plate (Figure 2.16) uses a combination of chromatographic separation medium (Sephadex™ G-50), PVDF membrane, and centrifugation in a 96-well format to remove excess salts and unincorporated fluorescent ddNTPs.
• Repeat the DNA sequencing reactions with more template DNA (PCR product). This will reduce the chance of dye blobs through more efficient use of dye terminator and higher signal strength.
Figure 5.23. Failure to sequence short PCR products. Raw sequencing data from short PCR products (~ 100–120 base) are shown. Sequencing was performed according to the DYEnamic ET terminator protocol with ~ 5 pmol of primer and 10 ng of template DNA. The reaction products were purified by ethanol precipitation. The MegaBACE Sequence Analyzer was unable to basecall the data in either of the two traces below. Note the presence of dye blobs (see arrows). Failure to remove
unincorporated dye terminators from the sequencing sample resulted in the appearance of dye blobs in the sequence data and prevented proper spectral separation.
Dye blobs
48
Dye Primer Sequencing Artifacts: Primer Peak without Sequencing Data
• Failure to produce sequencing fragments after a dye primer peakindicates a problem in the
sequencing reaction.
In dye primer sequencing data, the presence of a large primer peak without sequencing data is indicative of the successful injection of a failed sequencing reaction (Figure 5.24). Failure to produce sequencing products occurs when:
• The sequencing reaction lacks template DNA.
• The primer has no annealing site in the template.
• Nucleotide or enzyme has not been added properly.
• The enzyme is inactive.
Suggestions:
• Estimate the quality and quantity of the template DNA preparation on an agarose gel.
• Verify that primer was added to the sequencing reaction.
• Verify that a proper priming site exists in the DNA to be sequenced.
• Verify the integrity of the polymerase by running a sequencing reaction with the control template and primer.
Figure 5.24. Failed sequencing reaction: Primer peak without sequencing data. Raw data traces are shown in which a large primer peak is visible with no evidence of sequencing products. This can occur when the sequencing reaction lacks template DNA, the primer has no annealing site on the template DNA, the enzyme has no activity, or when nucleotide has not been added. In this example, sequencing reactions were performed with the MegaBACE -28 rev 2 primer on a template that had an annealing site for the -28 rev 1 primer.
Raw data
Raw data (magnified view)
Note absence of peaks corresponding to sequencing products
50
Dye Primer Sequencing Artifacts: Sequencing Data that is Missing a Base
• A missing base is often due to an error in preparation of the sequencing reaction.
Since dye primer sequencing requires the manipulation of four termination reactions, there is an
increased opportunity for the introduction of error during sample processing. If the signal (color) in one or more of the channels is weak or non-existent (Figure 5.25), it is usually the result of:
• A failure to combine and mix the reagents properly.
• A failure to include the primer.
• A loss of sequencing products during pooling of the termination reactions.
The MegaBACE software needs four unique peaks to correctly form a spectral separation matrix and analyze the data. If there are not four unique peaks in a dye primer reaction, it is usually the result of a pooling error.
Suggestions:
• Verify that all reaction components—primer, buffer, nucleotide, enzyme, and template DNA—have been added to all termination reactions.
• Verify that proper technique is being used when pooling and precipitating DNA sequencing products.
• Occasionally, a missing base can result from incorrect configuration of the filters and beam-splitters.
The correct combination of beam-splitters and band pass filters is critical. See Chapter 6,
Instrumentation and Detection for a more detailed explanation. If a beam-splitter or a filter is placed in the incorrect orientation, it will prevent the accurate collection of fluorescent signal. This type of error can manifest as a reduction or elimination of a base from the data.
Suggestions:
Figure 5.25. A failed sequencing reaction due to a missing base. For the dye primer sequencing reaction shown (raw data), the analysis software was unable to determine the sequence. In this example, the inability to basecall the data was due to the missing G reaction. The MegaBACE Sequence Analyzer needs four unique peaks in order to form a spectral separation matrix correctly and to basecall. The absence of four unique peaks in a dye primer reaction is usually the result of a pooling error. This type of error can also be caused by a failure to include the primer or the termination mix in a reaction, or to an incorrect instrument configuration.
52
Dye Primer Sequencing Artifacts: Compressions
• Compressions in the sequencing data result from anomalous migration of DNA sequencing
products during electrophoresis.
Some DNA sequences, especially those with dyad symmetries containing dG and dC residues, are not fully denatured during electrophoresis. When this occurs, the regular pattern of migration of DNA fragments is interrupted; peaks are spaced closer than normal (compressed together), and just beyond the compression, they are farther apart than normal. In such cases, sequence information is lost. This is demonstrated in Figure 5.26. Many of these gel artifacts can be eliminated by substituting 7-deaza-dGTP, a nucleotide analog that forms weaker secondary structure, for dGTP (14, 15).
For templates with strong compressions, 7-deaza-dGTP will not provide complete resolution (Figure 5.27). In these cases, compressions can be resolved by using dITP as a substitute for dGTP. The DYEnamic ET terminator reagents use a combination of dITP and Thermo Sequenase II DNA polymerase to resolve all compressions.
Suggestions:
• To resolve minor compressions in dye primer sequencing, use 7-deaza-dGTP nucleotide termination mixes.
• For resolution of strong compressions, use the DYEnamic ET Terminator Sequencing Kit for MegaBACE.
Figure 5.26. Mild compressions. DNA sequencing results generated using a CpG Island dPCR Clone (Incyte Pharmaceuticals, Inc.). A region with a mild compression is shown (see arrow) that 7-deaza-dGTP is able to resolve in dye primer sequencing.
7-deaza-dGTP Dye Primer dGTP Dye Primer
54
Figure 5.27. Strong compressions. DNA sequencing results generated using a CpG Island dPCR Clone(Incyte Pharmaceuticals, Inc.). A region with a strong compression is shown (see arrow) that 7-deaza-dGTP is unable to resolve in dye primer sequencing. Note that the compression is resolved in dITP sequences
performed with dye primer or dye terminator.
dGTP Dye Primer
7-deaza-dGTP Dye Primer
Dye Primer Sequencing Artifacts: Amplification
Artifacts
• The appearance of very large, broad, four-color peaks are frequently the result of amplification of non-template DNA that occurs during cycling.
In some cases, the presence of excess primer or contaminating DNA can lead to spurious annealing of primer resulting in anomalous amplification of DNA. This is often similar to the formation of primer dimers and other artifact bands that can occur in PCR experiments. In dye primer sequencing, anomalous amplification products are labelled with fluorescent dye. They are distinguishable from STOPs in the sequence primarily by their magnitude (frequently off-scale) and by the fact that they can extend over many bases.
Figure 5.28 shows sequencing data with a large, anomalous peak near the beginning of the trace. All four colors are present in this peak, indicating that whatever is occurring is not unique to a particular termination reaction or dye. This type of artifact can be caused by the spurious annealing of primer to alternative sites on the template DNA, or on a contaminating species of DNA carried over (e.g. host bacterial DNA). Under such conditions, PCR occurs during the cycle sequencing reaction. Since the primers are labelled, the fragment created by PCR shows up in the raw data as a large, intense four-color peak.
Suggestions:
• Use more stringent annealing conditions when cycling. For example, increasing the annealing temperature from 50 °C to 55–57 °C is often effective.
• Use fewer total cycles. Generally, 20–30 cycles are sufficient for effective generation of sequencing products. Increasing the number of cycles beyond this range may encourage the formation of cycling artifacts.
• In some cases, reducing the concentration of primer is at least partially effective.
56
Figure 5.28. Amplificationartifacts in dye primer cycle sequencing reactions. Data with a large,anomalous peak near the beginning of the trace are shown. All four colors are present in this peak,
indicating that whatever is occurring is not unique to a particular termination reaction or dye. These peaks represent artifacts of amplification that have occurred during the cycle sequencing reaction. In this example, the artifact was the result of spurious annealing of dye-labelled primer to alternative sites within a
contaminating species of DNA (E.coli). Under such conditions, PCR occurs during the cycle sequencing reaction. Since the primers are labelled, the fragment created by PCR shows up in the raw data as a large, intense four-color peak.
Raw data
Raw data (magnified view)
Amplification Artifact
Amplification Artifact
Analyzed data
Note that base calling begins after the amplification artifact
Dye Primer Sequencing Artifacts: PCR Product Sequencing
• Artifacts in dye primer sequencing of PCR products can be induced by failure to properly purify
the PCR products.
A comparison of PCR product sequencing with and without treatment with Exonuclease I (Exo I) and Shrimp Alkaline Phosphatase (SAP) is shown in Figure 5.29A and Figure 5.29B. This method of template preparation relies on the enzymatic degradation of excess PCR primers (Exo I) and excess nucleotide (SAP). If primers used during PCR are not completely degraded, a population of unlabelled primers will exist in the sequencing reaction. As shown in Figure 5.29A, a small amount of unlabelled primer, coupled with a large amount of dye-labelled primer, resulted in the production of an
amplification artifact during cycling. This new artifact PCR product serves as template for the labelled primer and results in a large number of labelled DNA fragments terminating within the sequence at ~ 170–180 bases.
Suggestions:
• Use a smaller amount of the PCR preparation for the Exo I and SAP treatment. • Follow the protocol for the use of Exo I and SAP.
58
PCR product Exo/SAP treatedPCR product not treated
Amplification Artifact Amplification Artifact
Figure 5.29A. Amplificationartifacts in dye primer cycle sequencing reactions. A comparison of PCR product sequencing with and without treatment using Exonuclease I (Exo) and Shrimp Alkaline Phosphatase (SAP). If primers used during PCR are not degraded, a population of unlabelled primers will exist in the sequencing reaction. In the example shown below, a small amount of unlabelled primer, coupled with a large amount of dye-labelled primer, resulted in the production of an amplification artifact during cycling. This new artifact PCR product serves as template for the labelled primer and results in a large number of labelled DNA fragments terminating within the sequence at ~ 170–180 bases.
PCR product Exo/SAP treated
PCR product not treated
Region of poor resolution due to amplification artifact
Region of poor resolution due to amplification artifact
Figure 5.29B. Amplificationartifacts in dye primer cycle sequencing reactions. A comparison of PCR product sequencing with and without treatment with Exonuclease I (Exo) and Shrimp Alkaline Phosphatase (SAP). Analyzed data from the region surrounding the amplification artifact are shown.