1 GSI Helmholtzzentrum fr Schwerionenforschung, Darmstadt, Germany
2 TU Darmstadt, Darmstadt, Germany
Abstract
Some developments of Super-FRS focal plane detector prototypes and results of recent in-beam tests performed at GSI and LNS-INFN with diamond detectors are presented.
1
Introduction
Figure 1: Layout of the Super-FRS.
this has strong implication on the design of the Super-FRS detecting sys-tem, which has to cope with two main technical challenges: high intensity and resolution.
2
Super-FRS radiation-hard detectors
2.1 Tracking detectors
The identification of different isotopes at the Super-FRS requires a combined event-by-event analysis of the magnetic rigidity (Bρ), time-of-flight (ToF) and energy deposition [3]. Toward the higher beam intensity we plan to use a set of Time Projection Chambers (TPC) with GEM (Gas Electron Multi-plier) amplification. In addition to high resolution and adjustable gain over a wide range (from protons to Z=92), these detectors have the advantage of being able to perform particle tracking on an event-by-event basis expos-ing very little additional material to the ion beam. Considerable progress has been made in the past years in the development of GEM-TPC track-ing detector prototypes [4] for the Super-FRS. Even though gas detectors are very robust against beam bombardment, they are too slow for timing measurements.
2.2 Time-of-flight detectors
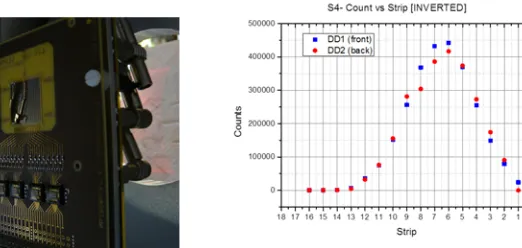
Figure 2: Left panel: PADI7 board with strip diamond detectors (front and back) Right panel: Horizontal beam profile reconstructed on diamonds.
based on diamond material. We have developed position-sensitive diamond detectors made of polycrystalline CVD (chemical vapour deposition) ma-terial of (20x20x0.3) mm3 size provided by Element Six. Their electrodes were fabricated in house in 16-strips geometry by depositing on both sides of the diamond samples Cr/Au layers of thickness 50/100 nm respectively. The vertical geometry was chosen to match the horizontal dispersion of the separator. The device was mounted on a new board (see Fig. 2) having bias voltages, threshold and integrated amplification stage and able to provide LVDS output signals.
3
Beam tests measurements
3.1 ToF measurements
In August 2014, a test experiment was performed at the FRS [5] in GSI with197Au primary beam using a diamond pair as start and stop detectors, in experimental condition similar to those expected at the Super-FRS. A printed circuit board equipped with four PADI7 chips [6] and fabricated in house was used to readout each single diamond strip. The digital output signals from PADI after splitting were sent to the FPGA TDC VFTXs
[7] synchronized with a 200 MHz external clock 1. An example of beam
profile reconstructed with two diamond detectors DD1 and DD2 located
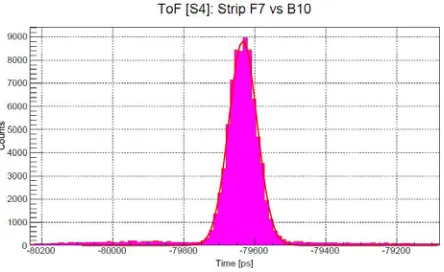
at the end of the FRS is shown in Fig. 2. A ToF resolution σT oF of
about 40 ps has been measured between two strips of the front and back diamonds (see Fig. 3). A ToF resolution of about 50 ps was measured
Figure 3: Diamond ToF measurement.
after positioning the DD2 detector at the mid-focal plane of the separator, about 35 m apart. The intrinsic time resolution of each diamond could be extracted taking advantage of the presence of the FRS TPC detectors [9] and plastics scintillator mounted along the beam line. After applying a TPC position correction, an intrinsic resolutionσt=σT oF/√2≈25 ps is achieved.
3.2 Irradiation tests
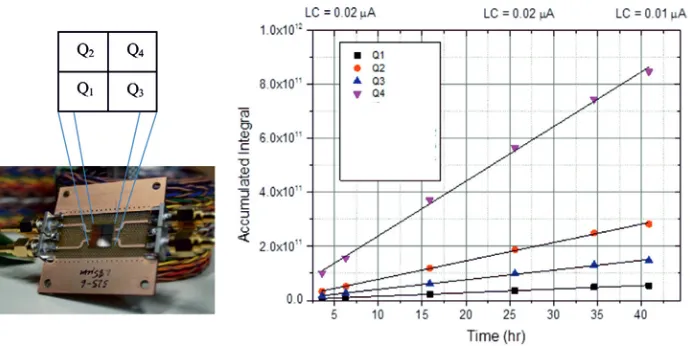
se-Figure 4: Left panel: pcCVD-DD with four squared faces Q1−4. Right panel: Count numbers measured by each face of the pcCVD-DD during the irradiation measurement.
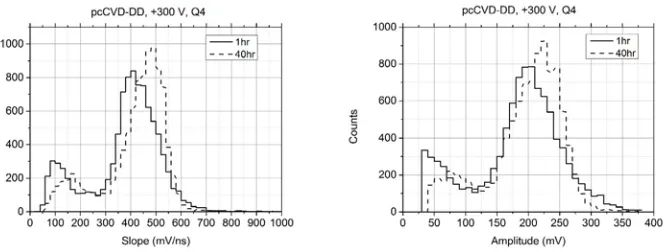
ries is shown in Fig. 4. Their sum provides a minimum accumulated dose of about 1.7 MGy corresponding to 4.3x10⁹ 238U/mm2 s at 350 MeV/u (≈400 days operation of Super-FRS). Detector efficiency corrections will be taken into account to estimate the final accumulated dose. In Fig. 5 the slope (left side) and the amplitude (right side) distributions of Q4 signals mea-sured after 1 hour and 40 hours of irradiation are shown. Pulses below 30 mV have been discarded. The slope distribution was obtained by a linear fit of the sampled waveform at 10-90% of the maximum amplitude. From the present results, no degradation of the pcCVD-DD signal is observed within the 500 ps resolution (due to the DBA use). Preliminary results on the ToF
measured between the scCVD-DD and Q4 pcCVD-DD showing no change
in the time resolution are also encouraging.
4
Future developments
Figure 5: Pulse slope (left panel) and amplitude (right panel) of pcCVD diamond detector after 1 hour and 40 hours of irradiation.
only further irradiation tests with uranium ions will be performed but time measurements based via high precision time distribution and time stamps.
Acknowledgments
The authors wish to acknowledge the support of: M. Ciobanu, J. Fr¨uhauf and N. Kurz in providing the PADI and VFTX electronics, M. Tr¨ager and R. Visinka for detector processing, A. Kratz, P. Figuera, A. Musumarra and S. Salamone during the experiment at LNS-INFN.
References
[1] M. Winkler et al., Nucl. Instr. and Meth. B 266 (2008) 4183.
[2] J. ¨Ayst¨o et al., JPS Conf. Proc. 6, 020035 (2015).
[3] C. Nociforo, 2014 JINST 9 C01022.
[4] F. Garcia et al., GSI Report 2014, in press.
[5] H. Geissel et al., Nucl. Instr. and Meth. B 70 (1992) 286.
[6] M. Ciobanu et al., IEEE T-NS 61 (2014) 1015.
[7] E. Bayer and M. Traxler, IEEE T-NS 58 (2011) 1547.
[8] P. Moritz et al., Diamond and Related Materials 10 (2001) 1765.