Clinical Ophthalmology
Dove
press
O r i g i n a l r e s e a r C h
open access to scientific and medical research
Open access Full Text article
Thin minimal rim width at Bruch’s membrane
opening is associated with glaucomatous
paracentral visual field loss
elise V Taniguchi1–3
eleftherios i Paschalis1,2
Dejiao li1,4
Kouros nouri-Mahdavi5
stacey C Brauner1
scott h greenstein1
angela V Turalba1
Janey l Wiggs1
louis r Pasquale1,6
lucy Q shen1
1Department of Ophthalmology,
harvard Medical school,
Massachusetts eye and ear, Boston, Ma, 2Boston Keratoprosthesis
laboratory, Massachusetts eye and ear – schepens eye research institute, harvard Medical school, Boston, Ma, Usa; 3Department of Ophthalmology,
Universidade Federal de são Paulo, são Paulo, Brazil; 4Department of
Ophthalmology, Beijing China-Japan Friendship hospital, Beijing, People’s republic of China; 5Department of
Ophthalmology, David geffen school of Medicine and stein eye institute, los angeles, Ca, Usa; 6Channing
Division of network Medicine, Department of Medicine, Brigham and Women’s hospital, harvard Medical school, Boston, Ma, Usa
Purpose: To compare optic nerve head (ONH) measurements in glaucomatous eyes with paracentral visual field (VF) loss to eyes with peripheral VF loss and controls.
Methods: Open-angle glaucoma (OAG) patients with early paracentral VF loss or isolated peripheral VF loss as well as control subjects underwent ONH imaging with swept-source optical coherence tomography (OCT) and retinal nerve fiber layer (RNFL) imaging with spectral-domain OCT. Minimum rim width at Bruch’s membrane opening (BMO-MRW), lamina cribrosa depth (LCD), and RNFL thickness were compared among the glaucoma and control groups with one-way analysis of variance, Kruskal–Wallis test, and multiple regres-sion analysis.
Results: Twenty-nine eyes from 29 OAG patients (15 early paracentral and 14 isolated peripheral VF loss) and 20 eyes of 20 control subjects were included. The early paracentral and isolated peripheral VF loss groups had similar VF mean deviation (MD) (-5.3±2.7 dB and -3.7±3.0 dB,
p=0.15, respectively). Global BMO-MRW was lower in OAG eyes than in controls (193.8±40.0 vs 322.7±62.2 μm, p,0.001), but similar between eyes with early paracentral VF loss and those with isolated peripheral VF loss (187.6±43.4 vs 200.6±36.3 μm; p.0.99). In contrast, the minimal BMO-MRW was lower in eyes with early paracentral loss (69.0±33.6 μm) than in eyes with isolated peripheral loss (107.7±40.2 μm; p=0.03) or control eyes (200.1±40.8 μm;
p,0.001). Average and thinnest RNFL thickness did not differ between OAG groups (p=0.61 and 0.19, respectively). Horizontal and vertical LCD did not differ among the OAG groups and controls (p=0.80 and 0.82, respectively). Multivariable linear regression analysis among OAG cases confirmed the association between lower minimal BMO-MRW and early paracentral VF loss (β=-38.3 μm; 95% confidence interval, -69.8 to -6.8 μm; p=0.02) after adjusting for age, gender, MD, and disc size.
Conclusion: Thin minimal BMO-MRW may represent a new structural biomarker associated with early glaucomatous paracentral VF loss.
Keywords: paracentral loss, BMO-MRW, open angle glaucoma, optic nerve damage, swept-source OCT
Introduction
Glaucoma is a heterogeneous group of disorders characterized by progressive degeneration of retinal ganglion cells and their axons, leading to cupping of the optic nerve head (ONH) with various patterns of visual field (VF) loss.1,2 Functionally,
patients with paracentral VF loss can have significant decline in quality of life3 and
delayed reaction, while patients with peripheral VF loss increase visual scanning to
compensate when driving.4
Correspondence: lucy Q shen Department of Ophthalmology, harvard Medical school, Massachusetts eye and ear, 243 Charles st, Boston, Ma 02114, Usa
Tel +1 617 573 3569 Fax +1 617 573 3707
email [email protected]
Journal name: Clinical Ophthalmology Article Designation: Original Research Year: 2017
Volume: 11
Running head verso: Taniguchi et al
Running head recto: Optic nerve measurement associated with paracentral loss DOI: http://dx.doi.org/10.2147/OPTH.S149300
Clinical Ophthalmology downloaded from https://www.dovepress.com/ by 118.70.13.36 on 21-Aug-2020
For personal use only.
Dovepress
Taniguchi et al
Clinically, the optic nerve in patients with paracentral VF loss tends to show localized damage, consisting of disc hemorrhage,5 focal narrowing of the rim,6 and acquired optic
nerve pits.7 The structural damage associated with paracentral
VF loss has been quantified with spectral-domain optical coherence tomography (SD-OCT), which showed local-ized loss of retinal nerve fiber layer (RNFL) thickness and thinning of macular inner retinal layer compared to eyes with peripheral VF loss.8
Swept-source optical coherence tomography (SS-OCT) is a novel imaging technology, with higher scanning speed, longer wavelength, and improved signal detection than SD-OCT, achieving better simultaneous imaging of both super-ficial and deep tissue structures.9 These features improve
visualization and quantification of localized and subtle glaucomatous changes of the ONH.
Novel quantitative parameters have emerged with improved imaging technologies. The minimum rim width at Bruch’s membrane opening (BMO-MRW), defined as the minimal distance between the termination of BMO and the internal limiting membrane within each radial scan of the ONH,10 provides a surrogate measure for the number
of axons entering the ONH.11 Associations between
BMO-MRW and VF sensitivity were demonstrated to be stronger than other RNFL and ONH parameters,12 particularly in the
later stages of glaucoma.13 Another new parameter is the
lamina cribrosa depth (LCD), which describes the posterior displacement of the lamina cribrosa (LC) and is defined as the average distance between a reference line connecting the two termination points of Bruch’s membrane at the ONH and the anterior LC surface.14 Greater LCD was found in glaucoma
patients compared to control subjects, and this parameter may vary in different optic disc phenotypes of open-angle glaucoma (OAG).15,16
In this study, we used SS-OCT to measure and compare the prelaminar and laminar ONH tissues in eyes with OAG and control eyes, aiming to identify novel quantitative parameters (biomarkers) associated with glaucomatous paracentral VF loss.
Subjects and methods
This was a prospective, cross-sectional study, approved by the Institutional Review Boards of Massachusetts Eye and Ear (MEE) in accordance with Health Insurance Portability and Accountability Act regulations, and it adhered to the tenets of the Declaration of Helsinki. Each study subject provided written informed consent.
Description of the study sample
Adult patients of European and African descent aged between 30 and 90 years were recruited for this study. Some subjects were part of a prior study by this group comparing SS-OCT and EDI-OCT in measuring quantitative parameters of
the ONH.17
Definition of OAG and control groups
Patients with OAG were recruited from the Glaucoma Con-sultation Service of MEE. These patients had best-corrected visual acuity of at least 20/40, open angles on gonioscopy, a clinical diagnosis of OAG with reproducible VF loss, and corresponding glaucomatous optic nerve damage. Only patients with reliable Humphrey visual field (HVF) tests (fixation loss #33%, false-positive rate #20% and false-negative rate #20%) were included. Patients with previous penetrating glaucoma surgeries (trabeculectomies and glau-coma drainage devices), optic disc torsion more than 15°, ortilt ratio .1.3 (maximum to minimum optic disc diameter)
were excluded.18,19
For each OAG patient, the HVF (Swedish Interactive Threshold Algorithm standard, 24-2) dated within 1 year of the imaging date was reviewed independently by two glaucoma specialists (LRP and LQS) and classified into two categories, as described previously20 and outlined briefly
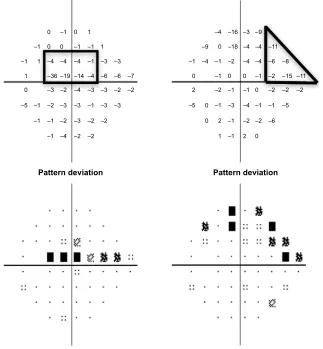
here. Each defect comprised of a cluster of three or more contiguous points on the pattern deviation plot with reti-nal sensitivity depression worse than -5 dB at each point (Figure 1). Early paracentral loss was defined as a VF defect located within the central 10°, either in the superior or in the inferior hemifield, with or without involvement of the peripheral region in the same hemifield. An isolated periph-eral loss involved the Bjerrum areas, nasal step, or temporal wedge zones in the superior and/or inferior hemifield, without affecting the central 10°.
Control subjects were recruited from the Comprehen-sive Ophthalmology and Cataract Consultation Service of MEE and were age-matched to OAG cases by decade. The control eyes had best corrected visual acuity of at least 20/40, intraocular pressure (IOP) lower than 22 mmHg, and normal optic nerves (defined as cup-to-disc ratio #0.6 in both eyes and cup-to-disc ratio asymmetry ,0.2). Patients with family history of glaucoma, any evidence or suspicion of glaucoma (such as abnormality on peripapillary RNFL profile on SD-OCT), ocular hypertension, or significant retinal pathology were excluded. Control subjects did not undergo VF testing.
Clinical Ophthalmology downloaded from https://www.dovepress.com/ by 118.70.13.36 on 21-Aug-2020
Dovepress Optic nerve measurement associated with paracentral loss
image acquisition
The eyes of all subjects were dilated to obtain images with the best quality. A commercially available SS-OCT (Deep Range Imaging OCT-1; Topcon, Tokyo, Japan) was used to image both eyes of all subjects. The device uses a wavelength-sweep-ing laser, with a center wavelength of 1,050 nm, and acquires 100,000 A-scans/sec with 8 μm axial resolution.21,22 The
imaging protocol included a radial B-scan pattern, consisting of 12 sequential sections, and a five-line cross B-scan pat-tern, consisting of five sequential vertical and five sequential horizontal sections spaced 250 μm apart, all centered on the optic disc. Each image has 32 image frames averaged. At the same visit, peripapillary RNFL thickness was obtained with SD-OCT (Spectralis; Heidelberg Engineering, Heidelberg, Germany). Digital disc photographs (Visucam Pro NM; Carl Zeiss, Meditec, Dublin, CA, USA) were taken in subjects who did not have photos within 12 months of OCT imaging.
imaging analysis
Two observers (EVT and DL) independently performed mea-surements of quantitative prelaminar and laminar parameters using customized ImageJ (ImageJ, US National Institutes of Health, Bethesda, MD, USA) plugins. The BMO-MRW was measured within the ONH from radial B-scans. As pre-viously described,17 the internal limiting membrane was
automatically delineated, and BMO was manually identified. Subsequently, the minimum distance from BMO to internal limiting membrane was automatically identified and calcu-lated on each side of the 12 radial scans (total of 24 measure-ments per eye). The global BMO-MRW was the average of 24 measurements; the minimal BMO-MRW (Figure 2) was the lowest value among these 24 measurements of BMO-MRW per eye; the minimal sector BMO-MRW was the lowest value among the 6 sectors, which were obtained
Figure 1 Examples of patterns of VF loss on HVFs (Swedish Interactive Threshold Algorithm 24-2) as defined in this study.
Notes: Pattern deviation plots from left eyes are shown. numeric values are in the top row and probability plots are in the bottom row. examples of early paracentral loss with superior paracentral region outlined in black (left) and isolated peripheral loss with superior nasal step zone outlined in black (right) are included.
Abbreviations: VF, visual field; HVF, Humphrey visual field.
3DWWHUQGHYLDWLRQ 3DWWHUQGHYLDWLRQ
±
±
±
±
±
±
±
± ±
±
±
±
±
±
±
±
± ±
± ±
± ±
±
±
± ±
±
±
± ±
±
±
± ±
±
± ±
±
±
± ± ± ±
±
± ±
± ± ±
± ± ±
± ±
± ± ±
±
± ± ± ± ±
±
±
±
±
±
± ± ±
± ± ± ± ±
± ± ± ± ±
± ±
Clinical Ophthalmology downloaded from https://www.dovepress.com/ by 118.70.13.36 on 21-Aug-2020
Dovepress
Taniguchi et al
P P
P P
P P
7
7,
1,
1
76
16
*
7,
7
*
76
16
1,
1
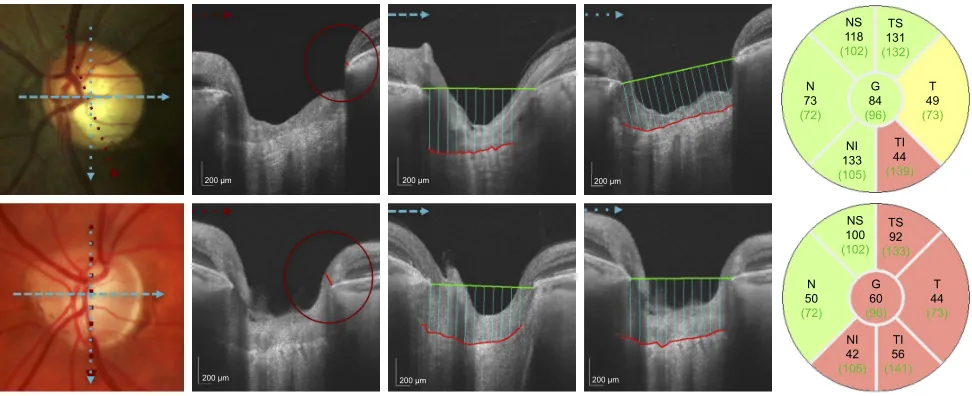
Figure 2 Quantitative assessment of the Onh with ss-OCT in an eye with early paracentral loss and in an eye with isolated peripheral loss.
Notes: Top row shows an eye with early paracentral loss: disc photograph (left), minimal BMO-MrW =34.8 μm (center left), lCDh =449.1 μm (center), lCDV =478.4 μm (center right), and peripapillary RNFL thickness profile (right). The corresponding HVF is shown in Figure 1 (left). Bottom row shows an eye with isolated peripheral loss: disc photograph (left), minimal BMO-MrW =139.5 μm (center left), lCDh =397.6 μm (center), lCDV =454.9 μm (center right), and peripapillary RNFL thickness profile (right). The corresponding hVF is shown in Figure 1 (right). arrows in different colors and patterns indicate location and orientation of scans. Minimal BMO-MrW indicated by red circle and red line (center left), lCDh and lCDV as averages of blue lines (center and center right) were measured on images taken with ss-OCT. The red line delineates the anterior lamina cribrosa surface and the green line connects termination points of Bruch’s membrane (center and center right). rnFl thickness was measured with sD-OCT as shown in the rnFl sector maps (right). The average rnFl is the value in the center (g, global). The minimal rnFl was the lowest value in the sectors (ns, superonasal; Ts, superotemporal; T, temporal; n, nasal; ni, inferonasal and Ti, inferotemporal).
Abbreviations: BMO-MrW, minimum rim width at Bruch’s membrane opening; lCDh, horizontal lamina cribrosa depth; lCDV, vertical lamina cribrosa depth; Onh, optic nerve head; RNFL, retinal nerve fiber layer; HVF, Humphrey visual field; SS-OCT, swept-source optical coherence tomography; SD-OCT, spectral-domain optical coherence tomography.
by averaging the BMO-MRW measurements of all scans in each sector (Figure S1). In addition, scaled BMO-MRW normalized by disc circumference was calculated according to a published method.23
The LCD was measured in one horizontal and in one vertical scan, which were selected from all scans at 90° and 180° for the best visualization of the anterior LC surface and best centration.17 After the manual delineation of the anterior
surface of LC, a reference line connecting BMO was drawn. An ImageJ plugin calculated the perpendicular distance from the reference line to the anterior surface of LC every 100 μm along the reference line (Figure 2) and generated the mean measurement.
Average RNFL thickness and thinnest clock-hour sector of RNFL thickness were extracted from SD-OCT RNFL profile plot.
statistical analysis
Only one eye per subject was included in the analysis. If both eyes were eligible, the right eye was used for control subjects and eyes with matching VF mean deviation (MD) were used for glaucoma patients. Statistical analysis was performed with the Statistical Package for the Social Sciences (SPSS, v.17,
Chicago, IL, USA). The normality of continuous variables was assessed with the Kolmogorov–Smirnov test. Quantita-tive variables were expressed as mean ± standard deviation (SD) and qualitative variables as percentages. Comparison between groups was performed with one-way analysis of vari-ance for normally distributed variables and Kruskal–Wallis test for nonnormally distributed variables. For quantitative parameters, interobserver agreement was assessed using intraclass correlation coefficient. Statistical significance was assumed at p#0.05 level, and Bonferroni correction was applied to correct α error for multiple comparisons. Among OAG cases, a multivariate linear regression model was built with minimal BMO-MRW as the dependent variable and the type of VF loss as the main predictor. The model was adjusted for age, gender, VF MD, and BMO circumference.
Results
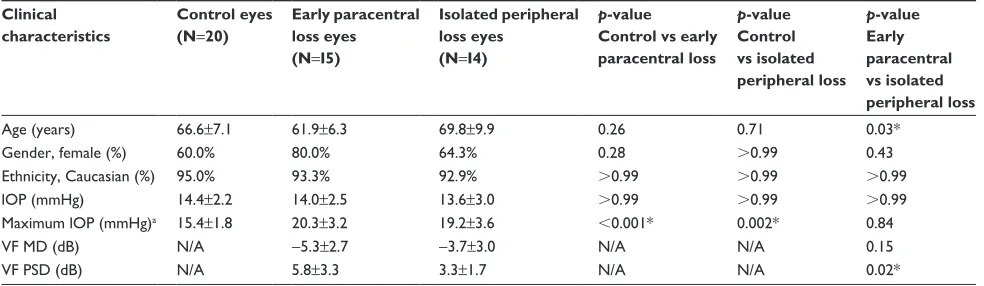
Forty-nine subjects (29 patients with OAG and 20 controls) were included in this study. The mean ± standard deviation age was 65.7±9.0 years for OAG patients and 66.6±7.1 years for control subjects (p=0.72). In OAG subgroups, patients with early paracentral loss were younger than patients with isolated peripheral loss (61.9±6.3 vs 69.8±9.9 years, p=0.03,
Clinical Ophthalmology downloaded from https://www.dovepress.com/ by 118.70.13.36 on 21-Aug-2020
Dovepress Optic nerve measurement associated with paracentral loss
Table 1). Ninety-three percent of OAG patients and 95.0% of control subjects were White (p=0.96); no significant differ-ence in ethnicity was found among the OAG subgroups. The mean IOP measured by Goldmann applanation tonometry
on the day of imaging was 13.8±2.7 mmHg in OAG eyes,
and 14.4±2.2 mmHg in controls (p=0.41); no difference
was found among OAG subgroups (p.0.99). The untreated
maximum IOP was available in 48 (97.9%) of 49 subjects;
it was 19.8±3.4 mmHg in OAG eyes and 15.4±1.8 mmHg in
controls (p=0.0001), with no difference between glaucoma
subgroups (p=0.84). The HVF MD was -5.3±2.7 dB in the early paracentral loss group and -3.7±3.0 dB in the isolated peripheral loss group (p=0.15).
Interobserver agreement was very good for all measured parameters: intraclass correlation coefficient was 0.98, 0.94, 0.93, and 0.96 for global MRW, minimal BMO-MRW, horizontal LCD, and vertical LCD, respectively.17
All radial images were of adequate quality for BMO-MRW measurements. In 36.2% of the radial images, the LC was not visible and the five-line images were used instead for LCD measurements.
Mean global BMO-MRW was lower in glaucomatous eyes than in control eyes (193.8±40.0 vs 322.7±62.2 μm,
p=0.0001) and similar between eyes with early paracentral loss and those with isolated peripheral loss (187.6±43.4 vs 200.6±36.3 μm; p.0.99). Similar findings were obtained with scaled global BMO-MRW (Table 2). The minimal sector BMO-MRW was lowest in eyes with early para-central loss (109.3±38.2 μm), which differed from the control group (229.1±44.1 μm, p,0.001) but not from the eyes with isolated peripheral loss (139.3±39.5 μm,
p=0.17). This was also observed with scaled minimal sector BMO-MRW.
The minimal BMO-MRW was 200.1±40.8 μm in control
eyes and 87.7±41.2 μm in OAG eyes (p=0.0001). Eyes with early paracentral loss (Figure 2) had significantly lower minimal BMO-MRW than eyes with isolated peripheral loss (69.0±33.6 vs 107.7±40.2 μm, p=0.03). Similarly, low scaled minimal BMO-MRW distinguished eyes with para-central loss from eyes with isolated peripheral loss (p=0.04) and control eyes (p=0.0001, Table 2). The location of the minimal BMO-MRW was the temporal quadrant in 90% of the control eyes. In eyes with early paracentral loss, the minimal BMO-MRW was located in the inferior quadrant (including inferior-temporal and inferior-nasal) (80%), temporal quadrant (13.3%), or superior-temporal quadrant (6.7%) in that order; 86.7% of all minimal BMO-MRW locations corresponded to the VF defect location. In eyes with isolated peripheral loss, the minimal BMO-MRW was located in the inferior quadrant (57.1%), temporal quadrant (21.4%), superior-temporal quadrant (14.3%), and nasal quadrant (7.1%); 35.7% of all locations corresponded to the
hemifield with more severe VF defect (p=0.008 compared
to correspondence in early paracentral VF loss).
The mean horizontal LCD was 433.5±94.6 μm in control eyes and 440.8±109.9 μm in OAG eyes (p=0.80), while the mean vertical LCD was 448.8±105.2 μm in controls eyes and 455.7±94.3 μm in OAG eyes (p=0.82). Neither parameter was significantly different among the OAG subgroups (p.0.19 for all, Table 2).
The average RNFL thickness measured with SD-OCT was 96.6±10.4 μm in control eyes and 73.1±12.3 μm in OAG eyes (p=0.0001, Table 2); eyes with early paracentral loss were not significantly different than eyes with isolated peripheral loss (p=0.61); and neither was the thinnest RNFL thickness (p=0.19).
Table 1 Clinical characteristics among the studied groups Clinical
characteristics
Control eyes (N=20)
Early paracentral loss eyes
(N=I5)
Isolated peripheral loss eyes
(N=I4)
p-value
Control vs early paracentral loss
p-value Control vs isolated peripheral loss
p-value Early paracentral vs isolated peripheral loss
age(years) 66.6±7.1 61.9±6.3 69.8±9.9 0.26 0.71 0.03*
gender, female (%) 60.0% 80.0% 64.3% 0.28 .0.99 0.43
ethnicity, Caucasian (%) 95.0% 93.3% 92.9% .0.99 .0.99 .0.99
lOP (mmhg) 14.4±2.2 14.0±2.5 13.6±3.0 .0.99 .0.99 .0.99
Maximum lOP (mmhg)a 15.4±1.8 20.3±3.2 19.2±3.6 ,0.001* 0.002* 0.84
VF MD (dB) n/a -5.3±2.7 -3.7±3.0 n/a n/a 0.15
VF PsD (dB) n/a 5.8±3.3 3.3±1.7 n/a n/a 0.02*
Notes: Values are expressed as mean ± standard deviation unless otherwise specified. *Statistically significant difference, p,0.05. aKnown untreated maximum iOP was
available for all control eyes and 28 of 29 glaucoma eyes.
Abbreviations: IOP, intraocular pressure; VF MD, visual field mean deviation; VF PSD, visual field pattern standard deviation; N/A, not available.
Clinical Ophthalmology downloaded from https://www.dovepress.com/ by 118.70.13.36 on 21-Aug-2020
Dovepress
Taniguchi et al
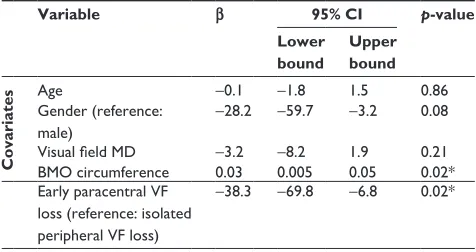
The association between minimal BMO-MRW and paracentral VF loss was further assessed in multiple regression analysis of OAG groups; eyes with isolated peripheral loss served as the reference group. Low minimal BMO-MRW was significantly associated with early para-central loss (β=-38.3 μm; 95% confidence interval, -69.8 to -6.8 μm; p=0.02, Table 3), after adjusting for age (p=0.86), gender (p=0.08), VF MD (p=0.21), and BMO circumference (p=0.02). A previous report suggest that linear conversion of MD is required to correlate structure with function, as MD is derived from logarithmic scale.11 In
our study, linearization of VF MD did not change the out-come of the multiple regression model, and thus the effect of early paracentral loss on minimal BMO-MRW remained significant (β=-36.1 μm; 95% confidence interval, -66.5 to -5.7 μm; p=0.02), after adjusting for age (p=0.74), gender
(p=0.07), and linearized VF MD (p=0.17). There is an asso-ciation between lower minimal BMO-MRW and lower BMO circumference (p=0.01).
Discussion
Glaucomatous optic nerve damage manifests in different patterns of VF loss, sometimes involving the central vision early during the course of the disease. In this study, we focused on eyes with early paracentral loss (ie, VF loss within the central 10° with or without peripheral loss in the same hemifield) instead of isolated paracentral loss,5 as
glaucoma-tous paracentral scotomas are usually accompanied by some degrees of peripheral loss in the same hemifield. This was demonstrated by a previous study, which computationally identified VF loss patterns from a database comprised of 13,231 HVFs from the same practice.24 Furthermore, systemic
and genetic factors associated with paracentral scotoma have been identified using similar VF criteria.20,25 In this
prospec-tive study, with the aid of SS-OCT, we identified prelaminar pathology, in particular thin minimal BMO-MRW to be more common in patients with early paracentral VF loss than in those with isolated peripheral VF loss. Using multivariate regression analysis, we demonstrated that the association between thin minimal BMO-MRW and paracentral loss was independent of VF severity.
Our study supports the use of minimal BMO-MRW as a quantitative parameter in glaucoma evaluation. The param-eter BMO-MRW, unlike the clinically used rim area, which is based on clinical disc margin, relies on BMO. It provides a good surrogate for the number of axons entering the ONH,11
and may have better sensitivity and specificity for glaucoma
Table 2 Quantitative parameters among the studied group
ONH parameters (μm) Control
eyes (N=20)
Early paracentral loss eyes (N=15)
Isolated peripheral loss eyes (N=14)
p-value Control vs early paracentral loss
p-value Control vs isolated peripheral loss
p-value Paracentral vs isolated peripheral loss
ss-OCT global BMO-MrW 322.7±62.2 187.6±43.4 200.6±36.3 ,0.001* ,0.001* .0.99
ss-OCT scaled global BMO-MrW 308.3±70.8 187.3±40.2 207.9±60.6 ,0.001* ,0.001* .0.99
ss-OCT minimal BMO-MrW 200.1±40.8 69.0±33.6 107.7±40.2 ,0.001* ,0.001* 0.03*
ss-OCT scaled minimal BMO-MrW 191.4±45.0 69.5±35.6 114.0±55.53 ,0.001* ,0.001* 0.04* ss-OCT minimal sector BMO-MrW 229.1±44.1 109.3±38.2 139.2±39.5 ,0.001* ,0.001* 0.17 ss-OCT scaled minimal sector BMO-MrW 219.5±51.6 110.3±41.4 145.7±57.9 ,0.001* ,0.001* 0.20
ss-OCT lCDh 433.5±94.6 465.4±104.5 414.5±113.2 .0.99 .0.99 0.57
ss-OCT lCDV 448.8±105.2 487.9±94.6 418.4±82.3 0.72 .0.99 0.19
sD-OCT average rnFlT 96.6±10.4 70.4±9.7 75.9±14.3 ,0.001* ,0.001* 0.61
sD-OCT thinnest rnFlT 66.7±8.0 47.1±8.9 53.6±10.7 ,0.001* 0.001* 0.19
Notes: Values are expressed as mean ± standard deviation. *Statistically significant difference, p,0.05.
Abbreviations: ss-OCT, swept source optical coherence tomography; BMO-MrW, minimum rim width at Bruch’s membrane opening; lCDh, horizontal lamina cribrosa depth; LCDV, vertical lamina cribrosa depth; ONH, optic nerve head; SD-OCT, spectral domain optical coherence tomography; RNFLT, retina nerve fiber layer thickness.
Table 3 Multivariate linear regression for the measurement of minimal BMO-MrW
Variable β 95% CI p-value
Lower bound
Upper bound
Covariates
age -0.1 -1.8 1.5 0.86
gender (reference: male)
-28.2 -59.7 -3.2 0.08
Visual field MD -3.2 -8.2 1.9 0.21
BMO circumference 0.03 0.005 0.05 0.02*
early paracentral VF loss (reference: isolated peripheral VF loss)
-38.3 -69.8 -6.8 0.02*
Note: *Statistically significant association, p,0.05.
Abbreviations: MD, mean deviation; BMO, Bruch’s membrane opening; BMO-MRW, minimum rim width at Bruch’s membrane opening; VF, visual field; CI, confidence interval.
Clinical Ophthalmology downloaded from https://www.dovepress.com/ by 118.70.13.36 on 21-Aug-2020
Dovepress Optic nerve measurement associated with paracentral loss
detection than RNFL-based parameters.26,27 In this study, we
found that global BMO-MRW was significantly affected in glaucomatous eyes compared to that in controls; this is consistent with the literature.26 Furthermore, OAG eyes with
early paracentral VF loss had significantly thinner minimal BMO-MRW compared to eyes with peripheral VF loss, whereas RNFL thickness parameters (thinnest and aver-age), global BMO-MRW (average and scaled), and minimal sector BMO-MRW (average and scaled) were comparable between these two groups. Minimal BMO-MRW may be a unique quantitative ONH biomarker associated with early paracentral VF loss; since the BMO-MRW is measured within the optic nerve, it may be more likely to reflect local ONH changes than peripapillary RNFL thickness, as the latter is measured on average 1.7 mm away from the center
of the optic nerve.28 In addition, minimal BMO-MRW
rep-resents the focal ON damage corresponding to a discrete area near fixation on the VF, whereas global BMO-MRW and sector BMO-MRW cannot capture the focal thinning (Figure S2).
The multivariate analysis also showed an association between lower minimal BMO-MRW and lower BMO circumference, suggesting that focal thinning of the neu-roretinal rim may be more common in smaller discs with glaucoma. Although this observation differs from a report on global MRW and healthy eyes, where
BMO-MRW is lower in eyes with macrodiscs than microdiscs,29
it is consistent with previous characterization of different glaucomatous optic disc phenotypes.30 A disc phenotype
associated with paracentral VF loss (focal glaucomatous) was found to have smaller disc size than other phenotypes (senile sclerotic and generalized cup enlargement), which rarely manifest in VF loss near fixation. It is likely that qualitative description of different glaucomatous optic disc appearances can be quantified with novel imaging param-eters; minimal BMO-MRW serves as a parameter for focal glaucomatous phenotype.
In contrast to prelaminar pathology, this cross-sectional study of treated OAG patients without incisional surgery versus controls did not find a difference in LCD, among controls or OAG eyes with different VF loss patterns. Previous studies described increased LCD, attributable to posterior displacement, thinning, or remodeling of the LC,
as a component of glaucomatous optic neuropathy.14,31–33
Our method of measuring LCD was similar to a recent
publication using SS-OCT32 but differed from those using
EDI-OCT, which averaged LCD obtained from multiple locations of the ONH.14,31 It is also likely that lower or
higher IOP and trans-LC pressure gradient may play an important role in LCD.15,34,35 Hence, in this study, where
OAG patients on ocular hypotensive treatment and control subjects had similar IOP on the day of imaging, the differ-ence in LCD was not significant. It is also possible that a larger sample size is needed to detect a difference between glaucoma and control subjects.14,32 Additional studies
demonstrated thinner LC in patients with glaucoma.36 We
were not able to visualize the posterior surface of the LC in a consistent manner and therefore did not include LC thickness measurements.
Our findings suggest that glaucomatous ONH changes associated with early paracentral VF loss may occur primarily as focal lesions in the neuronal tissue, anterior to the LC. There may be localized ischemia affecting the papillomacular bundle of the neuronal tissue, causing severe thinning of the BMO-MRW and paracentral VF loss. This is consistent with previous reports that patients with para-central loss are more likely to have vascular dysregulation,
leading to local ischemia, such as Raynaud’s syndrome.5
In addition, this is supported by clinical examination of the ONH, which shows localized changes such as disc hemor-rhage5 or acquired pit7 associated with paracentral VF loss.
Additional research is needed to confirm our findings and to optimize the detection strategy for patients at risk for paracentral VF loss.
This study has several limitations. First, it had a relatively small sample size, and the findings need to be confirmed in other studies. Second, the study population was relatively homogeneous, consisting predominantly of white subjects; ONH characteristics might be different in a glaucomatous population of other ethnicities, although a recent study did not find significant difference in BMO-MRW thickness between normal eyes of African descent and European descent.37 Third,
the measurement of BMO-MRW was performed manually by experienced observers with the aid of customized software. While this method was found to be reliable and reproducible in our previous study,17 existing automated segmentation software
for BMO-MRW may require manual correction and further refinement. Finally, given the cross-sectional design of this study, a cause and effect relation could not be established.
Conclusion
Our study showed that glaucomatous optic nerve damage can manifest in the prelaminar tissue as focal thinning of BMO-MRW; thin minimal BMO-MRW may represent a new structural biomarker associated with glaucomatous paracentral scotoma.
Clinical Ophthalmology downloaded from https://www.dovepress.com/ by 118.70.13.36 on 21-Aug-2020
Dovepress
Taniguchi et al
Acknowledgments
The authors thank Dr John Miller, Dr Neha Sangal, and Marissa Shoji for data collection; Taibo Li and Haobing Wang for assisting with measurements of optic nerve head parameters; Dr Tobias Elze for calculating linearized visual field mean deviation values; Massachusetts Eye and Ear Fluorescein Laboratory Photographers for performing the imaging protocols described in this paper; and Massachusetts Eye and Ear study coordinators.
This work was supported by the Harvard Glaucoma Center of Excellence and the Miller Research Funds at the Massachusetts Eye and Ear. Some of the results of this paper were presented at the Association for Research in Vision and Ophthalmology as a conference talk with interim find-ings. The poster’s abstract was published in “ARVO Annual Meeting Abstract” in Invest Ophthalmol Vis Sci: http://iovs.
arvojournals.org/issues.aspx?issueid=934157&journalid=1
77#issueid=934157.
Disclosure
Louis R Pasquale is supported by a Harvard Medical School Distinguished Scholar Award. Lucy Q Shen is supported by the Eleanor and Miles Shore Fellowship, Harvard Medical School. The authors report no other conflicts of interest in this work.
References
1. Weinreb RN, Khaw PT. Primary open-angle glaucoma. Lancet. 2004; 363(9422):1711–1720.
2. Keltner JL, Johnson CA, Cello KE, et al. Classification of visual field abnormalities in the ocular hypertension treatment study. Arch
Ophthalmol. 2003;121(5):643–650.
3. Abe RY, Diniz-Filho A, Costa VP, Gracitelli CP, Baig S, Medeiros FA. The impact of location of progressive visual field loss on longitudinal changes in quality of life of patients with glaucoma. Ophthalmology. 2016;123(3):552–557.
4. Coeckelbergh TR, Brouwer WH, Cornelissen FW, Van Wolffelaar P, Kooijman AC. The effect of visual field defects on driving perfor-mance: a driving simulator study. Arch Ophthalmol. 2002;120(11): 1509–1516.
5. Park SC, De Moraes CG, Teng CC, Tello C, Liebmann JM, Ritch R. Initial parafoveal versus peripheral scotomas in glaucoma: risk factors and visual field characteristics. Ophthalmology. 2011;118(9):1782–1789. 6. Jung KI, Park HY, Park CK. Characteristics of optic disc morphology
in glaucoma patients with parafoveal scotoma compared to peripheral scotoma. Invest Ophthalmol Vis Sci. 2012;53(8):4813–4820.
7. Nduaguba C, Ugurlu S, Caprioli J. Acquired pits of the optic nerve in glaucoma: prevalence and associated visual field loss. Acta Ophthalmol
Scand. 1998;76(3):273–277.
8. Lee J, Hangai M, Kimura Y, Takayama K, Kee C, Yoshimura N. Measure-ment of macular ganglion cell layer and circumpapillary retinal nerve fiber layer to detect paracentral scotoma in early glaucoma. Graefes Arch
Clin Exp Ophthalmol. 2013;251(8):2003–2012.
9. Takayama K, Hangai M, Kimura Y, et al. Three-dimensional imaging of lamina cribrosa defects in glaucoma using swept-source optical coherence tomography. Invest Ophthalmol Vis Sci. 2013;54(7): 4798–4807.
10. Považay B, Hofer B, Hermann B, et al. Minimum distance mapping using three-dimensional optical coherence tomography for glaucoma diagnosis. J Biomed Opt. 2007;12(4):041204.
11. Gardiner SK, Ren R, Yang H, Fortune B, Burgoyne CF, Demirel S. A method to estimate the amount of neuroretinal rim tissue in glau-coma: comparison with current methods for measuring rim area. Am J
Ophthalmol. 2014;157(3):540–549.e1–e2.
12. Mizumoto K, Gosho M, Zako M. Correlation between optic nerve head structural parameters and glaucomatous visual field indices.
Clin Ophthalmol. 2014;8:1203–1208.
13. Pollet-Villard F, Chiquet C, Romanet JP, Noel C, Aptel F. Structure-function relationships with spectral-domain optical coherence tomography retinal nerve fiber layer and optic nerve head measure-mentsstructure-function relationships with SD-OCT. Invest Ophthalmol
Vis Sci. 2014;55(5):2953–2962.
14. Park SC, Brumm J, Furlanetto RL, et al. Lamina cribrosa depth in different stages of glaucoma. Invest Ophthalmol Vis Sci. 2015;56(3): 2059–2064.
15. Jung KI, Jung Y, Park KT, Park CK. Factors affecting plastic lamina cribrosa displacement in glaucoma patients. Invest Ophthalmol Vis Sci. 2014;55(12):7709–7715.
16. Sawada Y, Hangai M, Murata K, Ishikawa M, Yoshitomi T. Lamina cribrosa depth variation measured by spectral-domain optical coher-ence tomography within and between four glaucomatous optic disc phenotypes. Invest Ophthalmol Vis Sci. 2015;56(10):5777–5784. 17. Li D, Taniguchi EV, Cai S, et al. Comparison of swept-source and
enhanced depth imaging spectral-domain optical coherence tomography in quantitative characterisation of the optic nerve head. Br J Ophthalmol. 2017;101(3):299–304.
18. Jonas JB, Kling F, Gründler AE. Optic disc shape, corneal astigmatism, and amblyopia. Ophthalmology. 1997;104(11):1934–1937.
19. Vongphanit J, Mitchell P, Wang JJ. Population prevalence of tilted optic disks and the relationship of this sign to refractive error. Am J
Ophthalmol. 2002;133(5):679–685.
20. Loomis SJ, Kang JH, Weinreb RN, et al. Association of CAV1/CAV2 genomic variants with primary open-angle glaucoma overall and by gender and pattern of visual field loss. Ophthalmology. 2014;121(2): 508–516.
21. Mansouri K, Nuyen B, N Weinreb R. Improved visualization of deep ocular structures in glaucoma using high penetration optical coherence tomography. Expert Rev Med Devices. 2014;10(5):621–628. 22. Park HY, Shin HY, Park CK. Imaging the posterior segment of the eye
using swept-source optical coherence tomography in myopic glaucoma eyes: comparison with enhanced-depth imaging. Am J Ophthalmol. 2014;157(3):550–557.
23. Patel NB, Sullivan-Mee M, Harwerth RS. The relationship between retinal nerve fiber layer thickness and optic nerve head neuroretinal rim tissue in glaucoma. Invest Ophthalmol Vis Sci. 2014;55(10): 6802–6816.
24. Elze T, Pasquale LR, Shen LQ, Chen TC, Wiggs JL, Bex PJ. Patterns of functional vision loss in glaucoma determined with archetypal analysis.
J Royal Soc Interface. 2015;12(103). pii: 20141118.
25. Kang JH, Loomis SJ, Rosner BA, Wiggs JL, Pasquale LR. Comparison of risk factor profiles for primary open-angle glaucoma subtypes defined by pattern of visual field loss: A prospective study. Invest Ophthalmol
Vis Sci. 2015;56(4):2439–2448.
26. Chauhan BC, O’Leary N, Almobarak FA, et al. Enhanced detection of open-angle glaucoma with an anatomically accurate optical coher-ence tomography-derived neuroretinal rim parameter. Ophthalmology. 2013;120(3):535–543.
27. Rebolleda G, Casado A, Oblanca N, Muñoz-Negrete FJ. The new Bruch’s membrane opening – minimum rim width classification improves optical coherence tomography specificity in tilted discs.
Clin Ophthalmol. 2016;10:2417–2425.
28. Schuman JS, Pedut-Kloizman T, Hertzmark E, et al. Reproducibility of nerve fiber layer thickness measurements using optical coherence tomography. Ophthalmology. 1996;103(11):1889–1898.
Clinical Ophthalmology downloaded from https://www.dovepress.com/ by 118.70.13.36 on 21-Aug-2020
Dovepress Optic nerve measurement associated with paracentral loss
29. Enders P, Adler W, Schaub F, et al. Novel Bruch’s membrane open-ing minimum rim area equalizes disc size dependency and offers high diagnostic power for glaucoma. Invest Ophthalmol Vis Sci. 2016; 57(15):6596–6603.
30. Broadway DC, Nicolela MT, Drance SM. Optic disk appear-ances in primary open-angle glaucoma. Surv Ophthalmol. 1999; 43(Suppl 1):S223–S243.
31. Lee EJ, Kim TW, Kim M, Kim H. Influence of lamina cribrosa thickness and depth on the rate of progressive retinal nerve fiber layer thinning.
Ophthalmology. 2015;122(4):721–729.
32. Kim DW, Jeoung JW, Kim YW, et al. Prelamina and lamina cribrosa in glaucoma patients with unilateral visual field loss. Invest Ophthalmol
Vis Sci. 2016;57(4):1662–1670.
33. Lee SH, Kim TW, Lee EJ, Girard MJA, Mari JM. Diagnostic power of lamina cribrosa depth and curvature in glaucoma. Invest Ophthalmol
Vis Sci. 2017;58(2):755–762.
34. Quigley H, Arora K, Idrees S, et al. Biomechanical responses of lamina cribrosa to intraocular pressure change assessed by optical coherence tomography in glaucoma eyes. Invest Ophthalmol Vis Sci. 2017;58(5):2566–2577.
35. Sigal IA, Yang H, Roberts MD, Burgoyne CF, Downs JC. IOP-induced lamina cribrosa displacement and scleral canal expansion: An analysis of factor interactions using parameterized eye-specific models. Invest
Ophthalmol Vis Sci. 2011;52(3):1896–1812.
36. Kwun Y, Han JC, Kee C. Comparison of lamina cribrosa thickness in normal tension glaucoma patients with unilateral visual field defect.
Am J Ophthalmol. 2015;159(3):512–518.e1.
37. Rhodes LA, Huisingh CE, Quinn AE, et al. Comparison of bruch’s membrane opening minimum rim width among those with Normal ocular health by race. Am J Ophthalmol. 2017;174:113–118.
Clinical Ophthalmology downloaded from https://www.dovepress.com/ by 118.70.13.36 on 21-Aug-2020
Dovepress
Taniguchi et al
Supplementary materials
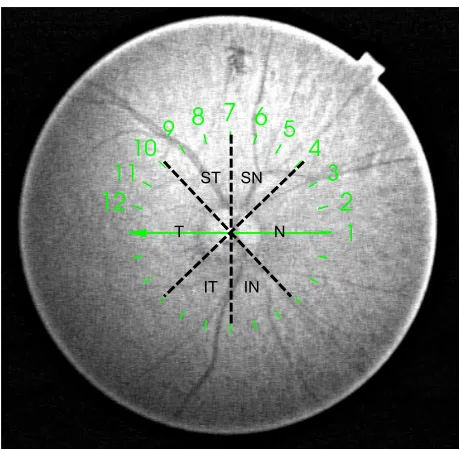
Figure S1 Diagram showing scans included in each sector for calculating sector BMO-MrW in a right eye.
Notes: n: 10, 11, 12, 1, 2, 3, 4; sn: 5, 6, 7; sT: 8, 9, 10; T: 11, 12, 1, 2, 3; iT: 4, 5, 6; in: 7, 8, 9. similarly, the corresponding scans were used for calculating sector BMO-MrW in left eyes.
Abbreviations: BMO-MrW, minimum rim width at Bruch’s membrane opening; n, nasal; sn, superonasal; sT, superotemporal; T, temporal; iT, inferotemporal; in, inferonasal.
61 67
7
,7 ,1 1
26/
2YHUOD\ *ULG
2YHUOD\ (QKDQFHG,5
*ULG
/D\HUV $YHUDJLQJVXFFHVVUDWH
,PDJHTXDOLW\
$
$
26/
2YHUOD\ *ULG
2YHUOD\ (QKDQFHG,5
*ULG
/D\HUV $YHUDJLQJVXFFHVVUDWH
,PDJHTXDOLW\
%
$
Clinical Ophthalmology downloaded from https://www.dovepress.com/ by 118.70.13.36 on 21-Aug-2020
Clinical Ophthalmology
Publish your work in this journal
Submit your manuscript here: http://www.dovepress.com/clinical-ophthalmology-journal Clinical Ophthalmology is an international, peer-reviewed journal covering all subspecialties within ophthalmology. Key topics include: Optometry; Visual science; Pharmacology and drug therapy in eye diseases; Basic Sciences; Primary and Secondary eye care; Patient Safety and Quality of Care Improvements. This journal is indexed on
PubMed Central and CAS, and is the official journal of The Society of Clinical Ophthalmology (SCO). The manuscript management system is completely online and includes a very quick and fair peer-review system, which is all easy to use. Visit http://www.dovepress.com/ testimonials.php to read real quotes from published authors. Dovepress
Dove
press
Optic nerve measurement associated with paracentral loss
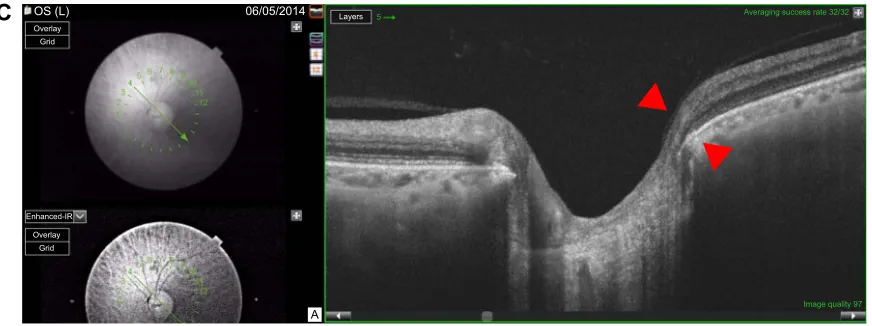
Figure S2 example of a left eye with early paracentral loss.
Notes: The corresponding visual field test is shown in Figure 1 left side. The minimal BMO-MRW is 34.8 μm and the minimal sector BMO-MrW, as an average over three adjacent scans, is thicker at 92.4 μm. (A) Minimal BMO-MrW (34.8 μm) is in the inferotemporal sector (red arrow) on scan 6. (B) BMO-MrW in the inferotemporal sector (red arrowheads) is 109.3 μm on scan 5. (C) BMO-MrW in the inferotemporal sector (red arrowheads) is 133.0 μm on scan 4.
Abbreviation: BMO-MrW, minimum rim width at Bruch’s membrane opening. 2YHUOD\
26/
*ULG
2YHUOD\ (QKDQFHG,5
/D\HUV $YHUDJLQJVXFFHVVUDWH
,PDJHTXDOLW\
*ULG
&
$
Clinical Ophthalmology downloaded from https://www.dovepress.com/ by 118.70.13.36 on 21-Aug-2020