Environment and Planning 11 Planning and Design IW), volume 26, pages K55 N78
Towards a new digital data infrastructure for urban analysis
and modelling
P A Longley, R J Harris
School of Geographical Sciences, University of Bristol, University Road, Bristol BS8 ISS, Hngland; e-mail: paul.longley(r»>bristol.ac.uk; r.j.harrisc^bristol.ac.uk
Received 18 February 1999; in revised form 12 May 1999
Abstract. Formal models of urban systems have the potential to reveal a lot about the form and functioning of urban settlements, yet much of this potential has still to be realised. In this paper we focus on the extent to which this has reflected the dearth of digital data that arc rich* relevant, and disaggregate. Geodcmogrnphic classifications have made important and enduring contributions to small-area analysis. Yet, on the one hand, reliance upon census data makes them outdated and irrele-vant and, on the other, fragmentation and diversification of social areas in cities has made the 'mosaic metaphor' of small-area analysis untenable. As part of the quest for a new perspective on data modelling, we investigate in this paper the potential of 'lifestyles' data sets for creating richer, more relevant digital models of human activity patterns in cities.
1 Introduction
Simple powerful theories and models arc the most established and enduring in social science. Yet they provide only normative sketches which arc increasingly irrelevant to the understanding of the messy irregularity that characterises the patterning of the real world. Empirical generalisation requires quantitative data collected according to rigorous research designs, yet most such data arc too infrequently collected, too coarse, and/or insufficiently relevant to the functioning of fast-changing systems. In this paper we begin to gather a new perspective on the practical foundations to model building and to seek a rapprochement between social scientific orthodoxies and the practice of generalising individual and household activity patterns. We develop our arguments in the context of the analytical tradition of measuring and modelling the spatial pattern-ing of social grouppattern-ings in city regions, extended to encompass the so-called 'lifestyles' analysis of household consumption and activity patterns. We argue that our ability routinely to measure, share, and concatenate rich digital data sources creates opportu-nities to develop relevant and timely depictions of what is going on right across urban systems but that social science has so far held back from embracing such sources. The reasons for this are valid, yet if ultimately determinate they will stifle the creativity of model building in the digital age. As one of us has argued elsewhere (Goodchild and Longley, 1999; Longley, 1998), the 'new digital infrastructure' to GIS-based analysis can be fundamentally unsystematic in design but this need not necessarily preclude all systematic analysis. In our discussion we will make much of the roles of improved
data models of spatial distributions in fostering the development of systematic and
thematic urban models of social systems.
2 Models of social patterns in cities
became manifest in a differentiated mosaic of residential land uses, as waves of 'invasion and succession' swept through successive inner-city neighbourhoods. Although genera-tions of students have since seen measurement of pattern as a goal in itself, it is important to remember that the original rationale for such measurement lay in a simple theory of urban dynamics and that an early objective was to relate generating process to spatial pattern.
The dynamics of Chicago's rapid growth in the 1920s present an unusually straight-forward context for analysis of the evolution of urban form—a fast-growing city, the change dynamics of which could be traced simply to in-migration. The application nevertheless spawned the much more general 'social area analysis' tradition to analysis of residential differentiation, based on a developing range of principal component and factor analysis techniques. Reviews of this research (see Clarke and Gleave, 1973; also Timms, 1969) illustrate the way in which inductive generalisation about the similarities between residential areas, harnessed to the 'mosaic metaphor' (Johnston, 1999), took place in innumerable case studies. Much of this research was avowedly technocentric and arose out of the development of computers to handle, by the standards of the time, large and complex data sets. Yet even as taxonomies of social areas and the groups resident within them became more detailed and sophisticated, the approach came to be seen as increasingly irrelevant to any understanding of the way in which towns and cities functioned (see Harvey, 1973). Over time, it became apparent just how dependent statistical classifications were upon the particular cocktail of variables that were used to generate them, and the constructs and labels that were appended to statistical 'dimensions' (such as 'stage in family life cycle') themselves came under greater scrutiny (see Stapleton, 1980). At the same time, within mainstream quantitative analysis, there was heightened awareness of ecological fallacy and modifiable areal unit effects in geographical analysis (see Openshaw, 1984). If the characteristics of areas could mis-leadingly be confounded with the characteristics of individuals in areas, then there were clear problems in overreliance upon publicly available data sets available only for (often very coarse) areal aggregations (see Cole, 1993). In short, from the mid-1970s onwards, data models of multivariate spatial distributions (and thence the thematic urban models that were built upon them) became viewed with increasing suspicion.
Towards a new digital data infrastructure for urban analysis and modelling K.S7
In this context, the quest to relate form to function, patterning to social process, was largely abandoned (Batty and Longley, 1997). Since thai time, urban geography has arguably been overwhelmed by the task of representing the statics and dynamics of spatial structure, to the point at which the discipline appears to have all but withdrawn from the task of generalisation, b'rom the innovation of behavioural geography through to the depictions of individuals in cultural geography, the balance of intellectual activity has shifted from system-wide generalisation to richer yet haphazard depiction of disparate and fragmented subgroups within society. This has had knock-on effects in terms of the confidence of the discipline to suggest prescriptions and prognoses for urban change. Generalisation is a cornerstone to rational planning policy, and an urban geography which eschews system-wide generalisation is likely to become relegated to the sidelines of all but academic discourse. The demise of applied geography is particularly apparent in this context (see Pacionc, 1999), as is the reduced esteem in which 'predict and provide' planning is presently held.
3 Geodemographics and the emergence of 'lifestyles'
Academic qualms about the validity, scope, and applicability of social area analysis have had few implications for applied marketing geography. Within the United Kingdom, for example, classifications of residential areas have become an established marketing tool ever since digital census data first appeared following the 1971 Census (Beaumont, 1991).
This applications field has become known as 'geodemographics1, defined by Brown
(1991, page 221) as "a shorthand label for both the development and the application of area typologies that have proved to be powerful discriminators of consumer behaviour and aids to 'market analysis'". In the United Kingdom and USA, data models of geodemographic distributions of entire populations have been built by retail consultancies, by applying techniques of cluster and principal components to census data. Qualitative analysis of the results of data reduction leads to the assigning of labels to the different groups (such as 'affluent achievers', 'have nots', 'thriving greys', etc) which marketeers have associated successfully with particular product and service niches in retailing (Goss, 1995). In an important review paper, Batcy and Brown (1995) trace the transfer of the techniques of social area analysis to applications in marketing through a range of 'near-market' research activities. Gcodemographics has no core theory beyond the notion that 'birds of a feather flock together' (Flowcrdew and Leventhal, 1998) yet experience has shown that this provides no practical barrier to successful application. Various refinements have been carried out to the classification methodologies and their marketing to clients, including the use of supplementary noncensus data to label census
classifications (Batey and Brown, 1995).(l) By the mid-1990s geomdemographics had
become a successful and standard tool of the marketeer. Different proprietary systems have used different cocktails of census counts and classifying algorithms (with the SuperProfiles system having perhaps the best academic pedigree; Openshaw, 1996) yet successive geodemographic systems produced from 1971, 1981, and 1991 UK Census data represent applications of a core technology which have enjoyed repeat purchase by a range of business clients.
However, fundamental problems remain with census-based classifications, which may be illustrated with respect to the UK case. The raw data of census counts provide at best imperfect indicators of likely consumption behaviour because crucial informa-tion is not collected (notably income data). In turn, composite indicators of consumer
(1) Supplementary descriptors include the use of the National Readership Survey and data from
behaviour are thus also dependent upon crude surrogate data. Moreover, current geodemographic systems are frequently reliant upon census data that are over a decade
old, and this represents an increasing handicap in fast-changing, consumer-led markets/2)
Census data are comprehensive in terms of coverage of the U K population—notwith-standing problems of (illegal) nonresponse by the "missing millions' in the 1991 UK Census (Marsh, 1993)—yet this is rarely a key criterion for market area analysis, with its usual focus on subgroup behaviour. Outside of the USA, many public-sector agencies have found it necessary to introduce aggressive data-pricing regimes in order to recover some of the costs of data creation, and this presents a further disincentive to the use of census sources. Taken together (and contrary to the claims of some of those who sell geodemographic systems) it is clear that the data infrastructure provided by the census does not present a panacea for analysis of consumption and activity patterns. It is certainly well founded in survey research terms, but its content is increasingly marginal to the understanding and prediction of what is going on in modern Britain.
At the same time, the capture of digital data by using a range of new technologies has become commonplace. This has led to the advent of a wide range of so-called 'lifestyles' data, originating from such diverse sources as consumer product-guarantee returns, store loyalty programmes, and recorded travel behaviour. A wide definition of lifestyles data would emphasise their chief facets: they 'capture' (measure) some of the varied consumption choices, shopping habits, and practices of identifiable individuals. The wider definition thus includes a range of nonsurvey-based sources of lifestyles data, such as guarantee-card returns, electronic point-of-sale (EPOS) from retail purchases, loyalty card data, share ownership records, and country court judgments, many of which have been available since the beginning of the 1990s. Companies such as ICD, Claritas, Experian, and Pyschographics have built up huge 'data warehouses'. CACI Information Services claim that by using their 'LifestylesUK' product it is possible to target over 44 million individuals by using 300 lifestyle variables (source: promotional brochure). Claritas UK's 'Micromarketing' offers information on 75% of UK house-holds (source: promotional brochure).
In the empirical sections of this paper (and following Harris, 1998, page 2) we will take a narrow definition of GB lifestyles data, as "data obtained and stored at the non-aggregated level of a named individual and geo-referenced by their address; the data [are] collated from the return of (consumer) questionnaires mailed directly to eligible voters, as recorded upon the Electoral Register for Great Britain". An example of one such lifestyle questionnaire is shown in figure 1.
Lifestyles data sets elicit information on a far wider range of themes than the census, from household structure and demographic characteristics (often including income) to consumption habits and recreational pursuits. As such, today's lifestyles data provide a range of relevant (direct and/or indirect) indicators of individual and household propensities to consumer particular goods and services, as well as detailed information about individual and household activity patterns. Data pertain to the
(2) This said, there is a counterargument that geodemographic classifications remain effective long
after the data from which they are derived have become outdated. This is because, the argument goes, the classificaitons are 'driven' or influenced by variables that reflect directly the structure of the property market. If we assume that typologies capture property attributes as well as household
characteristics then, as time goes by, although the residents will change, the property market acts
Towards a new digital data infrastructure for urban analysis and modelling 859
C I I U U M C * S w i f t ) * vtltl h t*|» y«u fislty up to *t»f# wllh m * o f f m »fnl tafWMaltofi ffftfli tTjwtatifa tmwpanle* * t tfcay tWom* avail »M«, T>« f^Wwtng qufittoni h m tx*f» »tk*<l by the ore»ti!t*»en< listed r*te»w VH JI<J wny m t yeur *n*w«f s far nmk* tjug rwrpwii a 10 IT* 0}*<i f M m r t M 31 A«Mfm A«Ja I * | , n. 11 fliy** fAv^TM* **! I M/I.M N.*v.ttt» U*;wi finwiftil 8*i»v«*4«n IJ, *J ».*. J S*> JIM A ^ » , « ; i 10* Ml 17 fwpniJ Ttfc**o 1.1.1, ilttlttiai Klfrtoly O k t.itt^.|4| Ad«wtAMttrw«C»iifwyU.t,q,|4]nalrWyfKiJi* f-liMdil Smirti I.M. r*,i16 «Al 15* MKl) 1W t»*t* i hi, •» IW M t a .1 w.•)171/171 AOL H«lclimifltt(V.I1i^().l73 ttoyvti ttink tnt-nr*™* D i m
cnnDANCKKom
I. f?r*«snmtf « , m t f o m e n M t i t f * f jwnwlf,youf |Mlfiwrof)«ur fo*wt»M tf »pft«fi»t***, Of renrs^ (union atnayi d k w s jowr »«wt n »tih wtKtf wtrafcwi of jovr ftmttf.
1 H M W fr*l frw totjjMjfr pAf<tri4»r qwttUnt If y«« * M i . \Vnr irwllntnt taintr* art MM *f * tta*.
x n«*H*iftttoCArmMf<tm- tkkUmn«iMi(2]
4. tfjom m i U • mtitafcr, tlntf fy frwt ll wit •*•! ceatuwr.
Name ami ndrfnra thsn&r*
fit **? (hit k t* »** If y*w n««t and M dma d rfiiBi art«n ttt ft* *l p i t ef ft l« fan*. C*r*|4rUthtt e^x I* tf* drWh ira iwt iSw*! er ire IneerTwi
V n i r i u i m Mr D M n D M k i Q M i Q
tnUlh L~L- J
SyrniitttL 1 J I. 1 L J 1_ . . . , „ l 1 1 1 1 1 1 1
LI LI 1 LLL «-. 1 1 1 1 1 1 1 1 CM. LLLLI LLL
JJ LI LI L 1 1 1 1 1 1 1 .LI LI LI 1
1 I I 1 I I 1 J L L L L L L
1.1 1 1 1 LLLLLI
1 LI 1 1 I I 1 1 1 LLLLLI
A r * you?
M a r r M O / O S l i g t l U a l«v*rrr«W*p«r«trd 0) D WMflmrdWO IMniThpthrr « 0
Ydtirpattntr't-naniri M r O Mr*D Mtu O M$D
I I I
.—I I I I I I I I I I I I I I I I I I I I I What art Iht d i l n of hlrth oft V M Pirtwr
LDLLILLJ l°MI"MM»l
K- ,>^7n(^NERAiyiNanERESTs:; ':..-,:,-.,^3
I. Meatf tick th* IHturc I n i t m t t and nelivltlet *htr n you ami your partner enjoy regularly!
{ttt«u t1<k all that tipptj)
Ait Am A Craft*
Arrtloyiei AitroMgy/llorowofc* Betting Dock ttc*cti«g Dlnjo Camping Caiwaanlns CatilojiK Shopnldj Ogar«twSmoklfi| Onona Coin/Sump Collecilng Coll«iiblti Compttltioni Computer Oamtt Concern Cookery Crosswonii/funki Cwmrnt AlTair* D I Y
Dating Out Fathion Po^bdl Pooli FofcignTra«l Further EcacaikMj Gardening Grandchildren Health Food* Home Baling
M O J2 0 01 Q JJ O OtU 340
« a ssa
ISO 48 0 19 O 49 0 20 D SO O 210 J / O M O S2 0 2 J 0 5 J 0 WO 5^D 25 O S5 0
Home Computing Kninlng/ScwJflg LiveSfwitlvrntt Mc«'tlM.lmS Motoreyclct Motoring Muifc'CI*?*{eaJ/Jm Muilc-rVryRock National Ixntery NM(oflilTr\t« Nature-Nlghictabt P*ck»f« llolidayi FVnonal Finance Pcti Pftowtrsptiy Plpe/Clgar Smoking Relfgkwj Activity Sclenee/Tethflolojty Stlflmprovenient Slimming Theatre The Environment Visiting Pi)b« Wttfltary Work Watching TV Watching Video* Weekend Breaks Wildlife Wine* 6i a 42 O « u <wn MO 66 G 67 0 6 4 0 69 0 70 0 710 72 0 7 J 0 74 0 ISO 76 0 770 78 0 790 80 0 81 O 910 92 0 9)0 94 0 9S0 94 0 >7 0 98 0 990 ICO 0 101 0 102 0 /WD 104 0 iosa mo 107 a 108 0 ma 110 0 mo
1 NEWSPAPERS; KOOKS & EDTJOiATIQN 2. Which of Ihc follouing newspapers do yoti/^our partner regularly read?
DAILY ' "
Daily Exprcu Daily Mail Daily Mirror Daily Record Daily Sport Daily Star Daily Telegraph Financial Times Independent ThcBiropean The Guardian The Sun The Time* W O 02 O 03 O (WO 05 0 06 O 07 O 08 O W O /oo / / o
ttD i J D WO Ptnt ISO 16 0 17 0 18 0 19 0 20Q 210 220 230 240 25 O 26 0 27 O 28 0 SUNDAY
Independent oo Sunday Mail on Sunday NewsoftheWWId Sunday Business Sunday Express Sunday Mail Sunday Mirror Sunday Post Sunday Telegraph Sunday Times Sunday Sport The Observer
J 0 O <**D
31 O 45 O 32 0 33 0 34 O 46 0 470 4SO 35 0 49 0 36 0 SO O 37 O 33C 39 O 40 O 410 420 si a 52 0 5JO 54 a SSO S6 0
\ 1 > r ^ *| 1h * » * *h' « y * )< l* ",lW j* » *,* ' * « *,l,* l,* « ' Vs«j 4 f O flrtrwt O / O -t, riM«fiWlktry««th*v«)Mird»l1|^«irvt^iii«tipip«rMliifn«f tw\f 6IU <«"»**y « n
*v |t*)«ii*wi#t«r*flfc«ffrNtiif'i4l4{ii*<t)t''4<f »t*^tr'(/tU1<»1ii»^
r>mwbjwtr« tttt»i*ttr W 1 y r « r * ^ ^ f 01 M M l ' l / / I ) ijwaVRtgtMif fff** M f.l 0 / I t / ; J} f t t t o i w i « C J M O / i n THttr«vCrrr*« W t l * » l l / ^ t l TVOWI^ etn t0 n iso
TV*t.i.i!!i«w^» it 0 ; / 0 i V T l w n * M 1 H U V I W l « M N f * r f * f « * f l O » ( ) W W « t - t 1 V / # ( J JfltJ OiVr /<» P J * O
ffHff
a a If U i » o
J»O 19 0
rn^^M wt) mo wni«Mt(^«»i».k din mn N»w«*i-witi « o rtc«t*f«vi*in wo tii*» IMD wo ^i*w « n 1. A I f yf»rtrj»#r p srliwr a wrmtwf fc( * h>n\ tfvkt
Vti f ) / U M O W.»iMCW.Mif
I , Wb»« t;y* *f Mutlf <fi | M / j « r putmr rvgutifty tlUfrt to?
r«i» rttit
a*XiVO(tn 01 n O f O Ui*iCtii<ti4
r.ny I.Uirning O K I <•# ( ) N»*A(*M#»« fttTi/C^iWry f»lCl fl^O tVn/»«lk J m <Wtl 0 1 U VW*Mp.r^(vtMi*ts* *. DayrVynwr pattnffh«tt«l*wh-frritrDr£tTTf w # 0/ U
Ift, If y*»»/)#<(r pirlntr Art s» p,rtnf>i«f* n»«r!<l )«<t tta*(• tr«*h#lflfJ?ini»tt'!n M I tr*tntag p**t'ltm4 t^f>*<«iiTi(ti»t«twl»ryMfi^itt*»*Wft Y,in 01 U fHiiKI M O
d i d
0 0 /#{) / / O / i n
//a / i n
/ w u n
M f l / I D M O
I n M n g » ' tVt#f h«f *ln*y l» hi'i» ) * « I t )fn*»r * « « r ?
<»/a M O
Frnr 01 O 11, How m«r«jp hnltdiji »bnaild# yum twnttttty tsl* f*<h ywr?
One 0 / O TWO MO Tn«-*ofw»« 0 1 0
I *. 1 la*« yo« lisdrn (tn rh* )»M ,1 )«t»% »*• am j *« eot\d4«r|ni any of the fuJtowtng typn tt k*ft>\*)1
(tff«t t th-k nil lh«t tfffyi
Activity AttrtPMM All Imclutlw AHmd
li>Jrt
<i/n
M C I
m o
Ap»rlme«t/S«lfCaMitnBAtt»**d W O AfMirmnt/Setf Catering UK M 0 Hoattflg Abroad
Camplnf CanjItUK Csranmilaf atybttsk.UK Ctlytxreak • Vjmpt Ctodi Itolkliy Abroad Coach Holiday UK Cott*ge/0tM Abwwtt CwtagaUK Crviw fly Dris1*
w o or a
M O
09 a
/ 0 D / / O / I D / I D M O / J O
/da /yo my 7»tf i#n z»a w o i / n » a « a w o 15 0 26 0 27 0 28 0 29 0 30 Q
I / O
j i a w o 34 0
( W f > | Kr-M Ahtu*t KoirtUK
/H»r*t J J D
w o
j / n UknAMouMalfuAreoaJ JJ O Motwi«j Alnt"d Motwt«g «JK PactagtlMldiyAhtiMkl PatlactHolMiyUK Rttlgton Sitting Singlet Skiing $(*s<h\lni<K\i Sommet S»n W»ltlnjm*kkbg tt^icr Sports Winter Sua « o 40 Q 41 O « o
^ J O
/#a « a 46 Q 47D 48 a 49Q so o st a Aty n>ia K G » o ^#o
5 J O
5«a
j i a
S8 0 SfO too 610 m a m o 440 no MO 67 O mu
14. Haw ym» lak*ii (tn the t«ut 2 yean) or are you cemldrring a holiday (In the nwt 11 rnofltfti) to any of the rc*lta«rir>K«lctt!itttf«ni7
Cucrnwy IrelanJ ItkofMan Tiki* CtnUitHitt 01 0 two m o 04O MO 04 a lowy Scotlaftl Walea Thkti* CwnUtrtrnt 07 O W O W O
15. U you hare fatten t% m t l i * tn thr h i t S yean * M it with my of the follow lnj[T
io a ii a no
Carnival Crotae Lino CTCCwIwUnei Cvnard Uno Prineew Cruine* oi a oia m o w o PAOCraiM* OlkntCrtlti«UtiC» Royal Caribbean Other cruise line
m a M O 07 O
os a
16. Have yw» taken (In the l « t 3 yean) or are you eonsldertng taking a hetlday Irtj
Atntratla Canada Caribbean (standi India Singapore South Africa
010 07 0 02 0 030 04 O mo 06 a 08 0 09O 10 0 110 13 0 Sooth America Thailand Other Far Ea»t
USA -Eau Coast Wert D m i Ilflfida
Tifrn Cemldtting 13 0 19 O 14 O 15 0 WO 17 O / J O
IO a I / O 22 0 2JO 24 D 17. Have you taken (In the tut 3 yean) or wovtd you consider taking (In the next 1 yran), a
ftrry/hwtrtraft or rati link to any of the following destination*?
Ta*e» C«nM*Hng 7>*eit ContldeHnt Belgium 0 / 0 05 D Northern Ireland 09 O ISO Channel Wand* 02 O 06 O Republic of Ireland 10 0 14 0 Franco 03 O 07 O Scandinavia // D H O Holland 04 0 C8 0 Spain 12 0 16 O IS. Which fcrry/hovcrtraft or rail link setrlecf*) have you previously wed?
BAlLlne 01 0 Le Shuttle 05 O Brittany Ferrk* 02 O P&O European I'crriei 06 O Euroaiar 01 0 Siena Sealink 07 O lloverspced/Seaeal 04 0 Other 0«t O 19. Hove many time* have you/your partner flown oaimsferil in the last 2 year*?
You Plrtr You Prnr You ftnr 1-5times 010 02 O 6.|0times 03 O 04 O More than 10tin** OS O 06 O W, Have you/yonr partner travelled to the USA ojtjJjuiij«s$ In lite last 3 year*? KM Ptnr
01 O 02 O 21. Do you own/part own or would you consider buying on overseas properly In any of the following? Own ContUtring 0*n Cctuidttiitg Own CoatSdtritig Canary Islands 01 O W O Florida 07 O 10 0 Malta 13 D /tf O Caribbean 02 O 05 O France OJ O / / 0 Portugal « O /7 O Cyprus O J O 0 * 0 Italy 09 O « 0 Spain inc. Balearic* 15 O 18 0 22. Do you currently own or are you considering buying a TJmeshsD: properly?
Camnttf Considering Cumntlf Considering own baying <nen buying IntheUK 0 / D 02 0 Abroad OJ O 04 O
widest range of purchases (from cars to pet food), leisure pursuits (for example, theatre, fitness), activity patterns (such as propensity to take weekend breaks), health (for example, asthma, backaches), and travel opportunities (for example, details of transport, regular and occasional trip-generating behaviour). These vivid depictions of what is going on in modern Britain stand in increasingly stark contrast to conventional census sources, with their tired socioeconomic classifications (Snowdon, 1998) and all-but-irrelevant surrogate income measures. Lifestyles data are widely used in mail marketing activity and as a basis to 'one-to-one' marketing (Peppers and Rogers, 1997; such activities are arguably more ethnical than area-based targeting, insofar as lifestyles survey respondents often have the option to withhold their address from marketing activities).
In this fast-changing context, lifestyles data offer a number of potential advantages over conventional geodemographic indicators, not only in direct mailings to respon-dents but also as the basis to area-based generalisations. Yet the negatives associated with such sources are manifold. Some are basic to the design used to mail out questionnaires and are transparent in the analysis of lifestyles data. One such con-sideration is the common practice of excluding houses in multiple occupation, because residents of such properties tend to be low consumers and in any case are less likely to generate responses because of their high propensities to move. Other problems are more insidious and arise out of the voluntary basis to completion and reliance upon the postal questionnaire survey instrument (characterised by highly variable and unsys-tematic response rates, incomplete returns, misunderstanding and misinterpretation, etc; Dixon and Leach, 1977). These latter considerations make it doubtful whether lifestyles data are representative of the characteristics and habits of the survey respon-dents, never mind the broader populace of nonrespondents. Some of the characteristics of lifestyles data vis-a-vis conventional geodemographics are summarised in table 1.
Taking these considerations together, there is a number of respects in which life-styles data may provide much better digital depictions of human activities and may allow GIS representations to move beyond the static mosaic metaphor of conventional social area analysis. Yet the principles and practice of lifestyles data collection are
Table 1. Some characteristics of geodemographics and lifestyles date in the United Kingdom.
Geodemographics data Lifestyles data
Unit of aggregation Population coverage
Sampling
Consumption or behaviour indicators
Compatibility with postcode geography
Frequency of update
Bias
Census ED
100% or 10%, depending on variable
100%o or 10% random sample Indirect
70-80% (using ED-to-postcode directories) Decennial
The 'missing millions' of the 1991 Census
Household or individual 10.8%
Self-selecting More direct
Perfect
Dependent upon data warehouse priorities, but like to be frequent Part quantifiable if we know
Towards a new digital data infrastructure Tor urban analysis and modelling 861
transparently unscientific. Thus the emergent digital data infrastructure provided by lifestyles data may be contemporary and relevant but it is set on far shakier foundations than those of the census and other large-scale public-sector surveys. Lifestyles data sets are data rich, in terms of the number of variables they contain and their relevance to measuring a diversity of lifestyles from hobbies to holidays. But the standards used in the assembly of these data sets fall far short of those required by the linear project design* of conventional survey research (Goodchild and Longley, 1999).
If lifestyles data are profoundly unscientific in their collection, is there any contri-bution that they are likely to make to the geographical analysis of social conditions? And if so, might the richness and diversity of social characteristics that they depict make an important contribution towards new attempts at system-wide urban model-ling?^ Any revitalised systematic analysis of the form and functioning of urban social areas must be founded upon appropriate data models of the spatial form of the city and the constellation of human activities that take place within it. Yet conventional public-sector sources are unlikely to keep pace with the fragmentation and diversity that characterises postindustrial societies—indeed governments sometimes seem to lack the will even to maintain the sedate pace of renewal of conventional public-sector data infrastructure.
We do not concur with those commentators (see Curry, 1995) who have suggested that digital depictions of geographical reality can never provide meaningful abstractions. Geodcmographic 'cocktails' of census data retain enduring popularity in modelling numerous short-term aspects of consumer behaviour (Birkin, 1995), and repeat purchas-ing by industry provides ample evidence that they have an important niche role to play. Indeed they arc today used in a wider range of business and service planning contexts than ever before (for example, monitoring access to university education; Batcy et al, 1999; Utley and Thompson, 1999). But the domain of their application is ultimately limited by the constraints governing content, organisation, and dissemination of national censuses. In contrast, lifestyles databases are up-to-date, relevant, but of dubious scientific validity. Taken together, a best course might require us to identify the degree to which lifestyles data are representative of populations at large, in order that we might identify the applications domains within which data-rich models of spatial distributions might be developed as a precursor to further generalised analysis. In the next section we begin to explore the characteristics of a major lifestyles data set to begin to identify whether lifestyles data are sufficiently robust to be considered part of the new digital infrastructure of urban analysis.
4 Lifestyles in Bristol, United Kingdom
Despite the remarkable developments in data capture, warehousing, and application in recent years, there are very few documented examples of linkage of lifestyles data to 'framework' data (Rhind, 1997), such as the census, in any systematic manner (but see Birkin and Clarke, 1995, pages 372-384). We are unaware of any substantial scientific analysis of the content and coverage of lifestyles data—although there has been some informed speculation as to the relative merits of lifestyles and geodemographic analysis (Birkin, 1995; Cosijn and Brown, 1993a; 1993b). This is a glaring omission from the literature, and testimony to the gulf that presently divides data modelling research and practice. Any first attempt to begin to resolve this must necessarily be preliminary and here we will develop a four-point investigation of the feasibility of using lifestyles data
(3) One approach to these questions has been the suggestion that large and complex data sets
in urban modelling. Given the vagaries inherent in the collection of lifestyles data, our approach will seek to anchor lifestyles analysis to the framework provided by conven-tional sources—that is, census data and their geodemographic derivatives. As has been suggested above, conventional geodemographics had developed considerably over the last twenty-five years and some of these developments have also entailed additional assumptions. Thus, in addition to establishing the credentials of lifestyles analysis, we will also begin to examine the relative strengths of the assumptions made in contem-porary geodemographics versus lifestyles approaches. Thus we will adopt a four-stage preliminary assessment of the scope for urban modelling by using lifestyles data. (1) We assess the degree to which a lifestyles database might be 'anchored' to 1991 Census data. The census framework provides a potential means of justifying (subject to caveats) the development of household classifications based on lifestyles data— which are likely to be richer and more up-to-date than their existing geodemographic counterparts. Our case study will also seek to establish a basis to generalisation across the wider British system.
(2) We carry out a cluster analysis of lifestyles data and compare the results with a more conventional (SuperProfiles) geodemographic classification.
(3) We investigate the degree of heterogeneity within small (census enumeration district) areas—in order to gain an idea of the fission of consumption activities within small areas and quantify the likely implications for conventional geodemographics.
(4) We compare the detail of the clustered lifestyles data with the 'pen portraits' devised for the 'freshened up' SuperProfiles geodemographic system—as a preliminary assess-ment of the validity and accuracy of descriptive labels that are not integral to the classification schema and which are vulnerable to scale and aggregation biases.
4.1 Lifestyles: a national and regional snapshot
The case-study data form a subset of a database collated from responses to a national postal questionnaire survey undertaken by a commercial data-warehousing company during September to October 1996. The questionnaire, which took about twenty min-utes to complete in full, was mailed to addresses recorded on the February 1996 British Electoral Register (which was based on residence information as at 10 October 1995). One survey was mailed to each address, apart from: addresses with more than three different surnames per register entry (that is, those properties deemed to be houses in multiple occupation, HMOs); and those who opt out from receiving 'mail drops' through the Mail Preference Scheme. Wherever possible the questionnaires were addressed to females or to respondents to previous questionnaires. In total, 20 million questionnaires were mailed across Great Britain, of which approximately 2 million were returned, a response rate of approximately 10%.
The data warehouse anticipates that such surveys will disproportionately enumerate people who are 'mail responsive'. The characteristics of this population, which form the lifestyle database (henceforth, 'lifestyle population'), will therefore likely differ from the 1991 Census-enumerated population (henceforth, 'Census population'). Identification of response bias is difficult to disentangle from sample bias created through exclusion of HMOs and Mail Preference Scheme opt outs, as well as changes in population charac-teristics between 1991 and 1996. Nevertheless a crude comparison of the age profile of the lifestyles survey with that of the census (table 2) makes the underenumeration of young adults very apparent. Table 3 illustrates the relative underenumeration of individuals living in terraced properties or flats, in contrast to the relative overenumera-tion of those residing in semidetached property.
Towards a new digital data infrastructure for urban analysis and modelling 863
'Hibte 2. National age profile of lifestyle and census populations (source: authors' calculations based on data supplied by the lifestyles data company).
Age group Lifestyles Percentage
18 24 25 34 35-44 45 54
55 64
Over 65 Total
100 531 545 143 574076 519 389 420817 560 146
4 20 21 19 15 21
2 720 102 100
Census
5 614045 8 361463 7 665 001 6 371795 5 662 670 8 811230
42486 204
Percentage
13 20 18 15 13 21
100
Difference
-9 0 13
•1-4 -1-2
0
Tabic 3. Great Britain property types: lifestyles and 1991 Census analysis (source: authors1 own
calculations based on data supplied by the lifestyles data company).
Lifestyles Percentage Census Percentage Difference
Detached Semidetached Terraced
Flat or maisonette
Total
307 704 613 897 449 203 284307
1 655 111
19 37 27 17
100
4383 168 6481705 6 343 156 4 389 770
21597 799
20 30 29 20 100
-1
..,-7
-2 _3
73 310 individual and adult respondents to the lifestyle survey in this region, from 51882 households. The data were supplied in a form that allows the location of the house-holds to be identified to the level of the unit postcode (for example, BS8 1SS). Unit postcode geography is not coincident with that of the 1991 Census in England and Wales and so it was necessary to use the 1991 and 1995 enumeration district-to-post-code directories to obtain an approximate match (see Martin, 1992). In practice, where a 'postman's walk' (the basis of definition of UK unit postcodes) is identified as cross-ing the boundaries of one or more EDs, then the postcode was deemed to be located in the 'pseudo-ED' in which the directories deem the majority of the postcode population to lie. Approximately one quarter of unit BS postcodes cross ED boundaries, although this does not create any problems if the two or more EDs share common attributes (such as the same geodemographic category, which is assigned at the ED level). Never-theless the mismatch between census and postal geographies creates ambiguity in assigning SuperProfile classes to addresses in 15% of all BS unit postcodes.
Table 4. Regional and national enumeration district breakdowns according to SuperProfiles cluster [source: the SuperProfiles (SP) ten-cluster typology, after Brown and Batey (1994) and the 1991 UK Census].
Cluster (economic rank) Percentage in
study region Percentage in Great Britain Percentage in England and Wales
Percentage in England and Wales (not London)
Affluent achievers (SP1) Thriving greys (SP2) Settled suburbans (SP3) Nest builders (SP4) Urban venturers (SP5) Country life (SP6) Senior citizens (SP7) Producers (SP8)
Hard-pressed families (SP9) The 'have note' (SP10) Pearson correlation
10 13 12 18 11 2 8 16 3 5
10 11 12 16 10 3 7 12 8 12
0.79
10 12 12 16 10 3 6 12 7 11
0.85
10 13 12 18 6 3 7 13 8 10
0.82
a figure that is broadly in line with the results of National Office of Survey trials for an income question in the 2001 Census.
Table 4 compares the incidence of the ten SuperProfiles geodemographics categories in the study region with some broader aggregations. Bristol and environs is broadly representative of the broader national picture, as indicated by the Pearson correlation coefficients, although the lower status' SuperProfiles (clusters SP9 and SP10) are under-represented in the study region. The smallest category in the national classification (cluster SP6) is also underrepresented in and around Bristol. This finding is also substantiated by reference to other composite geodemographic sources (CACI Informa-tion Services, 1998; see also Harris, 1998). However, the characteristics of the lifestyle respondents differ from those recorded in the 1991 Census, and only part of the observed discrepancy can be attributed to the five-and-a-half year interregnum between the census and completion of the lifestyle survey. We have chosen not to try to estimate the extent to which this is a consequence of excluding households in multiple occupation from the lifestyles survey, as the necessary grossing would risk committing ecological fallacy. Figure 2 shows the percentage of the regional populations of each lifestage group according to the lifestyles data set and according to the census. It is apparent that, as with the national picture, it is the young who do not return lifestyle questionnaires. As Rae (1998, page 6) has commented, referring to the data of figure 2, "groups that are equally common in the population[-at-large] have radically different representation
• Lifestyles population • Census population
18-24 55-64 45-54 35-44 25-34 over 65 Age, years
Towards a new digital data infrastructure lor urban analysis and modelling 865
Detached Semidetached Terraced Renting
Figure 3, Comparative analysis of numbers of *BS6' households in particular property types and tenure, estimated by using the lifestyles data and the 1991 Census.
in lifestyle data"—compare the 18-24 and 5 5 - 6 4 age bands, for example. Such differ-ences could lead to misleading area profiles (see figure 3; and for further details sec Harris, 1998).
4.2 Classification of a lifestyles data set
An iterative cluster analysis was developed by using the lifestyles data at the household level (for details, see Harris, 1998). The household 'response rate' for the survey was 16%. As with the creation of conventional geodemographic clustering, the outcome of clustering obviously depends upon the range and type of variables included in the analysis (Openshaw, 1996). We used 241 variables, chosen to represent a wide range of socioeconomic characteristics and behavioural information, as the basis for a clustering procedure. The cluster program performed best when the data were divided into sixteen clusters. The characteristics of the sixteen clusters are summarised in tables 5 and 6.
Table 5. Variables used in the formation of the household typology. Type of variable Number of variables Age of household member
Alcoholic beverages consumed
Children: number in household and age Consumer goods owned
Daily newspaper read Household income
Financial investments and plans Gender
Have credit cards, store cards, etc Hobbies and pastimes
Holiday choices
Home improvements made Home type, tenure, and value Household size
Illnesses
Duration of residence Mail order purchases Marital status Charity support
Number of cars owned, make, and value Smoking
Social-economic group Supermarkets regularly visited Other
and so forth. O n average, across the sixteen clusters, any one household value would share the same (yes or no) value as its cluster for 84% of the 241 variables. As with any cluster analysis, this does n o t necessarily represent the optimal solution b u t an opti-mised solution. It is also important that the results of the cluster analysis m a k e sense in substantive terms.
4.3 Lifestyles and geodemographics: competing or complementary classifications?
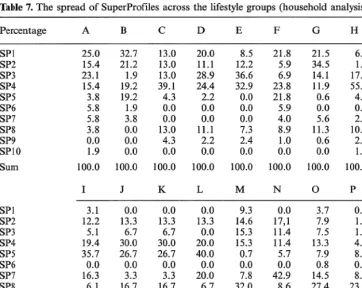
The results of the lifestyles classification were aggregated into E D s in order to facilitate comparison with the ED-scale SuperProfiles for the study region. With regard to the lifestyles data, E D s were given the lifestyles descriptor which pertained to the largest absolute number of households in the ED. Table 7 (see over) shows how households in each SuperProfile category are spread across the sixteen lifestyle groups; a n d table 8 (see over) shows the spread of each lifestyle category across the SuperProfile categories, (x2
analysis confirms that lifestyle groups are not uniformly distributed across all the Super-Profile categories; H a r r i s , 1998.) These tables suggest strong correspondence between the two classifications, with m o s t SuperProfile categories being spread out between two or three lifestyle categories, and vice versa. This is a n important finding, on at least two counts. First, the representation of all SuperProfile groups in some shape or form suggests that there are n o gaping holes in the classification (arising particularly because of the underrepresentation of the young in the lifestyles survey). Second, it follows that classifications that are richer than conventional geodemographics can be built at disaggregate scales.
Differences between the two classifications are likely to have arisen from the following, alone or in combination.
Towards a new digits*! data infrastructure for urban analysis and modelling 867
Table 6. The sixteen consumer clusters (summarised).
Cluster Percentage" Summary
L M N 0 P
4 11 5 11 6
A 5 Wealthy older couples in upgraded homes and with diverse financial investments that afford many pastimes and regular holidays
0 4 Computer-friendly couples and families with financial provision for retirement. Church attendees with interest in the arts
C 3 Comfortable couples living in improved homes with PCs and satellite TV. Suffer from aches and pain and holiday in Uhe Med*
D 5 Comfortable city-dwelling (older) couples, Long-time residents of improved homes, within which their interests are pursued E 6 Younger couples and families living in improved semidetached
properties. Holiday in the United Kingdom on camping and caravan trips
F 7 Other couples in owner-occupied properties and with no children G 8 Affluent retired couples living in upgraded (city) homes. Diverse
financial investments afford overseas and UK holidays
H 7 Younger and middle-aged couples in improved homes. Financially comfortable with provision for retirement. Have home PCs and gamble upon the Pools or National Lottery
1 5 Young outgoing singles. Have active social lives and often frequent holidays
J 6 Couples and families taking few holidays and gambling upon the Pools or National Lottery. Do not smoke
K 5 Mail-order responsive, lower-income couples residing in the city. Suffer from stress or other aches and pains. Smoke
Female residents living alone and with home-based interests Low-income retired couples
Elderly female widows Other lonc-fcmalc households
Low-income, single females and single mothers, living in housing association or local authority properties
» Percentage of Bristol population.
(a) Inherent differences in the data—that is, differences arising out of the different constructs measured in the data sets, temporal changes between the two surveys, and the effects of response and sampling bias in the lifestyles data set.
(b) The effects of aggregation—as Birkin (1995) has pointed out, geodemographic classifiers may be misleading if used to suggest that ED labels pertain to every house-hold within each classified ED, because this is patently almost invariably not the case in reality. This is an inherent problem in geographical classification and analysis, which is only ultimately resolvable through recourse to individual or household units of analysis (Openshaw, 1984). Information has been discarded in the compilation of tables 7 and 8, in that a simple 'highest count' rule has been used to label every ED with a lifestyle category.
Table 7. The spread of SuperProfiles across Percentage SP1 SP2 SP3 SP4 SP5 SP6 SP7 SP8 SP9 SP10 A 25.0 15.4 23.1 15.4 3.8 5.8 5.8 3.8 0.0 1.9 B 32.7 21.2 1.9 19.2 19.2 1.9 3.8 0.0 0.0 0.0
c
13.0 13.0 13.0 39.1 4.3 0.0 0.0 13.0 4.3 0.0the lifestyle groups (household analysis). D 20.0 11.1 28.9 24.4 2.2 0.0 0.0 11.1 2.2 0.0 E 8.5 12.2 36.6 32.9 0.0 0.0 0.0 7.3 2.4 0.0 F 21.8 5.9 6.9 23.8 21.8 5.9 4.0 8.9 1.0 0.0 G 21.5 34.5 14.1 11.9 0.6 0.0 5.6 11.3 0.6 0.0 H 6.3 1.0 17.7 55.2 4.2 0.0 2.1 10.4 2.1 1.0 Sum 100.0 100.0 100.0 100.0 100.0 100.0 100.0 100.0
I J K L M N O P
SP1 SP2 SP3 SP4 SP5 SP6 SP7 SP8 SP9 SP10 Sum
Table 8. The
Percentage SP1 SP2 SP3 SP4 SP5 SP6 SP7 SP8 SP9 SP10 SP1 SP2 SP3 SP4 SP5 SP6 SP7 SP8 SP9 SP10 3.1 12.2 5.1 19.4 35.7 0.0 16.3 6.1 2.0 0.0 100.0 0.0 13.3 6.7 30.0 26.7 0.0 3.3 16.7 0.0 3.3 100.0 0.0 13.3 6.7 30.0 26.7 0.0 3.3 16.7 0.0 3.3 100.0 0.0 13.3 0.0 20.0 40.0 0.0 20.0 6.7 0.0 0.0 100.0 9.3 14.6 15.3 15.3 0.7 0.0 7.8 32.0 2.8 2.1 100.0 0.0 17,1 11.4 11.4 5.7 0.0 42.9 8.6 0.0 2.9 100.0 3.7 7.9 7.5 13.3 7.9 0.8 14.5 27.4 7.9 9.1 100.0 0.0 1.9 1.9 4.8 8.7 0.0 8.7 23.1 14.4 36.5 100.0
Towards a new digital data infrastructure for urban analysis and modelling 869
5 10 15 Number of different lifestyle clusters present
Figure 4. The number of household consumer types per enumeration districts (KDs).
Table (>. The degree of heterogeneity of enumeration district (HI)) lifestyles, according to
Super-Profile category.
Number of EDs 1 Affluent achievers 153 Thriving greys 191 Settled suburbans 187 Nest builders 289 Urban venturers 123 Country life 12 Senior citizens 125 Producers 255 Hard-pressed families 55
The 'have-nots' 71 Note:
1, least heterogeneous (8 or less household types per ED); 2, (9 to 11 household types);
3, ' (12 to 14 household types);
4, most heterogeneous (15 or more household types per ED);
5, table includes only the 1461 (of 1568) EDs in which 17 or more households were enumerated by the lifestyles survey.
1.3 4.2 l.l 0.3 13.0 8.3 9.6 2.0 3.6 25.4
22.2 29.8 17.1 19.0 41.5 66.7 35.2 29.4 47.3 54.9
68.0 54.5 62.0 56.4 43.1 16.7 45.6 58.0 43.6 18.3
8.5 11.5 19.8 24.2 2.4 8.3 9.6 10.6 5.5 1.4
4.4 'Pen portraits': an outline appraisal
The classification typology developed above is grounded in data and, the vagaries of the conduct and response to the lifestyle survey aside, in an analytical rigorous way. The more recent geodemographic systems have sought to 'freshen up' census-based classifications with reference to ancillary data sources that are more recent, relevant, and detailed with respect to consumer behaviour. Such sources have variously included the General Household Survey, Family Expenditure Survey, National Readership Survey, and a range of service industry sources. This potentially brings a wealth of detail to geodemographic classification, although not at the fine spatial scales for which classifiers are used to discriminate behavioural types—indeed they are rarely capable of statistically valid comparison at finer spatial scales than the district level. Thus, in practice, ancillary sources remain external to the classification procedure but are used to provide 'thick descriptors' of the classification ex post facto. Of course this procedure is inherently unscientific and potentially introduces a number of scale and aggregation-induced effects into the interpretation of classifications.
Yet words are more seductive than numbers and the resulting 'pen portraits' add intuitive plausibility to classifications. We can see this, for example, in the SuperProfiles category of 'Affluent Achievers':
"High income families with a lifestyle to match. Detached houses predominate,
reflect-ing the professional status of their owners. Typically livreflect-ing in the stockbroker belts of the major cities, the Affluent Achiever is likely to own two or more cars, which are the top of the range, recent purchases, and are needed to pursue an active social and family life.
Affluent Achievers have sophisticated tastes and aspirations. They eat out regularly,
go to the theatre and opera and take an active interest in sports (such as cricket,
rugby union, and golf). They are able to afford several expensive holidays every year.
Financially aware, with a high disposable income, this group invests in both quoted and privatised companies. They are likely to use credit and charge cards and are likely to have private health insurance. Investments are followed closely in broadsheets,
such as The Financial Times, The Times, and The Telegraph. For more leisurely reading, Hello, Harpers & Queen, and Vogue are likely to be found in the home of the Affluent Achiever" [source: promotional literature (cited by Brown and Batey (1994). Italics added to highlight similarities with table Al].
Hyperbole aside, this pen picture accords with the characteristics of type A con-sumer group identified in the lifestyles classification shown in table Al. This suggests superficial correspondence between the lifestyles and geodemographic classifications, yet conceals a more heterogeneous reality. Of the 231 high-concentration EDs for consumer type A, 60 (26%) are found in SP1, another 48 (21%) are in SP2, and an absolute majority (53%) of such households are scattered across the remaining eight clusters! Further, a 'high concentration' need mean only that about 10% of the con-sumer-classified households within the ED are of consumer type A. It would thus be fallacious indeed to characterise the whole ED area as this consumer type when 90% of the households are of a different consumer type. The magnitude of these differences suggests that lifestyles analysis should be used to supplement, even replace, conven-tional geodemographic typologies.
5 Discussion
Towards a new digital data infrastructure for urban analysts and modelling 871
activity patterns. These deficiencies have become more apparent over time, as the scale, complexity, and diversity of society has increased, and have resulted in two dominant views of urban modelling in the research community. First, some formal urban analysis has 'carried on regardless*, yet today undoubtedly accounts for a much reduced real share of intellectual activity in academic geography and planning. Second, some critics have suggested that digital data and urban models can never be up to the task of generating understanding of real-world problems and that the research effort should be channelled into other (by implication, more idiographic and/or small-scale) approaches. Thus academic discourse has become increasingly polarised between those who cling to lingering but increasingly marginal scientific certainties about data and those who refute the notion of any valid domain for quantitative analysis.
However, a third course is developing, as a result of the explosion in the extent and availability of digital data and the improvement in geographical data-handling technol-ogies. This is based on the view that technology does not just cause consumption to fragment but it also empowers us to provide ever richer depictions of the diversity of population characteristics and behaviour within city systems. This is very much the view advocated in this paper and is also consistent with microsimulatton approaches (Clarke, 1996). Indeed, following Johnston (1999), we suggest that data-rich GIS-based model building may be poised to move beyond the 'mosaic metaphor' which has governed almost all applications of GIS to date towards more convincing depictions of variety in space and time that arc consistent with new theory. Description coming before theory is the normal pattern in science and the spirit of what we have described here is very much that data models can be made sensitive to context without sacrificing generality. Such an approach is also consistent with a reinvigoratcd contribution to rational planning policy.
A problem with this view is that the foundations to data-rich analysis, at least those explored here, are clearly unscientific. Yet our tentative empirical investigation has suggested that clear commonalities may be established between 'framework' data, such as the census and geodemographic systems, and new, relevant, and timely life-styles data. We believe that application of concatenation and conflation procedures (Longley and Goodchild, 1999) to lifestyles data sets offers the prospect of creating vastly enhanced data models of the form and functioning of urban systems. Such models will need to manage error and bias and this may cause some unease in a modelling community that has been more focused on statistical formalism than messy empirical data problems. The social theory fraternity will doubtless be able to identify aspects of anecdotal historiographies that cannot (yet) be represented in digital form. But real-world business and service planning is already embracing the use of such data series and is using lifestyles data as successfully as their geodemographics forbear. The linear project design of conventional social scientific research was never a panacea in practice (Goodchild and Longley, 1999) and the subsequent flight to untested social theory has done much to marginalise academic contribution to rational planning policy. Today's digital data infrastructure is not by any means perfect but it has much to offer a reinvigorated approach to urban modelling.
Acknowledgements. The authors are very grateful to a lifestyles data company for the supply of
References
Batey P W J, Brown P J B, 1995, "From human ecology to customer targeting: the evolution of geodemographics", in GISfor Business and Service Planning Eds P Longley, G Clarke (Geolnformation International, Cambridge) pp 77 -103
Batey P W J, Brown P J B, Corver M, 1999, "Expanding participation in higher education: a geodemographic analysis of recent experience in the English regions" Journal of Geographical Systems forthcoming
Batty M, 1981, "Urban models", in Quantitative Geography: A British View Eds N Wrigley, R J Bennett (Routledge and Kegan Paul, London) pp 181 -191
Batty M, Longley P, 1994 Fractal Cities: A Geometry of Form and Function (Academic Press, London) Batty M, Longley P, 1997, "The fractal city" Architectural Design Profile 129 74-83
Beaumont J R, 1991 An Introduction to Market Analysis, in the Concepts and Techniques in Modern Geography series, number 53 (Environmental Publications, Norwich)
Birkin M, 1995, "Customer targeting, geodemographics and lifestyles approaches", in GISfor Business and Service Planning Eds P Longley, G Clarke (Geolnformation International, Cambridge) pp 104-149
Birkin M, Clarke G P 1995, "Using microsimulation methods to synthesize census data", in Census Users' Handbook Ed. S Openshaw (Geolnformation International, Cambridge) pp 363-387 Brown P J B, 1991, "Exploring geodemographics", in Handling Geographical Information
Eds I Masser, M J Blakemore (Longman, Harlow, Essex) pp 221 -258
Brown P J B, Batey P W J, 1994, "Characteristics of Super Profile lifestyles and target markets: index tables, pen pictures and geographical distributions", Super Profile Technical Note 2, Urban Research and Policy Evaluation Regional Research Laboratory, University of Liverpool, Liverpool
CACI Information Services, 1998 The Geodemographic Pocket Book (NTC Publications, Henley-on-Thames)
Clark B D, Gleave M B (Eds), 1973 Social Patterns in Cities Institute of British Geographers Special Publication 5 (Institute of British Geographers, London)
Clarke G P (Ed.), 1996 Microsimulation for Urban and Regional Policy Analysis (Pion, London) Cole K, 1993, "The 1991 local base and small area statistics", in The 1991 Census User's Guide
Eds A Dale, C March (The Stationery Office, London) pp 201 -247
Cosijn P N C , Brown P J B, 1993a, "Comparison of an individual level and an aggregate level market analysis system: performance of the lifestyles selector and Super Profiles classification. Part 1: Sources and classification of data" Journal ofTargeting, Measurement and Analysis for Marketing 1 257 - 272
Cosijn P N C , Brown P J B, 1993b, "Comparison of an individual level and an aggregate level market analysis system: performance of the lifestyles selector and Super Profiles classification. Part 2: Discriminatory and penetrative power" Journal of Targeting, Measurement and Analysis for Marketing 1 355 - 365
Curry M R, 1995, "GIS and the inevitability of ethical inconsistency", in Ground Truth: The Social Implications of Geographical Information Systems Ed. J Pickles (Guilford Press, New York) pp 6 8 - 8 7
Dixon C, Leach B, 1977 Sampling Methods for Geographical Research Concepts and Techniques in Modern Geography series, number 17 (Geo Books, Norwich)
Flowerdew R, Leventhal B, 1998, "Under the microscope" New Perspectives 18 36 - 38 Goodchild M F, Longley PA, 1999, "The future of GIS and spatial analysis", in Geographical
Information Systems: Principles, Techniques, Management and Applications Eds P A Longley, M F Goodchild, D J Maguire, D W Rhind (John Wiley, New York), volume 1, pp 567-580 Goss J, 1995, "Marketing the new marketing: the strategic discourse of geodemographic information
systems", in Ground Truth: The Social Implications of Geographic Information Systems Ed. J Pickles (Guilford Press, New York) pp 130-170
Harris R, 1998, "A comparative analysis of a lifestyle and geodemographic typology", WP-2, School of Geographical Sciences, University of Bristol, Bristol;
http://www.bitsmart.com/geodemographics
Harvey D, 1973 Social Justice and the City (Edward Arnold, Sevenoaks, Kent)
Johnston R J, 1999, "Geography and GIS", in Geographical Information Systems: Principles, Techniques, Management and Applications Eds P A Longley, M F Goodchild, D J Maguire, D W Rhind (John Wiley, New York), volume 1, pp 39-47
Towards a new digital data infrastructure for urban analysis and modelling 873
Longlcy PA, Goodehild M !\ 1999, "Modern geographic information systems and model linking"; copy available from the author
Marsh C\ 1993, "The validation of census data: general issues", in The 1991 Census User's Guide Eds A Dale, C March (The Stationery Office, London) pp 155 167
Martin D, 1992, "Postcodes and the 1991 Census of Population: issues, problems and prospects" Dwisactions of the Institute of British Geographers, New Series 17 350 357
Moscr C A, Kalton G, 1993 Survey Methods in Social investigation second edition (Hctncmann, Oxford)
Openshaw S, 1984 The Modifiable Areal Unit Problem Concepts and Techniques in Modern Geography series, number 38 (Geo Books, Norwich)
Openshaw $, 1996, "Developing GIS-rclcvant spatial analysis methods", in Spatial Analysis: Modelling in a GIS Environment Eds P Longlcy, M Batty (Geolnformation International, Cambridge) pp 55 - 73
Openshaw S, 1998, "Building automated geographical analysis and explanation machines", in Geocomputation: A Primer Eds P A Longley, S M Brooks, R McDonnell, W D Macmillan (John Wiley, Chichester, Sussex) pp 95-115
Pacionc M, 1999 Applied Geography (Routlcdgc, London)
Peppers D, Rogers M, 1997 The One-to-one Future: Building Business Relationships One Customer at a lime (Piatkus Books, London)
Rac J, 1998,"Why do you have to mix lifestyle and census data?" Marketing Systems 'Today 13 6 - 7 Rhind D, 1997 Framework for the Wfor/t/(GcoInformalion International, Cambridge)
Saycr R A, 1979, "Understanding urban models versus understanding cities" Environment and Planning A 11853-862
Snowdon R, 1998, "New system could spell end for ABCs" The Times 15 November, page 31 Staplcton C M, 1980, "Reformulation of the family life-cycle concept: implications for residential
mobility" Environment and Planning A 12 1103- 1118
Timms D, 1969 The Urban Mosaic: Towards a Theory of Residential Differentiation (Cambridge University Press, Cambridge)
APPENDIX
How to read the table
Taking the 18-24 age group as an example, a global mean of 2% of households per cluster are shown (by the lifestyles data) to have an adult aged 18-24 years resident. [Here 100 is an index value assigned to the global mean (GM) across all the clusters for
a given variable.] These young adults are concentrated within cluster I: 'y°u ng outgoing
singles'. This cluster has 6.5 times (650/100) the average proportion of young adult households, so 13% (650/100x2) of households in cluster I have a person aged 18-24 resident. By comparison, cluster N ('elderly female widows') has no young adult house-holds. Instead, there is an above-average proportion of households with at least one member aged 65 or above.
Table Al
G M A B C D E F G H I J K L M N O P
Age
18-24 years 2 2 5 - 3 4 years 19 3 5 - 4 4 years 22 4 5 - 5 4 years 21 5 5 - 6 4 years 17 65 or above 24
Gender Female 80 in household Male 66 in household Marital status Couple 59 Divorced 11 Single 16 Widowed 8 Household size
1 adult 20 2 adults 54 3 adults 10 4 adults 4
Children
No children 62 1 child in household 9 2 children 12
in household
3 children 4 in household
4 children 1 in household
Age
0 - 4 years 9 5 - 1 0 years 13 1 1 - 1 5 years 11
Economic status Employed 47 Self-employed 8 Unemployed 4 Student 1 Retired 32
Family income per annum Under £5000 10 £5 000-£9 000 14 £10000-£14900 15 £15000-£19900 12 £20 000-£29 900 18 £30 000-£39 900 6 £40000 and above 4
0 52 127 180 182 58 0 100 186 171 88 16 50 89 145 209 117 8 50 110 136 176 117 16
108 107 110 106
131 119 113 113
140 137 130 132 54 63 81 54 43 50 50 75 25 0 12 12
35 25 35 40 125 137 116 114 140 110 160 150 175 100 225 200
117 77 108 75 100 69 188 208 200 200 108 122 125 75 100 108 100 133 125 100
77 166 88 88 76 207 92 123 136 218 136 127
138 150 25 0 93 159 212 25 200 25 163 175 50 0 21 161 150 50 100 28 10 28 80 133 177 266 350 0 14 53 91 161 316 550 10 28 66 108 166 233 37.5 10 35 86 141 172 200 250 50 152 186 142 76 4 100 131 131 128 100 12 0 0 9 42 211 283 100 210 218 109 35 0
105 90 106 107
122 112 122 128
137 122 138 138 63 63 36 63 43 93 18 43 0 12 112 0
20 25 55 30 131 124 133 144 130 110 90 80 125 150 50 75
66 188 216 200 100 101 100 116 100 100 148 11 0 0 0 46 222 291 250 100
200 100 0 288 184 115 7 261 200 100 9 245
163 175 50 100 18 155 150 75 100 18 23 50 0 0 271 172 175 25 100 6 10 28 80 141 177 216 175 10 50 93 133 127 166 175 70 178 173 100 61 33 25 10 28 93 175 200 150 100 650 236 95 61 23 4 150 163 140 123 100 16 150 157 150 142 117 29 100 110 118 95 88 37
75 101 112 111
80 127 122 21
11 130 123 15 118 63 90 345 468 75 81 212 0 0 12 125
215 30 40 350 48 133 127 25 120 100 140 60 200 100 125 50
130 66 25 25 0 88 133 141 150 200 95 133 116 175 300 108 122 91 75 100
33 177 155 55 30 138 153 107 36 127 154 118
157 87 50 600 9 153 137 125 100 28 140 137 175 100 50 80 112 100 300 50 30 50 133 150 138 133 125 30 71 120 150 127 83 75 80 128 153 150 100 66 25 140 150 140 108 72 50 7,5 0 5 9 33 135 312 0 0 0 9 52 350 150 57 54 61 76 100 450 152 109 80 70 29
98 98 92 95
121 31 62 54
135 5 50 25 27 81 145 318 25 75 131 237 87 875 200 75
45 400 100 290 133 11 328 40
70 20 80 70 50 0 75 75
140 11 8 0 0 145 0 0 0 0 54 88 58 50 100 83 177 116 175 300
0 0 66 166 7 0 76 184 18 0 72 145
Towards a new digital data infrastructure for urban analyst* and modelling 875 Property I bedroom 2 bedrooms 3 bedrooms 4 bedrooms 5 bedrooms City residence Conservatory Double glazing Fitted bathroom Fined bedroom Fitted carpets Fitted kitchen Fitted shower Loft conversion N e w driveway Occupancy
under 2 years 2 - 3 years 4 - 5 years 6 - 7 years 8 10 years 11 years or m o r e R o o f renovation Security system present Tenure housing OM 5 19 49 13 3 44 10 42 38 21 26 44 43 5 23 4 9 9 9 12 48 7 19 14 association/council owner-occupied 73 rented
T y p e bungalow detached flat semidetached terraced Value
U p to £40000 £40 0 0 0 - £ 6 0 000 £60 0 0 0 - £ 8 0 000 £ 8 0 0 0 0 - £ 1 2 0 0 0 0 £120 000 -£200 000
Financial holdings
A m c x card Children's savings C o m p a n y health
insurance Credit card Credit card debt Debit card Equity plan Funeral plan Gold card Investment trust Life assurance L u m p s u m investment Mortgage
Pay credit card bill in full Private health
insurance Private pension Regular savings Stocks or shares Store card Telephone banking T E S S A
Car details 1 car in household 2 cars in household 3 cars in household Bought n e w Bought used C o m p a n y car
G M 49 24 5 10 26 7 Insurance (per a n n u m )
under £300 over £300 M a k e
B M W
Citroen Fiat Ford H o n d a Nissan Peugeot Renault Rover Toyota Vauxhall Volkswagen Volvo Privately owned Under 3 years old
41 7 1 2 1 23 1 5 4 3 12 2 14 3 2 68 9
Consumer goods owned Camcorder
Fax machine Hi-Fi H o m e P C Internet connection Mobile phone Satellite T V
Holidays
1 overseas holiday per annum 2 overseas holidays
per annum Activity holidays C a m p or caravan Coach holidays Cruises Destination
Australia/ N e w Zealand Canada Caribbean Europe Mediterranean rest of world United Kingdom USA Lakes/mountain holidays Motoring holidays Safari holidays Self-catered holidays Skiing/snowboarding holidays Take short breaks Visit holiday camps Visit theme parks