Top quark properties using the ATLAS detector at the LHC
M.J. Costa on behalf of the ATLAS Collaboration1,a
1Instituto de Física Corpuscular - Centro Mixto Consejo Superior de Investigaciones Científicas -
Universi-dad de Valencia, Edificio Institutos de Investigación, C/Catedrático Beltrán 2, E-46980 Paterna, Spain
Abstract.
The latest measurements of the properties of the top quark using the ATLAS experiment are presented. The top quark mass is one of the fundamental parameters of the Standard Model. A new measurement using the template method in dilepton events in which the event selection was optimised to achieve the smallest total uncertainty is presented. It is combined with a measurement on a multi-dimensional template fit that can constrain the uncertainties on the energy measurements of jets. In addition, measurements aiming to measure the mass in a well-defined scheme are presented. The top quark pair charge asymmetry is an asymmetry predicted to occur beyond leading-order QCD in the Stan-dard Model, and may be significantly enhanced by the presence of new physics. Thett
production charge asymmetry is measured inclusively and differentially using the 8 TeV
ATLAS datasets in the dilepton channel and with lepton+jets events including boosted
topology. Making use of the large number of top quark pairs collected, we also present measurements of the spin correlation between top and anti-top quarks and discuss their sensitivities to new physics.
1 Introduction
The top quark is the heaviest known fundamental particle, leading to important theoretical and ex-perimental implications. The large top quark mass implies a large coupling to the Higgs boson and raises the possibility that it plays a special role in the mechanism of electroweak symmetry breaking. It also implies that the top quark decays rapidly through electroweak interactions before it can form a hadronic bound state, which provides the unique opportunity to study the properties from distri-butions of its decay products. It is therefore essential to measure with high precision the top quark properties using data from the ATLAS experiment [1] and confront them with the Standard Model (SM) predictions.
2 The top quark mass
The top quark mass is a free parameter of the SM which together with theW boson mass constrains the Higgs boson mass through electroweak quantum corrections, allowing for stringent tests of the SM. It is also an important input for the studies of electroweak vacuum stability.
[GeV] reco lb m 40 60 80 100 120 140 160
Events / 2 GeV
0 100 200 300 400
500 Data
1% background Best fit Uncertainty
ATLAS
-1 =8 TeV, 20.2 fb s
Figure 1. The reconstructedmb observable for data together with the fitted probability density functions for
background alone and for the sum of signal and background [6].
The most precise results are obtained using the template method, in particular when applied in thettlepton+jets and dilepton channels. For a chosen observable sensitive to the top quark mass
parameter (mtop), simulated distributions (templates) are produced using a number of discrete values
of that parameter. These templates are fitted to distributions that interpolate between different input
values of the top quark mass parameter. A fit to the observed data distribution is then performed to obtain the value ofmtopthat best describes data. Therefore, the mass determined with this procedure
is the mass as defined in the Monte Carlo generator. It is expected that the difference between this
mass definition and the pole mass is of order 1 GeV [2–4].
The measurement in the lepton+jets channel is performed using data from proton-proton collisions
at √s=7 TeV [5]. The mass is extracted from a three-dimensional template fit to the reconstructed
invariant mass of the hadronic top quark decay products, the invariant mass of the two jets coming from theW boson to constrain the jet energy scale uncertainty, and an observable sensitive to the relativeb-to-light jet energy scale to reduce the otherwise dominantb-jet energy scale uncertainty. The top quark mass is simultaneously determined with a global light-jet energy scale factor (JSF) and a relativeb-to-light-jet energy scale factor (bJSF), accounting for residual differences of data and
simulation in the light-jet andb-to-light-jet energy scale. The result obtained ismtop = 172.33±
0.75 (stat+JSF+bJSF)±1.02 (syst) GeV, dominated by statistical uncertainties.
In the dilepton channel, measurements have been performed with data collected at both 7 TeV and 8 TeV center-of-mass energies [5, 6]. In this channel, the top quark mass is extracted from a one-dimensional template method, where the templates are constructed from thembobservable, defined
as per-event average invariant mass of the two lepton-b-jet systems from the decay of the top quarks (see Figure 1). Due to the underconstrained kinematics associated with the dilepton final state, no in situ constraint of the jet energy scales is performed.
The results obtained are mtop = 173.79±0.54 (stat)±1.30 (syst) GeV and mtop = 172.99±
0.41 (stat)±0.74 (syst) GeV for the 7 and 8 TeV datasets respectively. The result at √s=8 TeV
is about 40% more precise than the one obtained from the √s=7 TeV data and the most precise
[GeV] reco lb m 40 60 80 100 120 140 160
Events / 2 GeV
0 100 200 300 400
500 Data
1% background Best fit Uncertainty
ATLAS
-1 =8 TeV, 20.2 fb s
Figure 1. The reconstructedmb observable for data together with the fitted probability density functions for
background alone and for the sum of signal and background [6].
The most precise results are obtained using the template method, in particular when applied in thett lepton+jets and dilepton channels. For a chosen observable sensitive to the top quark mass
parameter (mtop), simulated distributions (templates) are produced using a number of discrete values
of that parameter. These templates are fitted to distributions that interpolate between different input
values of the top quark mass parameter. A fit to the observed data distribution is then performed to obtain the value ofmtopthat best describes data. Therefore, the mass determined with this procedure
is the mass as defined in the Monte Carlo generator. It is expected that the difference between this
mass definition and the pole mass is of order 1 GeV [2–4].
The measurement in the lepton+jets channel is performed using data from proton-proton collisions
at √s=7 TeV [5]. The mass is extracted from a three-dimensional template fit to the reconstructed
invariant mass of the hadronic top quark decay products, the invariant mass of the two jets coming from theW boson to constrain the jet energy scale uncertainty, and an observable sensitive to the relativeb-to-light jet energy scale to reduce the otherwise dominant b-jet energy scale uncertainty. The top quark mass is simultaneously determined with a global light-jet energy scale factor (JSF) and a relativeb-to-light-jet energy scale factor (bJSF), accounting for residual differences of data and
simulation in the light-jet andb-to-light-jet energy scale. The result obtained ismtop = 172.33±
0.75 (stat+JSF+bJSF)±1.02 (syst) GeV, dominated by statistical uncertainties.
In the dilepton channel, measurements have been performed with data collected at both 7 TeV and 8 TeV center-of-mass energies [5, 6]. In this channel, the top quark mass is extracted from a one-dimensional template method, where the templates are constructed from thembobservable, defined
as per-event average invariant mass of the two lepton-b-jet systems from the decay of the top quarks (see Figure 1). Due to the underconstrained kinematics associated with the dilepton final state, no in situ constraint of the jet energy scales is performed.
The results obtained are mtop = 173.79±0.54 (stat)±1.30 (syst) GeV and mtop = 172.99±
0.41 (stat)±0.74 (syst) GeV for the 7 and 8 TeV datasets respectively. The result at √s=8 TeV
is about 40% more precise than the one obtained from the √s=7 TeV data and the most precise
single result from ATLAS. The increased precision is partially driven by a better knowledge of the jet energy scale. In addition, the larger dataset at √s=8 TeV allowed for an optimised event selection
events / 0.1
0 100 200 300 400 500 600 700 800
ATLAS
-1 = 7 TeV, 4.6 fb s
Data =172.5 GeV t , m tt Background Uncertainty
s
ρ
0 0.1 0.2 0.3 0.4 0.5 0.6 0.7 0.8 0.9 1
data / pred. 0 1 2
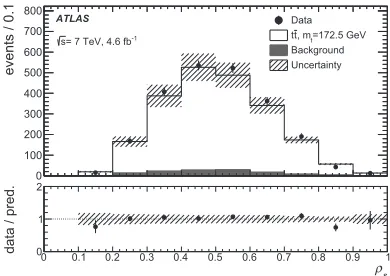
Figure 2.Number of reconstructed events as a function ofρs= √s2m0
tt+1−jet (m0=170 GeV) related to the inverse of the invariant mass of thett+1-jet system. The data are compared to the signal plus background expectations [10].
significantly reducing the total systematic uncertainty, mostly due to a lower impact of the jet energy scale and theory modelling uncertainties.
These three most precise measurements obtained by ATLAS have been combined using the best linear unbiased estimate (BLUE) method [7, 8] in which both statistical and systematic uncertainties, and their correlations are taken into account. The correlations of the measurements are evaluated for each source of systematic uncertainty. Using a dedicated mapping of uncertainty categories, the combination results inmtop =172.84±0.34 (stat)±0.61 (syst) GeV, with a total relative precision of
0.4%, representing a 17% improvement with respect to the most precise single input measurement. As mentioned above, the measurements presented so far correspond to the mass definition used in the Monte Carlo simulation. An alternative approach is to extract the mass from measurements of observables whose mass dependence can be calculated beyond leading-order in a perturbative ex-pansion. With this method the top quark mass scheme is unambiguously defined in the theoretical calculations. The results obtained so far have however a lower precision.
Using this approach, the top quark pole mass has been determined from measurements of two different observables: The inclusive cross section for top quark pair production and the normalised
differential cross section forttproduction with at least one additional jet,tt+1-jet, as a function of the
inverse of the invariant mass of thett+1-jet system (see Figure 2). The top quark mass dependence for these observables is calculated at NNLO+NNLL accuracy for the former and at NLO for the latter.
The differential observable presents a larger sensitivity to the top quark pole mass. Its sensitivity is
due to the mass dependence of the amount of gluon radiation, with large effects in the phase space
region relatively close to thett+1-jet production threshold.
The value extracted from the measurements of the inclusivettcross section at √s=7 TeV and
√s=8 TeV ismpole
top =172.9+−22..56GeV [9]. From the differential measurement, the mass is measured to
bempoletop =173.7±1.5 (stat)±1.4 (syst)+1.0
−0.5(theo) GeV, reaching a relative uncertainty of 1.3% [10].
3 Spin correlations in top quark pair production
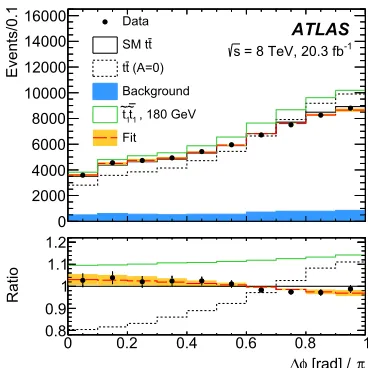
Events/0.1
0 2000 4000 6000 8000 10000 12000 14000 16000
ATLAS
-1 = 8 TeV, 20.3 fb s
Data t SM t (A=0) tt Background
, 180 GeV 1 t~ 1 t~ Fit
π [rad] / φ ∆
0 0.2 0.4 0.6 0.8 1
Ratio
0.8 0.9 1 1.1 1.2
Figure 3.Reconstructed∆φdistribution. The prediction for background (blue histogram) plus SMttproduction (solid black histogram) and background plusttprediction with no spin correlation (dashed back histogram) is compared to data and to the result of the fit to the data (red dashed histogram) with orange band representing the total systematic uncertainty on fSM. The prediction for top squark pair production plus SMttproduction plus background is also shown (solid green histogram). The lower plot shows those distributions (except for background only) divided by the SMttplus background prediction [11].
Angular distributions of charged leptons are particularly interesting because the polarisation-analysing power of the charged leptons is effectively 100%.
Within the SM QCD top quark pair production, the top quarks are expected to have a negligible polarisation, but the spins of the top and anti-top are expected to be correlated. Many scenarious of physics beyond the SM predict different spin correlations.
The latest and most precise measurements provided by ATLAS in the dilepton channel use two different observables to extract the spin correlation strength:Ahelicity =Nlike−Nunlike
Nlike+Nunlike, whereNlike(Nunlike)
is the number of events where the top quark and top anti-quark spins are parallel (anti-parallel). One of the observables is the difference in azimuthal angle∆φbetween the two charged leptons, defined in the laboratory frame. The second measured observable is the double differential distribution of cosθ1·θ2 whereθ1 andθ2 are for each lepton the polar angle between the direction of the lepton in
the top rest frame and the top quark direction in thettcenter-of-mass frame.
Figure 3 shows the reconstructed∆φdistribution obtained using √s=8 TeV data, compared with Monte Carlo predictions with and without spin correlations. These predictions are then used in a template fit to the data to obtain a coefficient fSMthat measures the degree of spin correlations with respect to the SM prediction. The extracted value isfSM=1.20±0.05 (stat)±0.13 (syst), that can be
translated intoAhelicity = 0.38±0.04 assuming that thettsample is composed of top quark pairs as
predicted by the SM but with varying spin correlation [11]. The measurement agrees with the NLO QCD prediction to within two standard deviations.
The distribution of cosθ1·θ2is measured using √s=7 TeV data. After background subtraction,
distri-Events/0.1
0 2000 4000 6000 8000 10000 12000 14000 16000
ATLAS
-1 = 8 TeV, 20.3 fb s
Data t SM t
(A=0) tt Background
, 180 GeV 1 t~ 1 t~ Fit
π [rad] / φ ∆
0 0.2 0.4 0.6 0.8 1
Ratio
0.8 0.9 1 1.1 1.2
Figure 3.Reconstructed∆φdistribution. The prediction for background (blue histogram) plus SMttproduction (solid black histogram) and background plusttprediction with no spin correlation (dashed back histogram) is compared to data and to the result of the fit to the data (red dashed histogram) with orange band representing the total systematic uncertainty on fSM. The prediction for top squark pair production plus SMttproduction plus background is also shown (solid green histogram). The lower plot shows those distributions (except for background only) divided by the SMttplus background prediction [11].
Angular distributions of charged leptons are particularly interesting because the polarisation-analysing power of the charged leptons is effectively 100%.
Within the SM QCD top quark pair production, the top quarks are expected to have a negligible polarisation, but the spins of the top and anti-top are expected to be correlated. Many scenarious of physics beyond the SM predict different spin correlations.
The latest and most precise measurements provided by ATLAS in the dilepton channel use two different observables to extract the spin correlation strength:Ahelicity= Nlike−Nunlike
Nlike+Nunlike, whereNlike(Nunlike)
is the number of events where the top quark and top anti-quark spins are parallel (anti-parallel). One of the observables is the difference in azimuthal angle∆φbetween the two charged leptons, defined in the laboratory frame. The second measured observable is the double differential distribution of cosθ1·θ2whereθ1 andθ2 are for each lepton the polar angle between the direction of the lepton in
the top rest frame and the top quark direction in thettcenter-of-mass frame.
Figure 3 shows the reconstructed∆φdistribution obtained using √s=8 TeV data, compared with Monte Carlo predictions with and without spin correlations. These predictions are then used in a template fit to the data to obtain a coefficient fSMthat measures the degree of spin correlations with respect to the SM prediction. The extracted value isfSM=1.20±0.05 (stat)±0.13 (syst), that can be
translated intoAhelicity =0.38±0.04 assuming that thettsample is composed of top quark pairs as
predicted by the SM but with varying spin correlation [11]. The measurement agrees with the NLO QCD prediction to within two standard deviations.
The distribution of cosθ1·θ2is measured using √s=7 TeV data. After background subtraction,
the distribution is unfolded to parton level using an iterative Bayesian method. The unfolded
distri-bution is in good agreement with the SM prediction and yields toAhelicity = 0.315±0.061 (stat)±
0.049 (syst) [12].
4 Charge asymmetry in top quark pair production
At leading-order,ttproduction is expected to be symmetric under the exchange of top and anti-top quarks. Beyond leading-order and for qq initiated processes, due to an interference between the Born and NLO diagrams and between processes with initial and final state gluon emissions, there is a connection between the direction of the top and the initial quark and between the anti-top and the initial anti-quark. At the LHC, this leads to top quarks being produced more forward and anti-top quarks more central. This effect is very small within the SM, at the 1% level, because the dominant top quark pair production is via gluon fusion, which is always symmetric. However, it can be enhanced in several BSM scenarious.
The observable used to study this effect is the forward-backward asymmetryAttCon the distribution of the difference between the absolute rapidities of the top and anti-top quarks. For the case in which both top quarks decay leptonically, the asymmetryA
C on the distribution of the difference between
absolute rapidities of the positive and negative charged leptons is also measured. This observable has a slightly diluted sensitivity but has the advantage that no reconstruction of thettis needed.
Measurements of these two observables have been performed inclusively and differentially as a function of several kinematic variables (as the invariant mass, transverse momentum and longitudinal boost of thettsystem). They have been done in the full phase space, so that they can be directly compared with the NLO QCD predictions [13, 14], and also in a fiducial region in order not to rely on extrapolations to regions of the phase space that are not within the detector acceptance.
The latest measurements are performed using the √s=8 TeV data in the lepton+jets and dilepton channels [15–17]. For the lepton+jets channel there is a dedicated measurement in events with highly boosted top quarks with an invariant mass of thettsystem in the TeV range. This kinematic region has a higher sensitivity to the SM asymmetry as well as for BSM models that introduce massive new states. The measured distributions are corrected for acceptance and detector resolution effects using a full Bayesian unfolding method.
All results are found to be compatible with the SM predictions, being the precision limited by statistics. These measurements have allowed to set limits on the masses and couplings of new particles within BSM models. The results obtained for the inclusive top quark based measurements, including also the fiducial measurement in the boosted regime, are summarised in Figure 4 and compared to the CMS measurements. Figure 5 shows the values ofAtt
CandAC from the inclusive measurements
in the full phase space in the dilepton channel, compared to the SM predictions and a BSM model compatible with the Tevatron results.
5 Conclusion
The latest and most precise measurements performed using Run-1 data from the ATLAS experiment of the top quark mass and angular distributions in top quark pair events sensitive to spin correlations and charge asymmetry effects have been presented. These measurements allow to probe with high precision the SM, being also sensitive to new physics effects.
C
A
0.05
− 0 0.05
0 13.5
ATLAS l+jets 0.009± 0.004 ± 0.005
ATLAS l+jets boosted
0.026
±
0.019
±
0.042
tt C
ATLAS dilepton A 0.021± 0.011 ± 0.012
ll C
ATLAS dilepton A 0.008± 0.005 ± 0.003 CMS l+jets template 0.003± 0.003 ± 0.003 CMS l+jets 0.001± 0.007 ± 0.004
tt C
CMS dilepton A 0.011± 0.011 ± 0.007
ll C
CMS dilepton A 0.003± 0.006 ± 0.003
0.0004 ± 0.0111 Theory (NLO+EW)
PRD 86, 034026 (2012)
0.0004 ± 0.0160 Theory (NLO+EW)
JHEP 1201 (2012) 063
0.0003 ± 0.0064 Theory (NLO+EW)
PRD 86, 034026 (2012)
|y|| < 2)
∆
> 0.75 TeV && |
tt
(M
PLB 756 (2016) 52
PRD 94, 032006 (2016) PRD 94, 032006 (2016) PJC 76 (2016) 87
PLB 760 (2016) 365 PLB 760 (2016) 365 PLB 757 (2016) 154 PRD 93, 034014 (2016)
asymmetry tt
dilepton asymmetry
= 8 TeV s Sept 2016
ATLAS+CMS Preliminary LHCtopWG
total stat AC±(stat)±(syst)
Figure 4.Summary of the charge asymmetryAtt
Cmeasurements provided by the ATLAS and CMS experiments, including both inclusive measurements and the measurement in the boosted regime in a restricted phase space region [18].
tt C
A 0.02
− −0.01 0 0.01 0.02 0.03 0.04 0.05 0.06
ll C
A
0.02 −
0.01 −
0 0.01 0.02 0.03
Bernreuther & Si. PRD 86, 034026. heavy octet, LEFT
heavy octet, RIGHT heavy octet, AXIAL ATLAS data
σ
ATLAS 1
σ
ATLAS 2
ATLAS
-1 20.3 fb = 8 TeV, s
Inclusive - Parton level
Figure 5. Comparison of the inclusive Att
C andAC measurement values in the full phase space in the dilep-ton channel, compared to the SM predictions and to a benchmark BSM model with a heavy octed with mass beyond the reach of the LHC, for various couplings. Ellipses correspond to the 1σand 2σuncertainty of the measurement [17].
The measurements of top quark spin correlations and charge asymmetry inttproduction are all compatible with the SM predictions, allowing to set limits on BSM scenarious.
References
C
A
0.05
− 0 0.05
0
ATLAS l+jets 0.009± 0.004 ± 0.005
ATLAS l+jets boosted
0.026
±
0.019
±
0.042
tt C
ATLAS dilepton A 0.021± 0.011 ± 0.012
ll C
ATLAS dilepton A 0.008± 0.005 ± 0.003 CMS l+jets template 0.003± 0.003 ± 0.003 CMS l+jets 0.001± 0.007 ± 0.004
tt C
CMS dilepton A 0.011± 0.011 ± 0.007
ll C
CMS dilepton A 0.003± 0.006 ± 0.003
0.0004 ± 0.0111 Theory (NLO+EW)
PRD 86, 034026 (2012)
0.0004 ± 0.0160 Theory (NLO+EW)
JHEP 1201 (2012) 063
0.0003 ± 0.0064 Theory (NLO+EW)
PRD 86, 034026 (2012)
|y|| < 2)
∆
> 0.75 TeV && |
tt
(M
PLB 756 (2016) 52
PRD 94, 032006 (2016) PRD 94, 032006 (2016) PJC 76 (2016) 87
PLB 760 (2016) 365 PLB 760 (2016) 365 PLB 757 (2016) 154 PRD 93, 034014 (2016)
asymmetry tt
dilepton asymmetry
= 8 TeV s Sept 2016
ATLAS+CMS Preliminary LHCtopWG
total stat AC±(stat)±(syst)
Figure 4.Summary of the charge asymmetryAtt
Cmeasurements provided by the ATLAS and CMS experiments, including both inclusive measurements and the measurement in the boosted regime in a restricted phase space region [18].
tt C
A 0.02
− −0.01 0 0.01 0.02 0.03 0.04 0.05 0.06
ll C
A
0.02 −
0.01 −
0 0.01 0.02 0.03
Bernreuther & Si. PRD 86, 034026. heavy octet, LEFT
heavy octet, RIGHT heavy octet, AXIAL ATLAS data
σ
ATLAS 1
σ
ATLAS 2
ATLAS
-1 20.3 fb = 8 TeV, s
Inclusive - Parton level
Figure 5. Comparison of the inclusive Att
C andAC measurement values in the full phase space in the dilep-ton channel, compared to the SM predictions and to a benchmark BSM model with a heavy octed with mass beyond the reach of the LHC, for various couplings. Ellipses correspond to the 1σand 2σuncertainty of the measurement [17].
The measurements of top quark spin correlations and charge asymmetry inttproduction are all compatible with the SM predictions, allowing to set limits on BSM scenarious.
References
[1] ATLAS Collaboration, JINST 3 (2018) S08003.
[2] A. Buckley et al., Phys. Rept.504(2011) 145. [3] A.H. Hoang, arXiv:1412.3649 [hep-ph]. [4] S. Moch et al., arXiv:1405.4781 [hep-ph].
[5] ATLAS Collaboration, Eur. Phys. J. C75(2015) 330. [6] ATLAS Collaboration, Phys. Lett. B761(2016) 350. [7] L. Lyons et al., Nucl. Instr. Meth. A270(1988) 110. [8] R. Nisius, Eur. Phys. J. C74(2014) 3004.
[9] ATLAS Collaboration, Eur. Phys. J. C74(2014) 3109. [10] ATLAS Collaboration, JHEP10(2015) 121.
[11] ATLAS Collaboration, Phys. Rev. Lett.114(2015) 142001. [12] ATLAS Collaboration, Phys. Rev. D93(2016) 012002. [13] J.H. Kuhn and G. Rodrigo, JHEP1201(2012) 063.
[14] W. Bernreuther and Z.-G.Si, Phys. Rev. D86(2012) 034026. [15] ATLAS Collaboration, Eur. Phys. J. C76(2016) 87.
[16] ATLAS Collaboration, Phys. Lett. B756(2016), 52. [17] ATLAS Collaboration, arXiv:1604.05538 [hep-ex].
![Figure 1. The reconstructed mℓb observable for data together with the fitted probability density functions forbackground alone and for the sum of signal and background [6].](https://thumb-us.123doks.com/thumbv2/123dok_us/8070383.1345972/2.482.148.332.87.236/figure-reconstructed-observable-tted-probability-functions-forbackground-background.webp)
![Figure 4. Summary of the charge asymmetry AttC measurements provided by the ATLAS and CMS experiments,including both inclusive measurements and the measurement in the boosted regime in a restricted phase spaceregion [18].](https://thumb-us.123doks.com/thumbv2/123dok_us/8070383.1345972/6.482.144.325.335.487/asymmetry-measurements-experiments-including-measurements-measurement-restricted-spaceregion.webp)
