Parametric Optimization for Material Removal
Rate, Tool Wear Rate and Interface Temperature
during Turning of AISI D3 Steel under Dry and
Lubricated Condition Using Taguchi Approach
B.Yaswanth Reddy
1, R.K.Suresh
2PG Scholar, Department of Mechanical Engineering, Srikalahasteeswara Institute of Technology, Srikalahasti, AP,
India1
Asst. Professor (Sr.), Department of Mechanical Engineering, Srikalahasteeswara Institute of Technology, Srikalahasti,
AP, India2
ABSTRACT: The objective of this paper is focused on turning of AISI D3 Steel using PVD coated cemented carbide tool cutting inserts. The experiments were performed on a KIROLOSKAR model center lathe using three input cutting parameters, cutting speed, feed and depth of cut. The responses measured were Material removal rate(MRR), Tool wear rate(TWR) and Interface temperature. Taguchi technique has been used to optimize the controllable process parameters The contributing effects of various hard turning parameters on each response were also studied using analysis of variance (ANOVA) Metal cutting fluids changes the performance of machining operations because of their lubrication, cooling, and chip flushing functions. Typically, in the machining of hardened steel materials, no cutting fluid is applied in the interest of low cutting forces and low environmental. Impacts. Minimum quantity lubrication (MQL) presents itself as a viable alternative for machining with respect to tool wear, heat disipation, and machined surface quality. Minimum quantity lubrication (MQL) refers to the use of cutting fluids of only a minute amount typically of a flow rate of 50 to 500 ml/hour which is about three to four orders of magnitude lower than the amount commonly used in flood cooling condition.. The objective of this work is to determine the influence of lubricant on wear and frictional force with AISI D3 Steel. Further an attempt has been made to identify the influence of Mustard oil in reducing the wear and frictional force. Further a regression is modelled as a function of cutting parameters to predict values for response characteristics in comparison with experimental values within reasonable limits. Based on the main effects plots and signal to noise ratio (S/N) obtained through taguchi approach, were used to relate the optimum level for surface roughness chosen from the considered three levels of cutting parameters.
KEYWORDS
: AISI D3 steel, PVD insert, MRR,TWR, Interface temperature, Taguchi, ANOVA
I. INTRODUCTION
machined parts are the main challenges of metal based industry. There has been increased interest in monitoring all aspects of machining process. Material removal rate, Tool wear rate and Interface temperature between tool and work are the important parameters needed to be considered in manufacturing industry to ensure cost effectiveness of the final product as well as improved productivity..In the present work, AISI D3 steel was selected as work material which finds application in the manufacture of Blanking & Forming dies, press tools, punches, bushes, forming rolls and many more.
II. LITERATUREREVIEW
Varaprasad Bhemuni, Srinivasa Rao Chelamalasetti, etal[1 ] made an attempt to develop a model and predict the tool wear and nodal temperature of hard turned AISI D3 hardened steel using Response Surface Methodology (RSM). The combined effects of cutting speed, feed rate and depth of cut are investigated using contour plots. RSM based Central Composite Design (CCD) is applied as an experimental design.
W.H.Yang & Y.S Tang [2] envisages that the Taguchi method is a powerful tool to design optimization for quality and is used to find the optimal cutting parameters for turning operations. An orthogonal array , the signal to noise ratios and ANOVA are employed to investigate the cutting characteristics of S45C steel bars using Tungsten carbide cutting tools. Through this study, not only optimal cutting parameters for turning operations obtained, but also the main cutting parameters that affect the cutting performance in turning operations are found.
Gurpreet singh etal[3] conducted experiments En31 steel under dry and minimum quantity lubrication conditin using a conventional lathe.. The Results of surface roughness obtained during Dry and Vegetable based oil Minimum quantity lubrication werecompared with each other and indicated that the surface roughness of inimum quantity lubrication is 20-35% lower than Dry cutting.
Dhar, N.R et al [4] has experimentally investigated the effect of Minimum Quantity of Lubrication (MQL) by vegetable
oil-based cutting fluid on machinability of steel, the result obtained from this study using uncoated carbide tool i.e. MQL systems enabled reduction in average chip-tool interface temperature up to 10%.
Sharma Vishal S. et al [5] has suggested the Cooling techniques for improved productivity in turning. It overview the major advancement in techniques as minimum quantity lubrication (MQL)/near dry machining (NDM), high pressure coolant (HPC), cryogenic cooling, compressed air cooling and use of solid lubricants/coolants. These techniques have resulted in reduction in friction and heat at the cutting zone, hence improved productivity of the process. A brief survey of modeling/FEA techniques is also performed
Abhang L.B et al [6]has experimentally investigated the performance of MQL machining of alloy steel with 10% boric
acid by weight mixed with SAE- 40 base oil during turning of EN-31 steel using tungsten carbide cutting tool. Minimum quantity lubricant has reduced the chip-tool interface temperature by 20 to 30% in this study
R.K.Suresh etal[7] focuses on an approach based on Grey relational analysis and Desirability function analysis for optimizing the process parameters during turning of AISI D3 steel with CVD coated tool with multiple performance characteristics. Experimentation were carried out on a Conventional lathe using L9 orthogonal array based on Taguchi design of experiments. The influence of spindle speed, feed and depth of cut were analyzed on the performance of surface roughness, material removal rate, interface temperature and flank wear . From the study, it is concluded that machining performance is significantly improved.
Alaattin Kacal etal [9] dealt with experimental results of high speed hard turning of hardened ASIS S1 cold work tool steel with ceramic and CBN cutting tools. The results obtained from the experiments were evaluated graphically and by using ANOVA which is one of the statistical techniques
III.METHODOGOLOGYUSED
Taguchi method:
The objective of the robust design is to find the controllable process parameters setting for which Noise or variation as a minimal effect on the product or process functional characteristics. It is to be noted that the aim is not to find the parameter setting for the uncontrollable noise variables but the controllable design variables. To attain this objective, the control parameter also known as inner array variables, are systematically varied as stipulated by the inner orthogonal array. For the each experiment of inner array, a series of new experiments is conducted by varying the level settings of the uncontrollable noise variables. The level combinations of noise variables are done using the outer orthogonal array. The interference of noise on the performance characteristics can be found using the ratio where S is the standard derivation of the performance parameters of the each inner array experiment and N is the total number of experiment in the outer orthogonal array. This ratio indicates the functional variation due to noise. Using this result, it is possible to predict which control parameter settings will make the process in sensitive to noise. Taguchi method focus on robust design through use of
1. Signal to noise ratio. 2. Orthogonal array.
Analysis of variance(ANOVA):
Analysis of variance (ANOVA) is a statistical method of determining the existence of several While the aim of ANOVA is to detect the difference among several populations means the technique requires the analysis of different forms of variance associated with random samples under the study hence it is called ANOVA. The original idea of ANOVA was devolved by the English statistician sir Ronald A fisher during the first part of this century. most of the early work in this area deal with the agricultural experiments where crops were given different treatments, such as being grown using different kinds of fertilizes. The researchers wanted to determine whether all treatments under study were equally effective or whether some treatments were better than others
IV.EXPERIMENTATION
In the present study, three turning parameters were selected with three levels as shown in Table 2. The experimentation was carried out using L9 orthogonal array based on Taguchi design of experiments. The work material selected for this experiment is AISI D3 steel of 40 mm diameter, length 100 mm. The chemical composition of AISI D3 steel is given in Table.1
The turning tests were carried out on Kirloskar model centre(TURN MASTER) lathe machine to determine the responses characterstics for various runs of experiment. The material removal rate (mm3/min) is calculated using formula:
MRR = [π/4(D12-D22)L]/t mm3/min
Where, D1 = Diameter of the work piece before turning.mm
D2 = Diameter of the work piece after turning.mm
L = Length of turning, mm t = Machining time, min
The tool-work interface temperature is read from Infrared pyrometer. The tool wear rate is calculated using the following formula:
TWR = (W1-W2)/t g/hr
Table: 1 Chemical composition of AISI D3 steel
Ellement Carbon Silicon Mn Ni Cr Mo S P Al B
% composition 2.179 0.511 0.511 0.05 12.63 0.178 0.021 0.025 0.178 0.065
Table: 2 Process parameters and their levels
Process parameters Level 1 Level 2 Level 3
Spindle speed(rpm) 450 710 1120
Feed(mm/rev) 0.05 0.071 0.09
Depth of cut(mm) 1.0 1.5 2.0
Table 3, 4,5 depicts the experimental data and results corresponding to dry, minimum quantity lubrication and flooded lubrication conditions respectively.
Table :3 Experimental data and results-Dry condition
Expt No Spindle
speed
Feed Depth of
cut
Material removal rate(mm3/sec)
Tool wear rate(g/hr)
Interface temperature (0C)
1 450 0.05 1.0 22.839 0.4285 32.12
2 450 0.071 1.5 44.571 0.2834 37.44
3 450 0.09 2.0 90.198 0.7125 42.48
4 710 0.05 1.5 50.725 0.3028 42.30
5 710 0.071 2.0 84.123 0.4500 46.62
6 710 0.09 1.0 46.064 0.2950 36.14
7 1120 0.05 2.0 143.313 0.8182 40.30
8 1120 0.071 1.0 45.649 0.1358 38.02
9 1120 0.09 1.5 254.431 0.9729 36.65
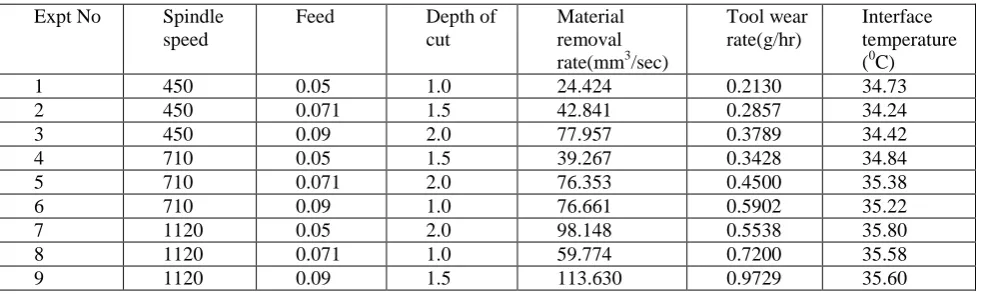
Table :4 Experimental data and results-Minimum quantity lubrication condition
Expt No Spindle
speed
Feed Depth of
cut
Material removal rate(mm3/sec)
Tool wear rate(g/hr)
Interface temperature (0C)
1 450 0.05 1.0 24.424 0.2130 34.73
2 450 0.071 1.5 42.841 0.2857 34.24
3 450 0.09 2.0 77.957 0.3789 34.42
4 710 0.05 1.5 39.267 0.3428 34.84
5 710 0.071 2.0 76.353 0.4500 35.38
6 710 0.09 1.0 76.661 0.5902 35.22
7 1120 0.05 2.0 98.148 0.5538 35.80
8 1120 0.071 1.0 59.774 0.7200 35.58
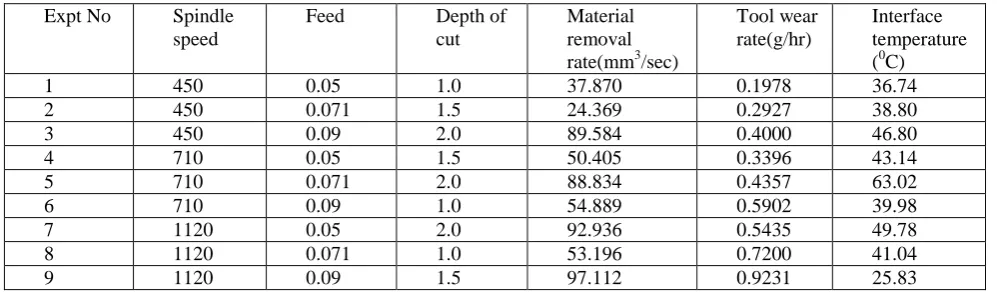
Table :5 Experimental data and results-Flooded lubrication condition
Expt No Spindle
speed
Feed Depth of
cut
Material removal rate(mm3/sec)
Tool wear rate(g/hr)
Interface temperature (0C)
1 450 0.05 1.0 37.870 0.1978 36.74
2 450 0.071 1.5 24.369 0.2927 38.80
3 450 0.09 2.0 89.584 0.4000 46.80
4 710 0.05 1.5 50.405 0.3396 43.14
5 710 0.071 2.0 88.834 0.4357 63.02
6 710 0.09 1.0 54.889 0.5902 39.98
7 1120 0.05 2.0 92.936 0.5435 49.78
8 1120 0.071 1.0 53.196 0.7200 41.04
9 1120 0.09 1.5 97.112 0.9231 25.83
Table 6 and 7 signifies values of means and signal to noise ratio corresponding to MRR under dry condition
Table:6 Response table for Means corresponding to MRR (Dry condition)
Level Spindle speed Feed Depth of cut
1 52.54 72.29 38.18
2 60.30 58.11 116.58
3 147.80 130.23 105.88
Max-Min 98.26 72.12 78.39
Rank 1 3 2
Table7: Response table for signal to noise ratios corresponding to MRR (Dry condition)
Level Spindle speed Feed Depth of cut
1 31.22 34.60 33.09
2 38.40 34.89 35.29
3 40.24 40.16 41.48
Max-Min 9.03 5.36 8.39
Rank 1 3 2
Table 8 and 9 signifies values of means and signal to noise ratio corresponding to TWR under dry condition
Table:8 Response table for Means corresponding to TWR (Dry condition)
Level Spindle speed Feed Depth of cut
1 0.4748 0.5165 0.2864
2 0.3493 0.2897 0.5197
3 0.6423 0.6602 0.6602
Max-Min 0.2930 0.3704 0.3738
Table:9 Response table for signal to noise ratios corresponding to TWR (Dry condition)
Level Spindle speed Feed Depth of cut
1 7.086 6.494 11.769
2 9.305 11.743 7.189
3 6.441 4.595 3.874
Max-Min 2.864 7.148 7.895
Rank 3 2 1
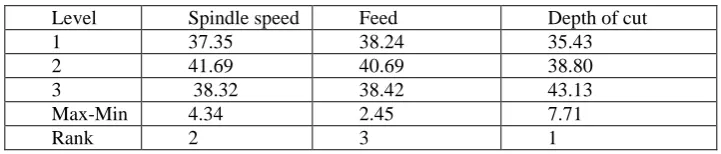
Table 10 and 11 signifies values of means and signal to noise ratio corresponding to Interface temperature under dry condition
Table:10 Response table for means corresponding to Interface temperature (Dry condition)
Level Spindle speed Feed Depth of cut
1 37.35 38.24 35.43
2 41.69 40.69 38.80
3 38.32 38.42 43.13
Max-Min 4.34 2.45 7.71
Rank 2 3 1
Table:11 Response table for signal to noise ratios corresponding to Interface temperature (Dry condition)
Level Spindle speed Feed Depth of cut
1 -31.39 -31.59 -30.97
2 -32.35 -32.15 -31.76
3 -31.66 -31.67 -32.68
Max-Min 0.96 0.56 1.72
Rank 2 3 1
Table 12 and 13 signifies values of means and signal to noise ratio corresponding to MRR under MQL condition
Table:12 Response table for Means corresponding to MRR (MQLcondition)
Level Spindle speed Feed Depth of cut
1 48.41 53.95 53.62
2 64.09 59.66 65.25
3 90.52 89.42 84.15
Max-Min 42.11 35.47 30.53
Rank 1 2 3
Table:13 Response table for signal to noise ratios corresponding to MRR (MQL condition)
Level Spindle speed Feed Depth of cut
1 32.74 33.16 33.66
2 35.74 35.27 35.21
3 38.83 38.88 38.44
Max-Min 6.08 5.72 4.78
Rank 1 2 3
Table:14 Response table for Means corresponding to TWR (MQL condition)
Level Spindle speed Feed Depth of cut
1 0.2925 0.3699 0.5077
2 0.4610 0.4852 0.5338
3 0.7489 0.6473 0.609
Max-Min 0.4564 0.2774 0.0729
Rank 1 2 3
Table:15 Response table for signal to noise ratios corresponding to TWR MQL condition)
Level Spindle speed Feed Depth of cut
1 10.915 9.288 6.956
2 6.939 6.890 6.807
3 2.742 4.417 6.833
Max-Min 8.173 .872 0.149
Rank 1 2 3
Table 16 and 17 signifies values of means and signal to noise ratio corresponding to Interface temperature under MQL condition
Table:16 Response table for means corresponding to Interface temperature (MQL condition)
Level Spindle speed Feed Depth of cut
1 34.46 35.12 35.18
2 35.15 35.02 34.89
3 35.66 35.08 35.20
Max-Min 1.20 0.06 0.31
Rank 1 3 2
Table:17 Response table for signal to noise ratios corresponding to Interface temperature (MQL condition)
Level Spindle speed Feed Depth of cut
1 -30.75 -30.91 -30.92
2 -30.92 -30.90 -30.85
3 -31.04 -30.90 -30.93
Max-Min 0.30 0.01 0.08
Rank 1 3 2
Table 18 and 19 signifies values of means and signal to noise ratio corresponding to MRR under Flooded condition
Table:18 Response table for Means corresponding to MRR (Flooded condition)
Level Spindle speed Feed Depth of cut
1 50.61 60.40 48.65
2 64.71 55.47 57.30
3 81.08 80.53 90.45
Max-Min 30.47 25.06 41.80
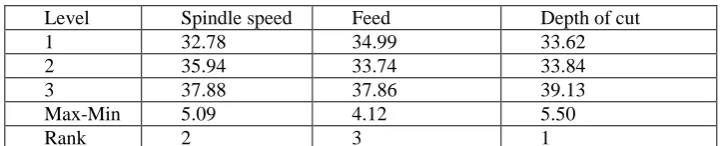
Table:19 Response table for signal to noise ratios corresponding to MRR (Flooded condition)
Level Spindle speed Feed Depth of cut
1 32.78 34.99 33.62
2 35.94 33.74 33.84
3 37.88 37.86 39.13
Max-Min 5.09 4.12 5.50
Rank 2 3 1
Table 20 and 21 signifies values of means and signal to noise ratio corresponding to TWR under Flooded condition
Table:20 Response table for Means corresponding to TWR (Flooded condition)
Level Spindle speed Feed Depth of cut
1 0.2988 0.3610 0.5027
2 0.4618 0.4915 0.5205
3 0.7295 0.6378 0.4671
Max-Min 0.4307 0.2768 0.0534
Rank 1 2 3
Table:21. Response table for signal to noise ratios corresponding to TWR Flooded condition)
Level Spindle speed Feed Depth of cut
1 10.843 9.573 7.170
2 6.929 6.725 6.857
3 2.937 4.411 6.683
Max-Min 7.906 5.162 0.487
Rank 1 2 3
Table 22 and 23 signifies values of means and signal to noise ratio corresponding to Interface temperature under Flooded condition
Table:22 Response table for means corresponding to Interface temperature (Flooded condition)
Level Spindle speed Feed Depth of cut
1 40.78 43.22 39.25
2 48.71 47.62 41.75
3 44.71 43.36 53.20
Max-Min 7.93 4.40 13.95
Rank 2 3 1
Table:23 Response table for signal to noise ratios corresponding to Interface temperature (Flooded condition)
Level Spindle speed Feed Depth of cut
1 -32.16 -32.65 -31.87
2 -33.57 -33.34 -32.40
3 -32.98 -32.72 -34.45
Max-Min 1.41 0.70 2.58
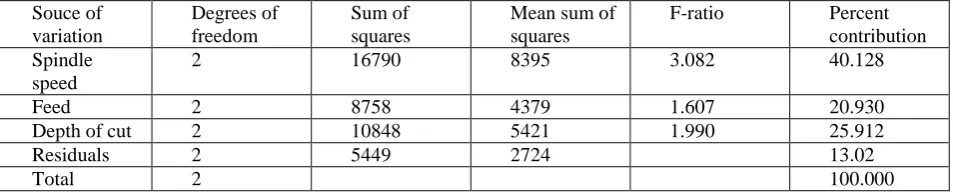
Table 24, 25 and 26 signifies the percentage contribution made by each process parameter on the response characteristics namely MRR, TWR and Interface temperature respectively under dry condition.
Table: 24 ANOVA for the response MRR in case of dry condition
Souce of variation Degrees of freedom Sum of squares
Mean sum of squares
F-ratio Percent
contribution Spindle
speed
2 16790 8395 3.082 40.128
Feed 2 8758 4379 1.607 20.930
Depth of cut 2 10848 5421 1.990 25.912
Residuals 2 5449 2724 13.02
Total 2 100.000
Table 25 ANOVA for the response TWR in case of dry condition
Souce of variation Degrees of freedom Sum of squares
Mean sum of squares
F-ratio Percent
contribution Spindle
speed
2 0.1297 0.0648 1.5300 20.358
Feed 2 0.2093 0.1046 2.4864 32.849
Depth of cut 2 0.2139 0.1069 2.5413 33.576
Residuals 2 0.0842 13.214
Total 2 100.000
Table:26 ANOVA for the response Interface temperature in case of dry condition
Souce of variation Degrees of freedom Sum of squares
Mean sum of squares
F-ratio Percent
contribution Spindle
speed
2 31.101 15.551 2.0469 21.148
Feed 2 11.205 5.603 0.7673 7.619
Depth of cut 2 89.556 29.852 22.255 60.898
Residuals 2 15.195 7.597 10.332
Total 2 100.000
Table 27, 28 and 29 signifies the percentage contribution made by each process parameter on the response characteristics namely MRR, TWR and Interface temperature respectively under MQL condition.
Table:27 ANOVA for the response MRR in case of MQL condition
Souce of variation Degrees of freedom Sum of squares
Mean sum of squares
F-ratio Percent
contribution Spindle
speed
2 2717 1358 7.908 40.802
Feed 2 2176 1088 6.400 30.678
Depth of cut 2 1424 712 9.188 21.385
Residuals 2 340 170 5.106
Table:28 ANOVA for the response TWR in case of MQL condition Souce of variation Degrees of freedom Sum of squares
Mean sum of squares
F-ratio Percent
contribution Spindle
speed
2 0.3196 0.1597 35.779 70.503
Feed 2 0.1166 0.0583 13.053 25.721
Depth of cut 2 0.0082 0.0041 0.917 1.804
Residuals 2 0.0089 0.0045 1.971
Total 2 100.000
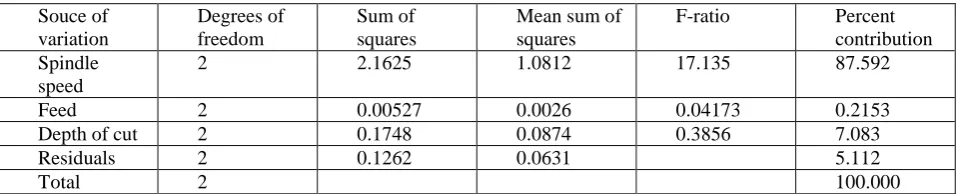
Table:29 ANOVA for the response Interface temperature in case of MQL condition
Souce of variation Degrees of freedom Sum of squares
Mean sum of squares
F-ratio Percent
contribution Spindle
speed
2 2.1625 1.0812 17.135 87.592
Feed 2 0.00527 0.0026 0.04173 0.2153
Depth of cut 2 0.1748 0.0874 0.3856 7.083
Residuals 2 0.1262 0.0631 5.112
Total 2 100.000
Table 30, 31 and 32 signifies the percentage contribution made by each process parameter on the response characteristics namely MRR, TWR and Interface temperature respectively under flooded condition.
Table:30 ANOVA for the response MRR in case of Flooded condition
Souce of variation Degrees of freedom Sum of squares
Mean sum of squares
F-ratio Percent
contribution Spindle
speed
2 1395.544 697.772 3.106 23.964
Feed 2 1057.483 528.742 2.364 18.159
Depth of cut 2 2921.245 1460.623 6.502 50.162
Residuals 2 449.301 224.651 7.715
Total 2 100.000
Table:31 ANOVA for the response TWR in case of Flooded condition
Souce of variation Degrees of freedom Sum of squares
Mean sum of squares
F-ratio Percent
contribution Spindle
speed
2 0.2866 0.1433 93.933 69.701
Feed 2 0.1160 0.0580 38.017 28.209
Depth of cut 2 0.0055 0.0027 1.816 1.347
Residuals 2 0.0031 0.0015 0.742
Table:32 ANOVA for the response Interface temperature in case of Flooded condition
Souce of variation
Degrees of freedom
Sum of squares
Mean sum of squares
F-ratio Percent
contribution Spindle
speed
2 163.164 81.582 33.581 19.767
Feed 2 153.333 76.666 31.558 18.076
Depth of cut 2 504.082 252.041 103.746 61.068
Residuals 2 4.859 2.4294 0.588
Total 2 100.000
V. CONCLUSION
The analyzed results from turning AISI D3 steel with PVD coated cemented carbide inserts revealed the
following conclusions
DRY
Material removal rate
1. The optimal combination of process parameters for maximum material removal rate is obtained at 450 rpm,
0.09 mm/rev feed and 1.50 mm depth of cut
2. It is observed that spindle speed is the most influential controlling factor on material removal rate variation
followed by depth of cut
3. Feed is found to be insignificant on material removal rate
4. The ANOVA re related that the percentage contribution of Spindle speed (40.128%) is the dominant
parameter followed by depth of cut (25.912%) for material removal rate. Tool wear rate
1. The optimal combination of process parameters for minimum tool wear rate is obtained at 1120 rpm, 0.071 mm/rev feed and 1.0 mm depth of cut
2. It is observed that depth of cut is the most influential controlling factor on material removal rate variation followed by feed.
3. Spindle speed is found to be insignificant on tool wear rate
4. The ANOVA re related that the percentage contribution of Depth of cut (33.576%) is the dominant parameter
followed by feed (32.849%) for tool wear rate. Interface temperature
1. The optimal combination of process parameters for minimum interface temperature is obtained at 710 rpm,
0.09 mm/rev feed and 1.0 mm depth of cut
2. It is observed that depth of cut is the most influential controlling factor on interface temperature variation followed by spindle speed
3. Feed is found to be insignificant on interface temperature
4. The ANOVA re related that the percentage contribution of Depth of cut (60.898%) is the dominant parameter
followed by spindle speed (21.148%) for interface temperature
MQL
Material removal rate
1. The optimal combination of process parameters for maximum material removal rate is obtained at 1120rpm,
0.09 mm/rev feed and 2.00 mm depth of
2. It is observed that spindle speed is the most influential controlling factor on material removal rate variation
followed by feed
3. Depth of cut is found to be insignificant on material removal rate
4. The ANOVA re related that the percentage contribution of Spindle speed (40.802%) is the dominant
Tool wear rate
1. The optimal combination of process parameters for minimum tool wear rate is obtained at 450 rpm, 0.05
mm/rev feed and 2.0 mm depth of cut
2. It is observed that spindle speed is the most influential controlling factor on material removal rate variation
followed by feed.
3. Depth of cut is found to be insignificant on tool wear rate
4. The ANOVA re related that the percentage contribution of Spindle speed (70.503%) is the dominant
parameter followed by feed (25.721%) for tool wear rate. Interface temperature
1. The optimal combination of process parameters for minimum interface temperature is obtained at 450 rpm,
0.09 mm/rev feed and 1.5 mm depth of cut
2. It is observed that spindle speed is the most influential controlling factor on interface temperature variation
followed by depth of cut
3. Feed is found to be insignificant on interface temperature
4. The ANOVA re related that the percentage contribution of spindle speed (87.592%) is the dominant parameter
followed by depth of cut (7.083%) for interface temperature
Flooded lubrication
Material removal rate
1. The optimal combination of process parameters for maimum material removal rate is obtained at 1120rpm,
0.09 mm/rev feed and 2.00 mm depth of
2. It is observed that depth of cut is the most influential controlling factor on material removal rate variation followed by spindle speed
3. Feed is found to be insignificant on material removal rate
4. The ANOVA re related that the percentage contribution of depth of cut (50.162%) is the dominant parameter
followed by spindle speed (23.964%) for material removal rate Tool wear rate
1. The optimal combination of process parameters for minimum tool wear rate is obtained at 450 rpm, 0.05
mm/rev feed and 2.0 mm depth of cut
2. It is observed that spindle speed is the most influential controlling factor on material removal rate variation
followed by feed.
3. Depth of cut is found to be insignificant on tool wear rate
4. The ANOVA re related that the percentage contribution of Spindle speed (69.701%) is the dominant
parameter followed by feed (28.209%) for tool wear rate. Interface temperature
1. The optimal combination of process parameters for minimum interface temperature is obtained at 450 rpm,
0.05 mm/rev feed and 1.0 mm depth of cut
2. It is observed that depth of cut is the most influential controlling factor on interface temperature variation followed by spindle speed
3. Feed is found to be insignificant on interface temperature
4. The ANOVA re related that the percentage contribution of depth of cut (61.068%) is the dominant parameter
followed by spindle speed (19.767%) for interface temperature
REFERENCES
1. Bhemuni, V., Chelamalasetti, S.R. and Kondapalli, S.P. (2014) Effect of Machining Parameters on Tool Wear and Nodal Temperature in Hard Turning of AISI D3 Steel. Open Access Library Journal, 1: e627.
3. Gurpreet singh, Dr. Sehjipal singh, Ajay kumar, Experimental evaluation of machining performance into turning of En 31 steel with dry and vegetable based oil minimum quantity lubrication, International journal of research in Mechanical Engineering and Technology, Vol.2,Issue 2, Mar 2013
4. Dhar, N.R and Khan, M. M. A., (2006), “A study of effects of MQL on temperature, force, tool wear and product quality in turning AISI 9310 steel”. Net Field wise Seminar on Manufacturing and Material Processing, issue 2,pp. 2006, 30-35
5. Sharma,V.S., Dogra, Manu., and Suri, N.M., “Cooling techniques for improved productivity in turning”. International Journal of Machine Tools & Manufacture 49 2009, .pp- 435–453.
6. Abhang, L B., Hameedullah, M., “Experimental Investigation of Minimum Quantity lubricants in Alloy Steel Turning”,. International Journal of Engineering Science and Technology, Volume 2(7), 2010, pp. 3045 – 3053.
7. R.K.Suresh, P.Venkataramaiah and G.Krishnaiah, “GRA & DFA based multi objectiove optimization during turning of AISI D3 steel using CNMG insert” Elixir Mechanical Engineering 85 (2015) 34294-34298
8. J.S Dureja, Rupider singh, Manpreet S. Bhatti, Production and Manufacturing Research: An open access journal , Sep 2014