Copyright2000 by the Genetics Society of America
Testing for Concordant Equilibria Between Population Samples
G. A. Huttley* and S. R. Wilson
†*Human Genetics Group, John Curtin School of Medical Research, The Australian National University, Canberra, ACT 0200, Australia and†Centre for Mathematics and Its Applications, The Australian National University, Canberra, ACT 0200, Australia
Manuscript received March 26, 2000 Accepted for publication September 11, 2000
ABSTRACT
A substantial body of theory has been developed to assess the effect of evolutionary forces on the distribution of genotypes, both single and multilocus, within populations. One area where the potential for application of this theory has not been fully appreciated concerns the extent to which population samples differ. Within populations, the divergence of genotype or haplotype frequencies from that expected under Hardy-Weinberg (HW) or linkage equilibrium can be measured as disequilibria coefficients. To assess population samples for concordant equilibria, an analytical framework for comparing disequilibria coefficients between populations is necessary. Here we present log-linear models to evaluate such hypothe-ses. These models have broad utility ranging from conventional population genetics to genetic epidemiol-ogy. We demonstrate the use of these log-linear models (1) as a test for genetic association with disease and (2) as a test for different levels of linkage disequilibria between human populations.
T
HE extent to which the varied influence of evolu- quencies (see, for example,ChianoandClayton1998; CoxandBell1989;SchaidandJacobsen1999). Tests tionary forces such as natural selection and randomfor genotype association implicitly allow for more com-genetic drift contribute to differences between
popula-plex genetic etiologies (e.g., heterozygote resistance or tion samples is of substantial interest. For example, the
susceptibility) than allele-based tests, but have larger importance of linkage disequilibrium (LD) for
popula-degrees of freedom, and thus may have reduced statisti-tion-based gene mapping approaches has focused
at-cal power. ChianoandClayton(1998) recently pro-tention on assessing the genomic distribution of LD
posed an additional test for association that accommo-(Huttleyet al.1999) and on the extent to which this
dates complex genetic causation with reduced degrees distribution differs between populations (Kruglyak
of freedom relative to the genotype test. This test is 1999;Lonjouet al.1999). Theory predicts that the limit
restricted in its application since it makes the assump-of LD will be greater in human populations with
histori-tion that heterozygote genotypes do not cause disease. cally restricted sizes, giving such populations an
advan-However, empirical evidence that this assumption is vio-tage for gene mapping. Another example is the extent
lated exists in a number of experimental systems. In to which an individual’s genotype at a specific locus
one example, the F1progeny of a cross between inbred
accounts for their susceptibility to disease. Comparing
mouse strains NZ black and NZ white exhibit the im-population samples that differ with respect to their
dis-munological disorder lupus, which is a phenotype ab-ease status can assess a causative disab-ease role for
varia-sent from both parental strains (Theofilopoulosand tion at a locus. Although these two examples appear
Dixon1985). quite distinct, as we argue below, the effect of genetic
In these traditional approaches, Hardy-Weinberg (HW) predisposition to disease on genetic variation is
analo-disequilibrium is treated as a confounding factor, and gous to the effect of natural selection in wild
popula-corrections are applied to eliminate the impact of HW tions. Thus, the assessment of such seemingly disparate
departures. In addition to allele and/or genotype differ-lines of inquiry can be unified into a single analytic
ences, however, it is important to understand the basis framework.
for differential departures from HW equilibrium (HWE). To illustrate the traditional approach employed to
The pattern of departure from HWE should reflect detect genetic differentiation between groups we
con-the underlying genetic etiology of a phenotype, sug-sider an epidemiological example where a sample is
gesting that testing for HWE may also be used to assess divided into groups, say “affected” and “unaffected,”
whether a gene influences predisposition to a trait. In and tested for homogeneity of allele or genotype
fre-an epidemiological context, for example, the resistfre-ance to human immunodeficiency virus (HIV) infection of individuals homozygous for the⌬32-CCR5deletion
al-Corresponding author: Gavin A. Huttley, Human Genetics Group, lele results in a significant departure from HWE among John Curtin School of Medical Research, The Australian National
HIV-uninfected high risk individuals, and thus an excess
University, Canberra, ACT 0200, Australia.
E-mail: [email protected] of ⌬32-CCR5 homozygotes in this group (Dean et al.
1996). Departure from HWE in affecteds has also been used for fine scale gene mapping (Feder et al. 1996; Nielsenet al.1999). Of course, phenomena other than selection may cause departure from HWE: admix-ture of genetically differentiated populations leads to a characteristic excess of homozygotes, referred to as the Wahlund effect (HartlandClark1990); nonrandom mating can cause either excess homozygosity or hetero-zygosity; and laboratory errors stemming from difficulty in discriminating between alleles, or difficulty in sam-pling all alleles, can cause either excess homozygosity or heterozygosity. Departures from HWE can be measured using disequilibria coefficients (Weir1996, p. 132).
Log-linear models present a natural framework for analysis of disequilibria coefficients between popula-tions (Aston and Wilson 1986) and can be imple-mented using standard statistical software packages. We present a log-linear model approach for the comparison of single-locus disequilibria coefficients between popu-lations. We also present log-linear modeling approaches for the comparison of disequilibria coefficients arising from nonrandom associations between loci. The latter disequilibrium is often referred to, nonrigorously, as linkage disequilibrium. While we adhere to this conven-tion, it should be pointed out that there can be interlo-cus genotypic disequilibria, and that linkage is not essen-tial for such disequilibria to occur.
STATISTICAL MODELS
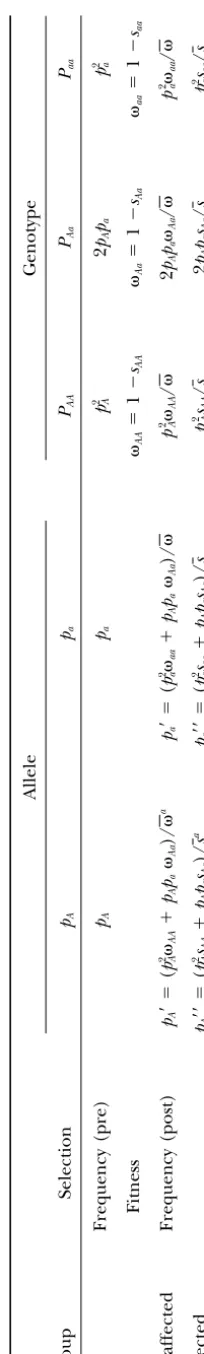
A model for the effect of a selective process on ge-netic variation:The effect of genetic predisposition to a trait on deviations from HWE has been explored largely in the context of natural selection affecting wild populations. Here we apply analogous methodology to populations that have been divided as above into the groups “affected” and “unaffected” by selection, which we define generally as any process that differentiates individuals into two phenotypic groups on the basis of their genotypes at a locus. In Table 1 we present a simple model describing the consequences of selection on ge-netic variation. For a biallelic locus, having allelesAand a with frequencies pA ⫹ pa ⫽ 1, genotype frequencies prior to selection are simply those expected under HWE. In modeling a process of natural selection, differ-ential survival of genotypes can be represented by the ratios of the fitness coefficientsij, whereiandj repre-sent the alleles (Aora in our example). The ratios of fitness coefficients, in turn, are delimited by the corre-sponding selection coefficients (sij). The product of a fitness coefficient with the expected frequency (under HWE) of its corresponding genotype gives the fre-quency of that genotype in the unaffected group. For the sum of genotype frequencies to equal 1 in the post-selection unaffected group, frequencies are normal-ized by dividing each genotype’s frequency in the
unaf-TABLE 1 Changes in allele and genotype frequency after selection Allele Genotype Group Selection pA pa PAA PAa Paa Frequency (pre) pA pa p 2 A 2 pA pa p 2 a Fitness AA ⫽ 1 ⫺ sAA Aa ⫽ 1 ⫺ sAa aa ⫽ 1 ⫺ saa Unaffected Frequency (post) pA ⬘⫽ ( p
2A
AA ⫹ pA pa Aa )/ a pa ⬘⫽ ( p
2a
aa ⫹ pA pa Aa )/ p
2A
AA / 2 pA pa Aa / p
2a
aa / Affected pA ⬘⬘ ⫽ ( p
2sA
AA ⫹ pA pa sAa )/ s a pa ⬘⬘ ⫽ ( p
2saaa
⫹ pA pa sAa )/ sp
2sA
AA / s 2 pA pa sAa / sp
2saaa
/ s See text for detailed explanation. a is the me an fi tne ss of th e una ffect ed gro up and equal s p
2A
AA ⫹ 2 pA pa Aa ⫹ p
2a
aa . s is the eq uival ent fo r the affect ed gro up and equal s p
2sA
AA ⫹ 2 pa pa sAa ⫹ p
2saaa
⫽
1
⫺
.
frequencies in the affected group are governed by the
ln(Paa)i⫽ lnM⫹lni, ratio of selection coefficients. In the standard context
of natural selection in wild populations, the affected wherei⫽1, 2, . . .nfor then groups. The parameter group is taken to be the nonsurvivors and hence ig- Mis a mean effect and so common to all genotypes; nored, with differences between unaffected groups from represents the possible unequal sizes of samples from population to population being of primary interest. In group to group;MArepresents the frequency of allele the context of genetic epidemiology, interest centers Acompared with alleleain the total sample;MAA repre-on comparisrepre-ons of affected with unaffected groups, and sents the HW (monogenic) disequilibrium coefficient selection coefficients may be equated with penetrances. in the total sample; (MA) represents the unequal allele Sosij is the probability of a phenotype given genotype frequencies between groups; and (MAA), the differen-ijandij⫹sij⫽1. Hence,ijwill then be the probability tial monogenic disequilibria between groups. Removing of not having a phenotype given genotypeij. Beyond all terms containingreduces these equations to those affected and unaffected groups, any two or more groups presented inWeir(1996).
undergoing different selection regimes can also be dis- Disequilibria coefficients from the multiplicative and
tinguished by theirandscoefficients. additive statistical frameworks have different
proper-Because genotype frequencies are determined by the ties: The disequilibrium coefficient of the additive ijin the unaffected group andsijin the affected group, model,D, is a function of the three fitness coefficients variation at a causative locus will exhibit differential and the allele frequency,e.g., from the unaffected group departures from HWE in the affected and unaffected D⫽ p2Ap2
a(AAaa ⫺ 2Aa)/2. In some instances theD
co-groups (Table 1). This suggests a novel null hypothesis efficients from the unaffected and affected groups may for comparing affected with unaffected groups: that the be equal. One circumstance when this can occur is if disequilibrium coefficient(s) at a locus are the same in AA⫽1 andaa⫽0. Under these constraints,Din both affecteds and unaffecteds. Both the traditional allele the affected and unaffected samples will be equal when and genotype association tests are indirect assessments Aa ⫽p2
A/(2p2A⫺2pA⫹ 1). More generally,Din the two groups will be equal whenAA⫽ 1 and the following of this null hypothesis.
complex function is true: Below we present log-linear models for tests of
con-cordant equilibria. Although the models and examples
pA⫽
1
(aa⫺2Aa⫹1)2
considered are for biallelic loci, multiallelic loci can be readily accommodated. Examples of applying the
models presented here are available at http://cbis. ⫻
冢
(aa⫺ Aa)(aa⫺2Aa⫹1) anu.edu.au/publications.html as generalized linearin-teractive modeling (GLIM), SAS, or R transcript files. ⫹
冪
((aa⫺2Aa⫹1)2√((Aa2 ⫺ aa)(2Aa⫺2Aa⫹1)) )冣
.Testing groups for concordant equilibria at a single locus:Testing for concordance with HWE in a sample
In contrast, the multiplicative coefficientMAAis indepen-is predominantly performed using an additive statindepen-istical
dent of allele frequency [MAA⫽ AAaa/2
Aain the unaf-model. Consider a biallelic locus with allelesAanda,
fected group andMAA⫽(1⫺ AA)(1⫺ aa)/(1⫺ Aa)2
genotypic frequenciesPAA,PAa,Paa, and allele frequencies
in the affected group]. Given our formulation of 0ⱕ pA ⫹ pa ⫽ 1. Departure from equilibrium expectation
ijⱕ1, the multiplicative coefficients in the two groups is commonly evaluated by whether a disequilibrium
co-will be equal only whenAa⫽ Aa⫽ aa⫽1⁄
2, where the
efficient, namelyD⫽PAA⫺p2
A, differs from 0.
Alterna-genotypes do not differ in their probability of exhibiting tively, the testing of HWE using log-linear modeling
a phenotype. assumes a multiplicative model (additive on the log
In addition to measuring the difference in disequilib-scale) with departures from HW being evaluated by
ria between two samples, the above model also assesses whether the coefficientMAA⫽4PAAPaa/P2Aa differs from
the extent to which two samples are differentiated by 1 (Weir 1996, p. 104). A log-linear framework greatly
allele frequency. In the fully saturated model, allele facilitates the analysis of more complex models as
exist-frequency is evaluated asMA⫽PAa/(2Paa) (Weir1996). ing software packages can be used. To testngroups for
This can be reformulated as (pAAa)/(paaa) for the unaf-concordant equilibria, additional terms are included in
fected sample and [pA(1⫺ Aa)]/[pa(1⫺ aa)] for the the basic log-linear model. There are several
parameter-affected sample. From these equations it can be seen izations for the log of expected genotype frequencies
thatMA of the two samples will be equal when Aa ⫽ in groupiunder the full, or saturated, log-linear model.
aa. It is important to note that theMAterm could still The one we use here can be written as
be significant when this relationship is true.
Example test of groups for concordant equilibria at ln(PAA)i ⫽lnM⫹ lni⫹ 2 lnMA⫹lnMAA
a single locus:The log-linear models were implemented ⫹2 ln(MA)i⫹ ln(MAA)i
TABLE 2
Observed and expected⫹/⌬32 CCR5genotype frequencies from Europeans
Population Genotype Observeda Expected Residualsb
⫹/⫹ 691 701.2 ⫺0.38
HIV⫹ ⫹/⌬32 186 165.7 1.58
⌬32/⌬32 0c 10.7 ⫺3.11
⫹/⫹ 468 457.8 0.48
HIV⫺ ⫹/⌬32 87 107.3 ⫺1.96
⌬32/⌬32 17 6.8 3.88
aData are the sum of genotype frequencies for all cohorts except the ALIVE cohort from Table 2 ofDean
et al.(1996).
bPearson’s residual (Franciset al.1993), calculated as (Observed⫺Expected)/√Expected. Residuals are
estimated from a model without theMAAterm, model 5, Table 3. cTaken to be 0.5.
AIDS cohorts (Deanet al.1996). We include only homo- action terms (MA,MAA) are not significant. This prin-ciple also applies to the two-locus models. Second, for sexual men from the DCG, MAC, and SFCC cohorts.
The frequencies of genotypes in each group are pre- Pearson residuals, calculated as (Observed⫺Expected)/ sented in Table 2. HIV⫺refers to individuals who have
√
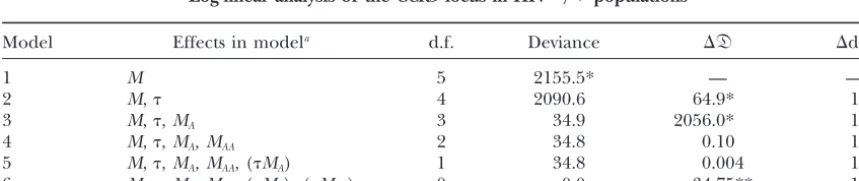
Expected, an absolute value greater than two indicates not contracted, but are at risk for exposure to, HIV (the lack of fit for those categories.resistant group). HIV⫹ refers to individuals that have The significance of group () and allele (MA) terms contracted HIV (the susceptible group). There are four indicates that the HIV⫺and HIV⫹groups are unequal independent parameters in the model and the complete in size, and in the combined sample the ⫹ and ⌬32 sequential addition of model terms is shown in Table alleles are unequal in frequency. The term MAA does 3. Parameters are estimated by maximum likelihood not contribute significantly to this model, consistent assuming a multinomial sampling of genotypes. The fit with the combined affecteds and unaffecteds being of a model is measured as the likelihood-ratio test statis- drawn from a population in HWE. The group-by-allele tic or devianceᑞ⫽ ⫺2 ln(Lc/Lf), whereLcis the likeli- interaction term (MA) is also not significant, indicating
hood estimated under the model of interest andLfthe no difference in allele frequency between groups. We
likelihood estimated under the full model (Franciset note that because the model adjusts for departures from al.1993). The significance for inclusion of an individual HW, the group-by-allele interaction term under this term in the model is assessed by comparing the devi- model will be different from that resulting from the ances of the model with and without the term. The “standard” allele frequency goodness-of-fit test. The difference in deviances,⌬ᑞ, of the two models is distrib- group-by-monogenic disequilibria interaction term in uted approximately as2with degrees of freedom equal the model is highly significant. This result indicates that
to the difference in degrees of freedom of the two mod- group-specific HW disequilibria (i.e.,MAA) coefficients
els (⌬d.f.). significantly improve the fit of the log-linear model. A
When the full hierarchy of models is being considered two-tailed Fisher’s exact test on the genotype distribu-there are some general principles that can be employed tion was also highly significant (P ⱕ 10⫺8), affirming to guide interpretation. First, a nonsignificant residual the validity of the asymptotic approximation used for ⌬ᑞ. While the samples presented in Table 2 contain a deviance for model 4 does not mean that both
inter-TABLE 3
Log-linear analysis of theCCR5locus in HIV⫺/⫹populations
Model Effects in modela d.f. Deviance ⌬ᑞ ⌬d.f.
1 M 5 2155.5* — —
2 M, 4 2090.6 64.9* 1
3 M,,MA 3 34.9 2056.0* 1
4 M,,MA, MAA 2 34.8 0.10 1
5 M,,MA, MAA, (MA) 1 34.8 0.004 1
6 M,,MA, MAA, (MA), (MAA) 0 0.0 34.75** 1
* Significantly different from 0 (P⬍0.01).
small proportion of individuals of non-European
ances-⫹ln(M2
AAB)i⫹ln(M2ABB)i⫹ln(MABAB)i
try, restricting the analysis to Europeans still results in
rejecting the null hypothesis (results not shown). An ln(PAB
Ab)i⫽ln 2⫹lnM⫹lni⫹lnM2A⫹lnMB
examination of the residuals from the model without ⫹
lnMAA⫹lnQ2AB⫹lnMAAB⫹ln(M2A)i theMAAterm (Table 2) reveals an excess of⌬32/⌬32
homozygotes in the HIV⫺ group and deficit in the ⫹ln(MB)i⫹ln(MAA)i⫹ln(Q2AB)i
HIV⫹ group. This is consistent with the hypothesized ⫹
ln(MAAB)i resistance to HIV infection conferred by absence of the
CCR5 receptor (Deanet al.1996). ln(PAb
Ab)i⫽lnM⫹lni⫹lnM2A⫹lnMAA
Testing groups for concordant equilibria at two loci: ⫹
ln(M2
A)i⫹ln(MAA)i
As for HW, departures from linkage equilibrium may
arise from a number of evolutionary processes: selec- ln(PAB
aB)i⫽ln 2⫹lnM⫹lni⫹lnMA⫹lnM2B
tion, random genetic drift, nonrandom mating,
ad-⫹lnMBB⫹lnQ2AB⫹lnMABB⫹ln(MA)i mixture of genetically differentiated populations, and
mutation. There is also a substantial body of theory ⫹ln(M2
B)i⫹ln(MBB)i⫹ln(Q2AB)i
concerning the distributional properties of the
disequi-⫹ln(MABB)i libria coefficients that can exist between two loci (see
Weir1996). ln(PAB
ab ⫹PAbaB)i⫽ln 4⫹lnM⫹lni⫹lnMA
Data for assessing the occurrence of nonrandomness ⫹
lnMB⫹lnSAB⫹ln(MA)i between loci can take two general forms: (1)
phase-known data, where specific chromosomal or gametic ⫹ln(MB)i⫹ln(SAB)i
combinations of variants are explicitly known; and (2)
ln(PAb
ab)i⫽ln 2⫹lnM⫹lni⫹lnMA⫹ln(MA)i
genotypic data with phase unknown. We treat each class
of data separately. ln(PaB
aB)i⫽lnM⫹lni⫹lnM2B⫹lnMBB⫹ln(M2B)i
Consider phase-known data of two loci with alleles ⫹
ln(MBB)i A/aandB/bfromngroups. Under the full model the
log of expected frequencies of the four possible gametes ln(Pab
aB)i⫽ln 2⫹lnM⫹lni⫹lnMB⫹ln(MB)i
in groupi(i⫽1, 2, . . .n) can be parameterized as
ln(Pab
ab)i⫽lnM⫹lni.
ln(PAB)i⫽ lnM⫹lni⫹lnMA⫹lnMB⫹ln MAB
In this model, Mis a mean effect and so common to all bilocus genotypic combinations;,MA, and MB are
⫹ln(MA)i ⫹ln(MB)i⫹ln(MAB)i
the same as for the phase-known model above;MAAand ln(PAb)i⫽ lnM⫹lni⫹lnMA⫹ln(MA)i
MBBare the monogenic disequilibrium coefficients for each locus in the total sample;SAB⫽(MAB⫹MA/B)/2 is ln(PaB)i⫽ lnM⫹lni⫹lnMB⫹ ln(MB)i
the sum of digenic disequilibria for the total sample; ln(Pab)i⫽ lnM⫹lni,
QAB⫽(MABMA/B) is the product of digenic disequilibria for the total sample; MAAB and MABB are the trigenic whereMis a mean effect and so common to all gamete
combinations;andMAare as above;MBrepresents the disequilibria for the total sample; andMAB
AB the quadri-genic disequilibria for the total sample (Weirand Wil-frequency of alleleBcompared with allelebin the total
sample, and MAB represents the digenic disequilibria son1986). All terms in the model involvingrepresent differences between groups, as for the models described (intragametic nonindependence) of alleles at the two
loci in the sample; (MA) and (MB) represent the differ- above.
If gametic phase is known, it may be desirable to ential allele frequency between groups at lociAandB,
respectively; and (MAB) the between-group difference explicitly evaluate all disequilibria terms. In this case, the termsSABandQABcan be replaced byMABandMA/B in digenic disequilibria.
Analyzing phase-unknown genotypic data for disequi- (WeirandWilson1986). The latter two terms repre-sent the intra- and intergametic digenic disequilibria, libria is more complex and involves numerous
disequi-libria terms. Assuming phase for double heterozygotes respectively.
Example test of groups for concordant equilibria at is unknown and that only nine genotypic classes can be
distinguished, under the full model the log of genotype two loci, phase unknown:Because the equations pre-sented for phase-unknown data above are overparamet-frequencies can be expressed as
erized we assume no quadrigenic disequilibria and set
ln(PAB
AB)i⫽lnM⫹lni⫹lnM2A⫹lnMB2⫹lnMAA
the termMAB
AB⫽1. An application of this model to geno-typic counts data from two groups forMNandSblood
⫹lnMBB⫹lnQ2AB⫹lnM2AAB⫹lnM2ABB
group loci (Mourant et al. 1976) is presented (see
⫹lnMAB
AB⫹ln(M2A)i⫹ln(M2B)i
Table 4). These genes are closely linked on chromo-some 4 (RaceandSanger1975). The sequential
TABLE 4
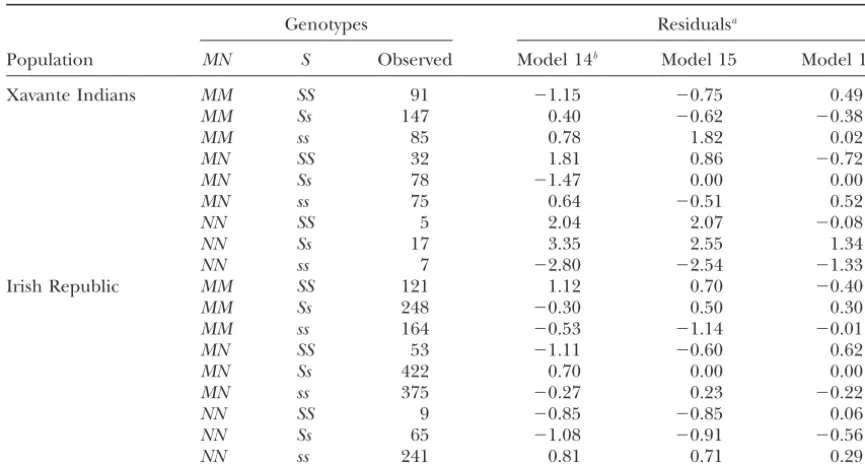
Observed genotype frequencies atMNandSloci from two populations with residuals from three of the models
Genotypes Residualsa
Population MN S Observed Model 14b Model 15 Model 16
Xavante Indians MM SS 91 ⫺1.15 ⫺0.75 0.49
MM Ss 147 0.40 ⫺0.62 ⫺0.38
MM ss 85 0.78 1.82 0.02
MN SS 32 1.81 0.86 ⫺0.72
MN Ss 78 ⫺1.47 0.00 0.00
MN ss 75 0.64 ⫺0.51 0.52
NN SS 5 2.04 2.07 ⫺0.08
NN Ss 17 3.35 2.55 1.34
NN ss 7 ⫺2.80 ⫺2.54 ⫺1.33
Irish Republic MM SS 121 1.12 0.70 ⫺0.40
MM Ss 248 ⫺0.30 0.50 0.30
MM ss 164 ⫺0.53 ⫺1.14 ⫺0.01
MN SS 53 ⫺1.11 ⫺0.60 0.62
MN Ss 422 0.70 0.00 0.00
MN ss 375 ⫺0.27 0.23 ⫺0.22
NN SS 9 ⫺0.85 ⫺0.85 0.06
NN Ss 65 ⫺1.08 ⫺0.91 ⫺0.56
NN ss 241 0.81 0.71 0.29
aPearson’s residual (Franciset al.1993). bModels are indicated in Table 5.
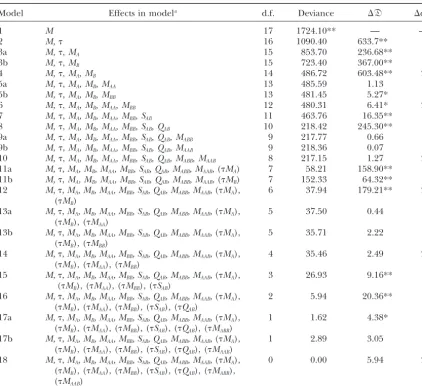
tion of terms to the model is presented in Table 5. As significance of the trigenic disequilibrium term (MABB), resulting from the deficit of Xavante IndianNNss indi-in the sindi-ingle-locus application, the significance of the
, MA, and MB terms reflects unequal frequencies of viduals, may indicate the differential operation of natu-ral selection in these two populations.
groups and alleles. Significance of the monogenic dis-equilibria termMBBand digenic disequilibria termsSAB andQABplausibly arises from both the within-group
link-DISCUSSION
age disequilibrium between these loci (Weirand
Wil-son 1986) and pooling the genetically differentiated Tests of genetic differentiation have commonly in-volved directly comparing allele and/or genotype fre-groups. This interpretation is supported by the highly
significant MA and MB group-by-allele interaction quencies between groups, with possible adjustment for multiple testing. We have noted that an outcome of terms. Interestingly, both group-by-digenic disequilibria
interaction terms are highly significant, while the tri- selective processes is the differential departures from population genetic equilibria at causative genes in af-genic disequilibriaMABBterm is nominally significant.
These latter observations suggest that the relative contri- fected and unaffected groups. Here, approaches have been presented to directly test the null hypothesis that butions of evolutionary forces affecting the interactions
of alleles at these two loci significantly differ between the disequilibria coefficients in different groups are the same. To discuss the attributes of these tests we focus these populations. An examination of the residuals from
models 14–16 indicated that the Xavante Indian popula- primarily on the application of testing for genetic associ-ation.
tion exhibits the greatest departure from expectation.
In particular, Xavante Indian NNss individuals are in Properties of the single-locus test: The single-locus test for concordant equilibria between groups has sev-strong deficit. The role of intra- (MAB) or intergametic
(MA/B) disequilibria in the significance of the digenic eral advantages over standard association tests. The log-linear models allow partitioning of the differentiation disequilibria terms cannot be distinguished as they are
confounded within the termsSABandQAB.It seems plausi- between samples into the contributions of alleles and interallelic interaction. These contributions are con-ble, however, that this difference may result partly from
intragametic disequilibrium since smaller effective pop- founded in the conventional genotype goodness-of-fit test. Disentangling these effects enables explicit assess-ulation sizes, presumably an attribute of the
tradition-ally hunter-gatherer Xavante Indians (Maybury-Lewis ment of hypotheses concerning their roles, reducing the degrees of freedom for tests of complex genetic 1971, p. 35) relative to the agrarian Irish Republic
TABLE 5
Log-linear analysis of theMNandSloci from two populations
Model Effects in modela d.f. Deviance ⌬ᑞ ⌬d.f.
1 M 17 1724.10** — —
2 M, 16 1090.40 633.7** 1
3a M,,MA 15 853.70 236.68** 1
3b M,,MB 15 723.40 367.00** 1
4 M,,MA,MB 14 486.72 603.48** 2
5a M,,MA, MB, MAA 13 485.59 1.13 1
5b M,,MA, MB, MBB 13 481.45 5.27* 1
6 M,,MA, MB, MAA, MBB 12 480.31 6.41* 2
7 M,,MA, MB, MAA, MBB, SAB 11 463.76 16.35** 1
8 M,,MA, MB, MAA, MBB, SAB, QAB 10 218.42 245.30** 1
9a M,,MA, MB, MAA, MBB, SAB, QAB, MABB 9 217.77 0.66 1
9b M,,MA, MB, MAA, MBB, SAB, QAB, MAAB 9 218.36 0.07 1
10 M,,MA, MB, MAA, MBB, SAB, QAB, MABB, MAAB 8 217.15 1.27 2
11a M,,MA, MB, MAA, MBB, SAB, QAB, MABB, MAAB, (MA) 7 58.21 158.90** 1
11b M,,MA, MB, MAA, MBB, SAB, QAB, MABB, MAAB, (MB) 7 152.33 64.32** 1
12 M,,MA, MB, MAA, MBB, SAB, QAB, MABB, MAAB, (MA), 6 37.94 179.21** 2
(MB)
13a M,,MA, MB, MAA, MBB, SAB, QAB, MABB, MAAB, (MA), 5 37.50 0.44 1
(MB), (MAA)
13b M,,MA, MB, MAA, MBB, SAB, QAB, MABB, MAAB, (MA), 5 35.71 2.22 1
(MB), (MBB)
14 M,,MA, MB, MAA, MBB, SAB, QAB, MABB, MAAB, (MA), 4 35.46 2.49 2
(MB), (MAA), (MBB)
15 M,,MA, MB, MAA, MBB, SAB, QAB, MABB, MAAB, (MA), 3 26.93 9.16** 1
(MB), (MAA), (MBB), (SAB)
16 M,,MA, MB, MAA, MBB, SAB, QAB, MABB, MAAB, (MA), 2 5.94 20.36** 1
(MB), (MAA), (MBB), (SAB), (QAB)
17a M,,MA, MB, MAA, MBB, SAB, QAB, MABB, MAAB, (MA), 1 1.62 4.38* 1
(MB), (MAA), (MBB), (SAB), (QAB), (MABB)
17b M,,MA, MB, MAA, MBB, SAB, QAB, MABB, MAAB, (MA), 1 2.89 3.05 1
(MB), (MAA), (MBB), (SAB), (QAB), (MAAB)
18 M,,MA, MB, MAA, MBB, SAB, QAB, MABB, MAAB, (MA), 0 0.00 5.94 2
(MB), (MAA), (MBB), (SAB), (QAB), (MABB),
(MAAB)
* Significantly different from 0 (P⬍0.05); ** significantly different from 0 (P⬍0.01).
aEffects in model are described in the text.
association tests and are intermediate between those for from model 4 and the G value from a likelihood-ratio genotype goodness-of-fit test will be identical when the allele and genotype association tests for multiallelic loci.
Moreover, the test for concordant equilibria can detect pooled sample exhibits perfect HW equilibria. If the pooled sample is not in HW equilibrium, both allele and genetic associations where the underlying genetic
causa-tion is complex. Alternatively, the full hierarchy of mod- genotype goodness-of-fit tests can suffer from changes in type I error from the assumed ␣ level (Schaid and els (Table 3, models 4–6) may be considered and the
basis for rejection of the null hypothesis can be identi- Jacobsen 1999). The incorporation of a disequilibria term in the log-linear model prior to testing for concor-fied. The latter approach avoids the necessity of
applying a multiple test correction that arises when both dant allele frequency or equilibria will have the effect of reducing this bias, similar to the influence of other allele and genotype association tests are performed. In
our example, after rejecting the null hypothesis for corrections aimed at removing bias from HW disequilib-rium (SchaidandJacobsen1999).
model 4 (Table 3) we see that the genotype distribution
difference arises not from allele frequency differences Our numerical analysis implies that the monogenic disequilibria coefficients from the log-linear model will but as a consequence of the differential frequency of
⌬32/⌬32 homozygotes in the two groups. be equal only when genotypes do not differ in their risk of disease. Different genetic etiologies (e.g., multiplica-The log-linear approach should provide
improve-ments in power relative to the conventional association tive or additive genetic allele interactions) should there-fore be detectable. Interestingly, theD coefficients in tests. The conventional genotype goodness-of-fit test is
additivity occurs in a biallelic system (AA ⫽ 1,Aa ⫽ tently pooled in a disproportionate way between affect-eds and unaffectaffect-eds, even unlinked markers can exhibit 0.5, aa⫽ 0). The further instances in which Dof the
two samples can be equal indicate that additive statistical association. As for the standard allele and genotype goodness-of-fit tests, such potential confounding can models are inappropriate to assess groups for
concor-dant equilibria. be avoided by appropriate matching of affecteds and
unaffecteds with regard to ethnic background. If af-Sparse data will cause an apparent increased type
I error rate for the conventional allele and genotype fected and unaffected individuals are matched for eth-nic background, and if there is no disease association, goodness-of-fit test as well as the log-linear models
pre-sented here (because the results concerning the distri- MAAcoefficients of the affected group, unaffected group, and total sample will all be the same, but not equal to 1. bution of the test statistic are asymptotic). The solution
for such sparse data analysis is the same—generating As pointed out above, factors other than disease asso-ciation can also lead to departure from HWE. Clearly, the null distribution of the test statistic by resampling
from the expected tables with the constraint that the elimination of laboratory error as a potential source for departure from HWE is an essential first step. Excluding permuted table marginals are the same as that of the
observed table. laboratory error, it is commonly assumed in genetic
epidemiological studies that HW departure, manifest One of the potential advantages of comparing
dis-equilibria coefficients between groups is that examina- as excess homozygotes, in the random population of unaffecteds necessitates population admixture, and spe-tion of coefficients should provide insights into the
relationship between genotype and phenotype (Her- cific methods are employed to reduce the impact of this bias in evaluation of allele and genotypic frequencies nandez and Weir 1989). For analyses involving the
phase unknown two-locus model, consideration must between affecteds and unaffecteds (Chianoand Clay-ton 1998; Schaid and Jacobsen 1999). Yet available be given to additional four di- and trigenic coefficients.
While the biological basis for significance of such coef- data for single-nucleotide polymorphisms do not sup-port extensive genetic differentiation among the inten-ficients may not be straightforward it seems likely that
biological meaning can be attributed to them (Weir sively studied populations from northwestern Europe (Cavalli-Sforza et al. 1994, p. 268; Goddard et al. and Cockerham 1989). For example, large protein
complexes involving several different genes, or multiple 2000), for example, or even among the major ethnic groups (Barbujaniet al.1997). Moreover, as indicated copies of the same gene, may be candidates in which
different combinations of alleles from the member pro- above, under some combinations of penetrances the affected group may be in HWE while the unaffected teins can impact on the functional attributes of such
complexes. group is in HW disequilibrium. Thus, a presumption of
admixture should be avoided. A shortcoming of HW tests on a single group is that
under some combinations of ij, a group may experi- An important alternative to admixture is the opera-tion of natural selecopera-tion. For natural selecopera-tion to cause ence high levels of selection and yet retain HW
propor-tions (MAA⫽1). This occurs when the heterozygote and detectable HW disequilibrium in a population the fol-lowing are required: substantial fitness differences be-homozygote coefficients fulfill the relationship 2
Aa ⫽
AAaa(LewontinandCockerham1959), resulting in tween genotypes, the selected genotype(s) be
reason-ably common, and the selective force also be reasonreason-ably the appearance of HWE in the unaffected group.
Simi-larly, the inverse situation (s2
Aa ⫽ sAAsaa) will also result common. Given these constraints, natural selection is not expected to be a frequent cause of HW disequilib-in apparent HWE disequilib-in the affected group. Under the latter
condition, the fine scale mapping method of Nielsen rium. However, the classic example of the malarial resis-tance conferred by the-globin allele HbSin African et al. (1999) will fail. However, methods that utilize a
reference sample will be informative when either the populations (Allison 1964), and HW disequilibrium where malaria is endemic, clearly demonstrates that the affected or unaffected group fulfills this condition, since
the coefficients for the other group are not in accord influence of natural selection on endemic human ge-netic variation is not just a theoretical possibility. Fur-with this relationship (i.e., if 2
Aa ⫽ AAaa then s2Aa ⬆
sAAsaa). Thus, whenMAA⫽1 for one group, MAA⬆ 1 for thermore, by virtue of their involvement in regulating important biological functions, human candidate dis-the odis-ther group. Additionally, fulfilling eidis-ther dis-the2
Aa⫽
AAaaor thes2
Aa⫽sAAsaarelationships requires that there ease genes might be reasonably considered a priori to have a higher likelihood of being subject to natural be approximately at least a fourfold difference inor
s, respectively, between the homozygotes. Therefore, selection than anonymous markers. Thus, selective ori-gins for HW disequilibrium in random population unaf-the groups are also likely to exhibit both allele and
genotype frequency differences. fecteds should not be automatically dismissed.
Possible applications of the two-locus tests:The po-A further potential shortcoming of HW-based tests for
association would appear to be sensitivity to distortions tential utility of testing for concordant equilibria in stud-ies of affected and unaffected individuals is not re-arising from population admixture, since this can result
inadver-Aston, C. E.,andS. R. Wilson,1986 Log-linear model analysis of
within and between loci, are likely to be important in
allelic associations. Genet. Epidemiol.3:187–194.
the etiology of the disease phenotype. One consequence Barbujani, G., A. Magagni, E. MinchandL. L. Cavalli-Sforza, of this interlocus dependence can be disequilibria be- 1997 An apportionment of human DNA diversity. Proc. Natl.
Acad. Sci. USA94:4516–4519.
tween the loci. Either of the known or
phase-Cavalli-Sforza, L. L., P. MenozziandA. Piazza,1994 The History
unknown two-locus models may therefore be used to test and Geography of Human Genes. Princeton University Press, for a role of epistatic interactions in genetic association Princeton, NJ.
Chiano, M. N.,andD. G. Clayton,1998 Genotypic relative risks
studies.
under ordered restriction. Genet. Epidemiol.15:135–146.
There is also considerable value in comparing disequi- Cox, N. J.,andG. I. Bell,1989 Disease associations. Chance, artifact, libria coefficients between natural populations. In cases or susceptibility genes? Diabetes38:947–950.
Dean, M., M. Carrington, C. Winkler, G. A. Huttley, M. W. Smith where evolutionary parameters are known to differ
be-et al., 1996 Genetic restriction of HIV-1 infection and
progres-tween population samples, a formal comparison of
dis-sion to AIDS by a deletion allele of the CKR5 structural gene.
equilibria coefficients would provide a valuable test of Science273:1856–1862.
Feder, J. N., A. Gnirke, W. Thomas, Z. Tsuchihashi, D. A. Ruddy theoretical expectations. Additionally, comparing
dis-et al., 1996 A novel MHC class I-like gene is mutated in patients
equilibria coefficients may be used as an exploratory
with hereditary haemochromatosis. Nat. Genet.13:399–408.
tool to assess whether differences exist between popula- Francis, B., M. GreenandC. Payne,1993 The GLIM System: Release
tion samples. 4 Manual.Oxford University Press, Oxford.
Goddard, K. A., P. J. Hopkins, J. M. HallandJ. S. Witte,2000
The causes of genetic differentiation between wild
Linkage disequilibrium and allele-frequency distributions for 114
populations will almost certainly be more complex than single-nucleotide polymorphisms in five populations. Am. J. the genetic model we have outlined for epidemiological Hum. Genet.66:216–234.
Hartl, D. L.,andA. G. Clark,1990 Principles of Population Genetics.
studies (Table 1). In comparing wild populations, the
Sinauer Associates, Sunderland, MA.
differential incidence of any evolutionary process that Hernandez, J. L.,andB. S. Weir,1989 A disequilibrium coefficient can cause departures from HW or linkage equilibrium approach to Hardy-Weinberg testing. Biometrics45:53–70.
Huttley, G. A., M. W. Smith, M. CarringtonandS. J. O’Brien, is a candidate for detected genetic differentiation. The
1999 A scan for linkage disequilibrium across the human
ge-interpretation of genetic differences between popula- nome. Genetics152:1711–1722.
tions will therefore require combining knowledge of Kruglyak, L.,1999 Genetic isolates: separate but equal? Proc. Natl.
Acad. Sci. USA96:1170–1172.
theory with knowledge of population attributes.
Lewontin, R. C.,andC. C. Cockerham,1959 The goodness-of-fit Summary:The ease with which log-linear models can
test for detecting natural selection in random mating
popula-be modified to incorporate different terms has popula-been tions. Evolution13:561–564.
illustrated here by our addition of terms to log-linear Lonjou, C., A. CollinsandN. E. Morton,1999 Allelic association
between marker loci. Proc. Natl. Acad. Sci. USA96:1621–1626.
models of HW and linkage equilibrium. Increasingly
Maybury-Lewis, D.,1971 Akwe-Shavante Society.Oxford University
complex data sets aimed at characterizing patterns of Press, Oxford.
genetic differentiation using multiallelic loci or multiple Mourant, A. E., A. C. KopecandK. Domaniewska-Sobczak,1976
The Distribution of the Human Blood Groups and Other Polymorphisms.
single-nucleotide polymorphisms from multiple genes
Oxford University Press, London.
(Goddard et al. 2000) can also be readily accommo- Nielsen, D. M., M. G. EhmandB. S. Weir,1999 Detecting marker-dated by including additional terms (Zhanget al.1990). disease association by testing for Hardy-Weinberg disequilibrium
at a marker locus. Am. J. Hum. Genet.63:1531–1540.
The models we have presented enable population
sam-Race, R. R.,andR. Sanger,1975 Blood Groups in Man.Blackwell,
ples to be formally tested for concordant equilibria,
Oxford.
providing a biologically intuitive framework for the ex- Schaid, D. J.,andS. J. Jacobsen,1999 Biased tests of association: comparisons of allele frequencies when departing from
Hardy-amination of genetic differentiation. The extensive
the-Weinberg proportions. Am. J. Epidemiol.149:706–711.
ory describing the effect of evolutionary processes on
Slatkin, M.,1994 Linkage disequilibrium in growing and stable
disequilibria coefficients can then serve as a rich back- populations. Genetics137:331–336.
drop from which to understand the nature of biological Theofilopoulos, A. N.,andF. J. Dixon,1985 Murine models of
systemic lupus erythematosus. Adv. Immunol.37:269–390.
processes contributing to the genetic differentiation
be-Weir, B. S.,1996 Genetic Data Analysis II.Sinauer Associates,
Sunder-tween samples. land, MA.
Weir, B. S.,andC. C. Cockerham,1989 Complete characterisation We thank John Hopper, whose comments initiated this work, Robert
of disequilibrium at two loci, pp. 86–110 inMathematical
Evolution-Attenborough and Simon Easteal for comments on the manuscript,
ary Theory, edited byM. W. Feldman.Princeton University Press, and Michelle Vella for assisting us with implementing the models in
Princeton, NJ. SAS.
Weir, B. S.,andS. R. Wilson,1986 Log-linear models for linked
loci. Biometrics42:665–670.
Zhang, Q., M. A. S. MaroofandR. W. Allard,1990 Worldwide pattern of multilocus structure in barley determined by discrete LITERATURE CITED
log-linear multivariate analyses. Theor. Appl. Genet.80:121–128.
Allison, A. C.,1964 Polymorphism and natural selection in human