Available online: https://edupediapublications.org/journals/index.php/IJR/ P a g e | 3471
Determination of Basic Mechanical Parameters of the Tractor Tyre by
Using Universal Approach
MELINATI RAKESH
Assistant Professor, Gandhi Academ of Technical Education,Kodad.
Abstract: Rising fossil fuel prices are leading to an increasing awareness of energy efficiency in plant production. Tillage in particular can consume large amounts of fuel. For four tillage implements (reversible mouldboard plough, short disc harrow, universal-cultivator, subsoiler), this study quantifies the effect of different working depths on fuel consumption, wheel slip, field capacity and specific energy consumption. A four-wheel drive tractor (92 kW) was equipped with a data-acquisition system for engine speed, vehicle speed, wheel speed and fuel consumption. Fuel consumption was measured in the fuel system with an integrated high-precision flow-meter. The results show that the area-specific fuel consumption increased linearly with working depth for both the mouldboard plough and the short disc harrow, but disproportionately for the subsoiler. Wheel slip was found to increase fuel consumption and decrease field capacity performance at all depths. The influence of the engine speed was shown in a separate experiment with a universal-cultivator. Increasing the engine speed from 1,513 r min-1 to 2,042 r min-1 results in an increase of 80% for the fuel consumption rate (L/h) and 35% for the area-specific fuel consumption (L/ha). Future measurement of drawbar pull will allow a more detailed analysis of the energy efficiency losses at the engine, the transmission, and at the wheel/soil interface.
Keywords: fuel consumption, wheel slip, mouldboard plough, subsoiler, universal-cultivator, short disc harrow
1.Introduction
International Journal of Research
Available at https://edupediapublications.org/journals
e-ISSN: 2348-6848 p-ISSN: 2348-795X Volume 05 Issue 01
January 2018
Available online: https://edupediapublications.org/journals/index.php/IJR/ P a g e | 3472
wheel/soil interface (Jahns and Steinkampf, 1982; Schreiber et al., 2004). The term “fuel” is used here exclusively to denote diesel fuel. Additional, soil related, parameters, such as soil texture and organic matter content, influence fuel consumption in soil tillage (McLaughlin et al., 2002; Moitzi et al., 2009). Depending on the soil consistency the fuel consumption increases by 0.5 to 1.5 L ha-1 per centimetre of ploughing depth (Kalk and Hülsbergen, 1999; Filipović et al., 2004; Moitzi et al., 2006).
2.Materials and methods
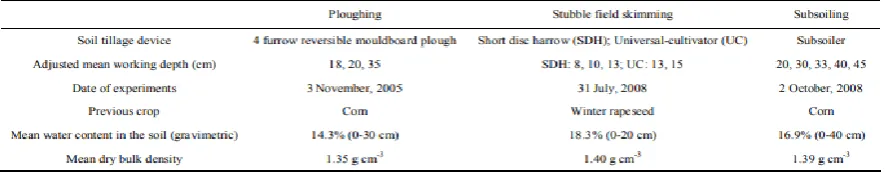
Experimental setup The experiments (Table 1) were conducted on arable fields at the research station Gross Enzersdorf (Lower Austria; 48° 15′ N/ 16° 37′ E) of the University of Natural Resources and Life Sciences Vienna. The site is situated in a semi-arid region with an average precipitation of 546 mm and average temperature of 9.8°C. The silty loam soil belongs to the soil type calcic CHERNOZEM.
Table.1: Overview of experimental set-up
Before the experiment was carried out, each field was probed with soil sample rings (height: 4.8 cm; radius: 3.5 cm; volume: 184.73 cm-3 ) to a depth of 30 cm for the ploughing experiment, 20 cm for the experiment with short disc harrow and universal-cultivator, and 40 cm for the experiment with the subsoiler, respectively. The soil samples were dried in an oven (105°C, 12 h) and afterwards the mean water content (gravimetric) and mean dry bulk density were calculated. The mean working depth of the mouldboard plough was set by measuring the vertical distance between furrow ground and unploughed soil. For the short disc harrow, universal cultivator and subsoiler the mean working depth was calculated by the difference between the vertical distance of the implement-frame to the soil surface in the tillage process and the vertical distance of the implement-frame to a concrete surface.
Specifications for soil tillage implements Table 2 shows the technical data of the soil tillage implements according to manufacturers` specifications.
Tractor and measuring equipment For all experiments a four-wheel drive tractor (Steyr 9125, CNH, St. Valentin, Austria) with a rated engine power of 92 kW (DIN) was used. The four stroke diesel engine with direct injection and exhaust turbo supercharger has six cylinders (vertical in line) with a total
Available online: https://edupediapublications.org/journals/index.php/IJR/ P a g e | 3473
Process parameters The process parameters were determined using a variety of sensors (Table 3). For the calculation of the wheel slip (s) the parameters “wheel speed” (v0) and
“vehicle speed” (v) are required (Equation (2)). 100 0 0 v v v s (2) where, v0: wheel
speed, km h-1 ; v: vehicle speed, km h-1 ; s: wheel slip, %. The theoretical field capacity
(Ctheo, ha h-1 ) does not account for wheel slip and is defined as: v w0.1 0 C theo (3)
where, w is technical working width, m. The effective field capacity (Ceff, ha h-1 ) accounts
for wheel slip by replacing wheel speed v0 with vehicle speed v: 0.1 eff (4) v wC The
area-specific fuel consumption (QA1, L ha-1 ) with slip is defined as: QA Q Ceff / 1 (5)
where, Q is fuel consumption rate, L h-1 The area-specific fuel consumption (QA2, L ha-1 )
without wheel slip is calculated with the theoretical field capacity: QA Q Ctheo / (6)2 The
area-specific fuel consumption with slip (QA1) is calculated with the vehicle speed (v), whereas the fuel consumption without slip (QA2) is calculated with wheel speed (v0).
Results and discussion
International Journal of Research
Available at https://edupediapublications.org/journals
e-ISSN: 2348-6848 p-ISSN: 2348-795X Volume 05 Issue 01
January 2018
Available online: https://edupediapublications.org/journals/index.php/IJR/ P a g e | 3474
which is a result of increased drawbar power demand. For the working depth of 35 cm, this slip between wheel and soil consumes 1.1 L ha-1 of the total area-specific fuel consumption QA1 of 18.29 L ha-1 .
Fig.1: Measuring tyre contact length
Coefficient of stiffness can be determined in the following ways:
1. statically, according to the slope of the curve of tyre deflection versus vertical load,
and
2. dynamically, according to the natural frequency of tyre vertical vibration.
Damping coefficient can be obtained through the time response of free vertical damped vibration by using logarithmic decrement method. Vibration is excited by the free fall of the tyre from the certain height level ("drop test"), which does not have to be much higher than the static equilibrium height. It is well known from the previous investigations (e.g. [1]) that both tyre stiffness and especially damping are dependent on both excitation frequency and the tyre rolling speed. Therefore, results obtained in this work should be viewed as more or less rough approximation. More broad set of test data in view of free damped vibration response with different mass values (meaning different natural frequencies of the system) would though enable empirical modelling of damping coefficient dependence on excitation frequency.
MEASUREMENTS RESULTS
Vertical load, Tyre Deflection and Contact Length
Available online: https://edupediapublications.org/journals/index.php/IJR/ P a g e | 3475
Fig.2: Dependence between tyre deflection f and the
vertical load ZG for different pressure values; 1-0,8 bar, 2-1,1 bar, 3-1,4 bar, 4-1,7 bar, 5-2,0 bar
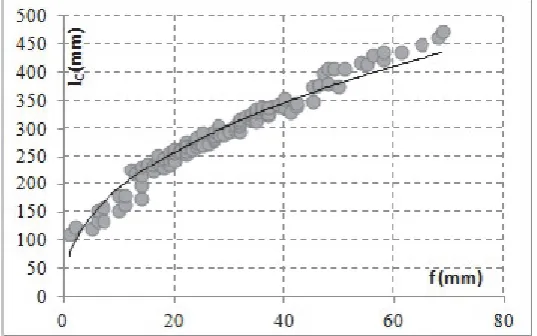
Fig.3: Dependence between contact length lC and tyre
deflection f
Tyre Radial Stiffness and Damping
Results for the statically determined stiffness coefficients for different tyre pressure values were obtained according to the relation (8), by using curves shown in the Fig. For
dynamically determined stiffness, relations (4), (6) and (7) were used. Parameters TD and zi
International Journal of Research
Available at https://edupediapublications.org/journals
e-ISSN: 2348-6848 p-ISSN: 2348-795X Volume 05 Issue 01
January 2018
Available online: https://edupediapublications.org/journals/index.php/IJR/ P a g e | 3476
Fig.4: Dependence of statically and dynamically
determined stiffness coefficients on pressureg
Table.2: Overall results of the stiffness coefficient
Calculations
Available online: https://edupediapublications.org/journals/index.php/IJR/ P a g e | 3477
Fig.5: An example of the oscillogramme - time history of
tyre free response after the drop-test; t- time, h- tyre
height with respect to static equilibrium
Results presented in the Table 2 for dynamically determined stiffness coefficient values represent mean values of measurements for three different levels of tyre static load e.g. system mass/weight (according to Table 1). Results for individual values of tyre static load are shown in the Table 3.
Table.3: Results of dynamically determined stiffness
coefficient calculations
CONCLUSION
non-International Journal of Research
Available at https://edupediapublications.org/journals
e-ISSN: 2348-6848 p-ISSN: 2348-795X Volume 05 Issue 01
January 2018
Available online: https://edupediapublications.org/journals/index.php/IJR/ P a g e | 3478
linearity, although linear behaviour can be used as good approximation in the area of nominal tyre load. It was observed that the dependence between tyre deflection and contact length is of purely geometrical nature, i.e. it is not affected by the tyre pressure and vertical load. Some discrepancy was observed between statically and dynamically obtained results for linearized stiffness coefficient, which is ascribed to non-linear nature of tyre response. Linearized stiffness and damping coefficient values can be used in certain applications of tyre viscoelastic structure modelling. Caution is though needed as real tyre exhibits dependence of these values on rolling speed and excitation frequencies. Relationships between tyre load, deflection and contact length can be useful when investigating tyre geometric or filtering properties such as enveloping behaviour.
REFERENCES
[1] Spotts Kissing A., Göhlich H. (1988). Ackerschlepper-Reifendynamik, Teil 1:
Fahrbahnund Prüfstandsergebnisse, Grundlagen Landtechnik 38 (1988) 3, 78-87, ISSN
0017-4920
[2] Scarlett, A.J. et al (2005). Whole-body vibration on agricultural vehicles, Research report,
Silsoe Research Institute and RMS Vibration Test Laboratory for the Health and Safety Executive, HSE
Books, ISBN 0 7176 2970 8, Silsoe
[3] Schlotter V. (2005). Einfluss dynamischer Radlastschwankungen und
Schräglaufwinkeländerungen auf die horizontale Kraftübertragung von
Ackerschlepperreifen, Doctoral thesis, Universität Stuttgart, Shaker Verlag 2006, ISSN
0931-6264.
[4] Stojić B., Poznanović N., Poznić A.: Test Facility forInvestigations of Quasistatic
Enveloping Behavior ofTractor Tire, 8th International Symposium "Machine and Industrial
Design in Mechanical Engineering", 2014, Balatonfüred, HU, ISBN 978-86-7892-615-0
pp. 89-92, Faculty of Technical Sciences Novi Sad, Serbia
[5] Stojić B. (2014). Modeliranje oscilatornog ponašanja traktorskih pneumatika veštačkim
neuronskim mrežama (Tractor tire vibration behavior modeling by using artificial neural
networks), Doctoral thesis, FTN Novi Sad
[6] Stojić B., Poznanović N., Poznić A. (2015). Research and Modeling of the Tractor Tire
Enveloping Behavior, Journal of Vibration and Control, DOI: 10.1177/1077546315576302,