APPLYING CRITICAL-POINTS METHOD IN THE PRESENCE OF PHASE SHIFT DUE TO FEED LINE C. Y. Wu, K. Zhang, G. Wei, and J. D. Xu
School of Electronics and Information Northwestern Polytechnical University Xi’an, Shaanxi 710072, China
Abstract—The critical-points method is adopted for measuring unloaded Q-factor of microwave resonators in the presence of phase shift caused by the feed line. The result is calculated from four frequencies of three points in the resonator’s impedance trace. In fact, the resonator’s impedance trace rotates in Smith Chart by the phase shift. If Q-factor were gotten directly from the measured impedance including feed line rather than the equivalent impedance of the resonator without feed line, the performance of measurement will be impaired. To de-embed the phase shift, objective function was introduced to find the proper rotation angle caused by the feed line instead of calibration using extra measurement. Another advantage of the proposed method lies in the fact that no special attention is needed to distinguish magnetic coupling and electric coupling. The effectiveness of the proposed method was demonstrated by one set of simulation data and two measurement examples, namely, a low Q dielectric resonator and a high Q hollow cylindrical cavity.
1. INTRODUCTION
Loaded Q-factor QL and unloaded Q-factor Q0 are important
parameters of microwave resonator. One resonator may have different
QL if an external circuit or coupling coefficient is variable. On the contrary, the Q0 is unique for one mode. And Q0 is needed when
determining material’s loss tangent or upper limits for the overall resonator performance [1].
the transmission method [2]. When the reflection method is adopted, measurement using vector data, which have more information, is considered to be more accurate than using scalar data [3, 4].
Among those methods, the critical-points method introduced by Sun and Chao is fast and accurate [5]. And this method was further referenced and extended by lots of people [6, 7]. It is based on simple closed-form expressions and is free from curve fitting to measurement data. In this method, resonator is represented as a parallel or series equivalent circuit, and the coupling circuit has loss and energy storage.
Q0 is calculated from four frequencies of three points, that is, one
detuned crossover point and two critical points of imaginary part of the impedance.
In fact, the input impedance measured by vector network analyzer (VNA) not only is the equivalent impedance of a resonator and coupling circuit, but also includes phase shift due to feed line, because the VNA is calibrated at the measurement point instead of the coupling point. So the measurement impedance trace in Smith chart has the same shape as the equivalent impedance, but not in the same position. It is rotated from the equivalent impedance trace. The phase shift will cause large errors if the measured impedance were directly used in the critical-points method. Lye solved this problem by two feed lines with difference length to de-embed the phase shift [7].
In this paper, an objective function is introduced to find the proper phase shift without extra complex measurement. The argument of the objective function is the phase shift which is the rotation angle of impedance trace in Smith chart. If the objective function reaches zero, the rotation angle is actually the phase shift which is used to de-embed the feed line. And this method does not need to distinguish magnetic coupling and electric coupling as [5], because these two kinds of coupling can change into each other with an extra one-quarter-wavelength transmission line and this line can be unified into the rotation angle mentioned above. To evaluate the performance of the proposed method, results calculated from simulation data and measurement data of two types of resonators, namely, a low Q dielectric resonator and a high Q hollow cylindrical cavity, are presented.
2. EQUIVALENT-CIRCUIT MODEL
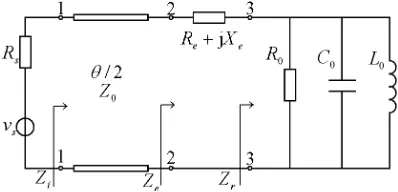
Xe is positive (2πf Le) or negative (−1/2πf Ce) depending on whether the coupling is inductive or capacitive. The unloaded resonator is represented by a parallel resonant circuit, which is made up ofR0,C0,
and L0. The feed line has a phase shift of θ/2and a characteristic
impedance ofZ0. Typically,Z0=Rs= 50 Ω.
Figure 1. General equivalent circuit of microwave resonator including the feed line.
The input impedance at plane 2-2 is shown as following:
Ze=Re+jXe+
1
1
R0+j
ωC0−ωL01
=Re+jXe+
R0
1+jQ0
f f0−
f0 f
=
Re+
R0
1 + (2Q0δD)2
+ j
ω0(1 +δ)Le−
2Q0δDR0
1 + (2Q0δD)2
(1)
where Q0 = R0
C0/L0, f0 = 1/2π √
L0C0, δ = (f −f0)/f0, and D= (1 +δ/2)/(1 +δ).
A typical impedance trace ofZe in Cartesian coordinate is given in Fig. 2.
In Fig. 2, the frequencies of the maximum and the minimum of the imaginary part ofZeare marked asf1 andf2. And the frequencies
of detuned crossover point are indicated as f3 and f4. The unloaded
resonant frequencyf0and unloaded Q-factorQ0can be calculated from f1 ∼f4 using the critical-points method [5]:
f0 = (f1+f2)/2(2)
Q0 = |x|f0/|f1−f2| ≈f0/|f1−f2| (3)
where
x2 = b−2a−1 +
(b−2a−1)2−4(b+a)(a−1)
2(b+a) (4)
a = 1 + f
2
1 +f22+ 2f1f2−4f3f4
2(f1f3+f1f4+f2f3+f2f4+ 4f3f4)
(5)
b =
δ4D4−δ3D3 δ2−δ1
2
(6)
Dk = (1 +δk/2)/(1 +δk), δk= (fk−f0)/f0, k= 1∼4 (7)
Actually, the impedance measured by VNA is Zi at plane 1-1, rather than Ze at plane 2-2. Due to the presence of feed line, Zi is rotated from Ze in Smith Chart by θ= 4πf l/v, where l is the length of the feed line, andv is the speed of wave. For a high Q resonator, the measurement frequency range is narrowband. Sof is approximately a constant. Andθ is only dependent onl. In the critical-points method, the impedance trace, which is used to calculatef0 andQ0, isZe rather thanZi. Thereforeθshould firstly be obtained after the measurement of Zi. ThenZe is deduced fromZi and θ by transmission line theory. And finally, f0 and Q0 are calculated by (2)–(7) from Ze. It will be shown in the next section that there will be large errors in f0 and Q0
if they were directly calculated fromZi instead ofZe. The equation of deducingZe from Zi is:
Ze=Z0
Zi−jZ0tan (θ/2) Z0+ jZitan (θ/2)
(8)
If θ is the proper rotation angle in Smith chart, Ze calculated from (8) is the impedance at plane 2-2. The real parts of Ze of the detuned crossover point are equal. Therefore we get
Re+
R0
1 + (2Q0δ3D3)2
=Re+
R0
1 + (2Q0δ4D4)2
resulting in
J(θ) =δ3D3+δ4D4 = 0 (10)
substitute (2) and (7) into (10), we get
J(θ) = f3
f1+f2 −
f1+f2
4f3
+ f4
f1+f2 −
f1+f2
4f4
= 0 (11)
There are two reasons that (11) can be used as an objective function to find the rotation angle caused by feed line. Firstly, (9) is derived from (1) which is an expression of Ze rather than Zi. And the expression of Zi which includes the feed line is different from Ze. Even though the two impedances at the crossover point ofZiare equal, the expressions of the real parts of them are not (9). Therefore (11) can not be satisfied. Secondly, the critical points of the imaginary part of the impedance in Smith Chart vary with the rotation angle. At the same time, f1 and f2 change according to the critical points. If
the wrong rotation angle were chosen, (11) will not be zero, despitef3
and f4 remain the same. An expression of the imaginary part at the
crossover point is not recommended to be used as an objective function because of the complex form and ambiguity. The procedure of finding the rotation angle θis:
1. let the rotation angle θ vary throughout a period, such as from
−180◦ to 180◦;
2. calculate the potentialZe with Zi and θ by (8);
3. find four frequencies f1 ∼f4 of one detuned crossover point and
two critical points in the potential Ze trace calculated in step 2 according to differentθ;
4. calculate objective function J(θ) with f1 ∼ f4 found in step 3
by (11);
5. determineθ byJ(θ) when it reaches zero.
3. SIMULATION RESULTS
One set of simulation data is used to verify the proposed method. In Fig. 1, let R0 = 10 Ω, C0 = 1.5915 nF, L0 = 0.15915 pH, Re = 10 Ω,
Le = 7.8585 pH, and θ = 0◦. Then Q0 = 1000 and f0 = 10 GHz
theoretically. Ze is gotten using this set of parameters near the resonant frequency by (1). In this case, Zi = Ze, because θ = 0◦. The objective function J(θ) is calculated using the data of rotated
zero at 0◦ as expected. It means J(θ) can be used to determine the proper angle that Ze rotates from Zi in Smith Chart. It is also seen that J(θ) has another zero. Fortunately, this unwanted zero can be easily distinguished from the proper one by the trend of the curve.
f0 and Q0 are also calculated versus θ, as shown in Fig. 4. The two
curves both reach their theoretical values at 0◦, namely 10 GHz and 1000 respectively. The slope ofJ(θ) is very small near 0◦. Thus it will cause big errors when the rotation angle being determined. However it does not distort the precision off0 andQ0, because the slopes of them
are also very small near 0◦.
Figure 3. Objective function
J(θ) of simulation data.
Figure 4. Resonant frequency and unloaded Q-factor versus rotation angle of simulation data.
4. EXPERIMENTAL RESULTS
To illustrate the above principle and procedure in Section 2,f0andQ0
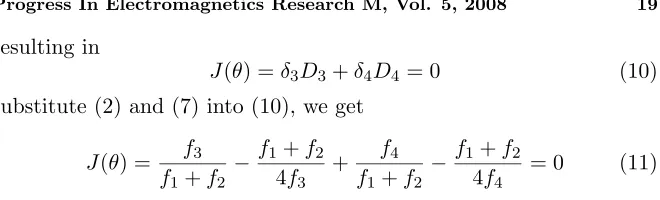
of two resonators, a dielectric resonator and a high Q hollow cylindrical cavity, were measured. The input impedances of the two resonators were measured by Agilent VNA E8363B. In the case of dielectric resonator, the measurement input impedance is shown in Fig. 5. And the objective function versus the rotation angle is calculated using the procedure from step 1 to 4 given in Section 2. In Fig. 6, the objective function reaches zero when rotation angle equals−55◦. That means the wanted rotation angle caused by the feed line is−55◦. And the proper
Ze is gotten from Zi by (8), where θ =−55◦. Thus, f0 = 6.5021 GHz
andQ0 = 1492are estimated from (2)∼(7) with the properZe. f0and
Figure 6. Objective function versus rotation angle of the dielectric resonator.
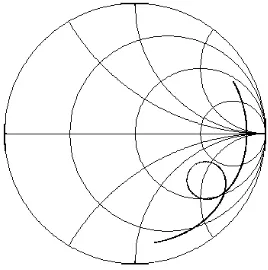
Figure 7. Resonant frequency and unloaded Q-factor versus rotation angle of the dielectric resonator.
Q0 versus the potential rotation angle are shown in Fig. 7. Figs. 8–10
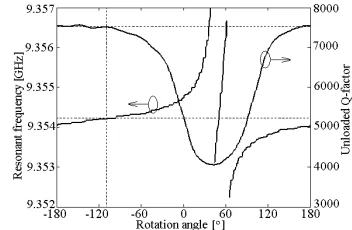
show the measured and calculated curves of a high Q hollow cylindrical cavity, which further demonstrate the performance of the proposed method. In this example, the wanted rotation angle is −42◦. And,
f0 = 10.2377 GHz and Q0 = 16915. The curves of f0 and Q0 versus
the potential rotation angle of the two resonators are similar to the curves in theory as shown in Fig. 4. It can be seen from the curves that if a wrong rotation angle were chosen or no rotation angle were used at all, there would be large errors in the results off0 andQ0.
Figure 9. Objective function versus rotation angle of the cylindrical cavity.
Figure 10. Resonant frequency and unloaded Q-factor versus rotation angle of the cylindrical cavity.
5. CONCLUSION
REFERENCES
1. Kumar, A., S. Sharma, and G. Singh, “Measurement of dielectric constant and loss factor of the dielectric material at microwave frequencies,”Progress In Electromagnetics Research, PIER 69, 47– 54, 2007.
2. Kajfez, D., S. Chebolu, M. R. Abdul-Gaffoor, and A. A. Kishk, “Uncertainty analysis of the transmission-type measurement of Q-factor,” IEEE Trans. Microw. Theory Tech., Vol. 47, No. 3, 367–371, 1999.
3. Kajfez, D., “Q-factor measurement with a scalar network analyzer,”Proc. Inst. Elect. Eng., Vol. 142, No. 5, 369–372, Pt. H, 1995.
4. Kajfez, D. and E. J. Hwan, “Q-factor measurement with network analyzer,” IEEE Trans. Microw. Theory Tech., Vol. 32, No. 7, 666–670, 1984.
5. Sun, E. Y. and S. H. Chao, “Unloaded Q measurement — The critical points method,” IEEE Trans. Microw. Theory Tech., Vol. 43, No. 8, 1983–1986, 1995.
6. Wang, P., L. H. Chua, and D. Mirshekar-Syahkal, “Accurate characterization of low-Q microwave resonator using critical-points method,” IEEE Trans. Microw. Theory Tech., Vol. 53, No. 1, 349–353, 2005.