Beamforming of Frequency Diverse Array Radar with Nonlinear
Frequency Offset Based on Logistic Map
Zhonghan Wang, Tong Mu, Yaoliang Song*, and Zeeshan Ahmad
Abstract—In this paper, a multi-carrier nonlinear frequency modulation system based on pseudo-random frequency offset is designed. The reduction of the main lobe 3 dB width and the side-lobe peaks cannot be realized simultaneously in conventional beamforming schemes, especially when the number of array elements remains unchanged. The proposed system can reduce the main-lobe 3 dB width and suppressing the side-lobe peaks simultaneously. This is done by adjusting the number of sub-signals, frequency offset coefficient and the inter-element spacing. Then, through time slot processing, signal power is focused on different targets. Numerical simulation experiments are implemented to validate the theoretical analysis of the proposed methodology, and comparisons with other techniques are made.
1. INTRODUCTION
Unlike phased-array antenna, the frequency diverse array (FDA) antenna controls the range-angle dependent transmit energy distribution [1], instead of steering a beam towards a desired direction only, as in [2]. On account of this feature, FDA plays an important role in many areas. Usually, the main lobe of a spatial power pattern is desired as sharp as possible. The waveforms of the transmitted signals determine the focusing performance of the array system. Therefore, an excellent frequency diverse array based on waveforms design is desired.
FDAs based on cross-array elements of progressive frequency offset were first proposed by Antonik et al. [3, 4]. However, the spatial power pattern generated by FDAs with progressive frequency offset has multiple-maxima. As a result, the maximum power will appear in undesired area because angular coupling cannot be eliminated. Logarithmic frequency offset has been applied in [5] and [6], which can achieve a maximum value at the target with no maximum value at any other point in the space. However, the signal power will focus on the target point only if t = 0. Another kind of nonlinear frequency offset, which is based on hamming window, has been applied in [7]. However, this solution is affected by the same time-variant issue as in [5] and [6]. A compensated time-modulation Optimized Frequency Offset (C-TMOFO) scheme has been proposed in [8, 9]. It enables the signal power to reach the maximum at the target within the duration of the pulse. However, the optimization process of C-TMOFO is computationally expensive for real-time processing. The desired focus position cannot be modified in time, since it requires a large amount of memory to store the optimized values for all possible targets in advance for the scan space. In that case, the application scenario of the C-TMOFO scheme is limited. The combination of the nonlinear frequency modulation and nonlinear inter-element frequency offset has been used in [10–13], to generate spatial focusing waveforms. In these schemes, the working time of each element is controlled by a corresponding switch. Thus, the array elements are not fully utilized. Differently, a time-modulated array excitation with periodic sum-of-weighted-cosine pulses has been proposed in [14]. However, the energy of the transmitted signal is reduced due to the
Received 31 October 2017, Accepted 18 January 2018, Scheduled 27 January 2018
* Corresponding author: Yaoliang Song ([email protected]).
amplitude weighting. An S-shaped range-angle beampattern has been achieved in [15] by combining nonlinear frequency modulation and logarithmic frequency offsets. A convex-multi-log-FDA system has been proposed in [16] in order to generate dot-shaped range-angle beampatterns. However, the coefficients of each sub-signal need to be optimized at each instant during the pulse duration.
In this paper, we propose a multi-carrier NLFM FDA system based on pseudo-random frequency offset. The pseudo-random frequency offset is generated by Logistic map and applied to eliminate the angle coupling. Nonlinear frequency modulation is applied to eliminate range coupling. This scheme has three main features: 1) the system is simplified by omitting the optimization algorithm; 2) signal power will focus on different targets during desired time period; 3) four tunable parameters make the system more flexible.
The rest of this paper is organized as follows. Section 2 presents the proposed scheme. More specifically, in this section, the theories of focusing signal power on a single-target and multi-targets are given, respectively. Then, Section 3 reports and discusses a set of simulation examples. Finally, conclusions are drawn in Section 4.
2. PROPOSED SYSTEM DESIGN
2.1. Theory of Focusing Signal Power on a Single-Target
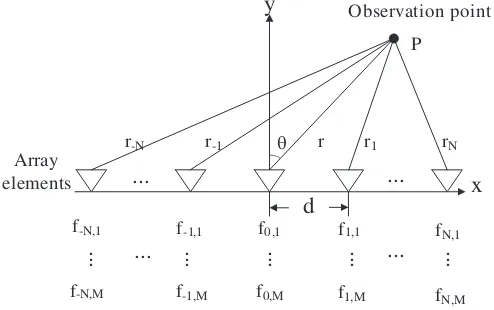
Let us consider a uniformly-spaced linear array consisting of (2N+ 1) elements, as shown in Fig. 1. The observation point P is in the far field. rn is the range between the nth element and the observation point. θ is the azimuth angle between the observation point and the center element. f0 is the center
carrier frequency, and Δfn,m(t) is the frequency offset of each element. The frequency of each element is fn,m(t) = f0 + Δfn,m(t), t ∈ [0, T], where n (−N ≤ n ≤ N) represents the n−th element, m
(1≤m≤M) them−th sub-signal on each element, and T the pulse width.
r-N r-1 r r1 rN
... ...
y
x d
f0,1 f-1,1
f-N,1 f1,1 fN,1
f0,M f-1,M
f-N,M f1,M fN,M
... ...
... ... ... ... ...
Observation point
P
Array elements
θ
Figure 1. A uniformly-spaced linear array consisting of (2N+ 1) elements.
The transmitted signal of each element can be expressed as
Sn,m(t) =e−j2π(fn,m·t+ϕn,m), t∈[0, T] (1)
Then the resulting array factor observed at the target position (rP, θP) can be derived as
AF(t;rP, θP) =
N
n=−N
M
m=1
Sn,m(t−rnPC) (2)
whereC is the speed of light in free space. The frequency offset function Δfn,m(t) is designed as
Δfn,m(t) = K·x|n|·M+m
Correspondingly, the phase ϕn,m is designed as
ϕn,m=f0·rPn
C−K·x|n|·M+m (4)
wherexnis the Logistic map: xn+1= 4·xn(1−xn), x0 = 1/3, andKis the frequency offset coefficient.
Obviously, the phaseϕn,m of each sub-signal is fixed. For narrowband system, Δfn,m(t) should satisfy
the condition |Δfn,m(t)|/f0 <0.1. Thus, the pulse width T and frequency offset coefficient K should
respectively satisfy the following condition.
⎧ ⎪ ⎨ ⎪ ⎩
T <minrPnC, (−N ≤n≤N)
f0·
T−rnPC
10·x|n|·M+m < K <
−f0·
T −rPnC 10·x|n|·M+m
(−N ≤n≤N), (1≤m≤M) (5)
Taking the far-field approximation, we have
rnP ≈rP −ndsinθP (6)
By substituting Eqs. (3), (4) and (6) into Eq. (1), the resulting transmitted signal model is given by
Sn,m(t) = exp
⎧ ⎪ ⎪ ⎨ ⎪ ⎪ ⎩−j 2π ⎡ ⎢ ⎢ ⎣ ⎛ ⎜ ⎜ ⎝f0+
K·x|n|·M+m
t−r
P −ndsinθP
C
⎞ ⎟ ⎟
⎠t+f0·r
P −ndsinθP
C −K·x|n|·M+m
⎤ ⎥ ⎥ ⎦ ⎫ ⎪ ⎪ ⎬ ⎪ ⎪ ⎭ (7)
Similarly, by substituting Eqs. (3), (4) and (6) into Eq. (2), the resulting array factor observed at position (r, θ) can be derived as
AF(t;r, θ) =
N
n=−N
M
m=1
Sn,m(t−rn/C)
=
N
n=−N
M m=1 exp ⎧ ⎪ ⎪ ⎨ ⎪ ⎪ ⎩−j 2π ⎡ ⎢ ⎢ ⎣ ⎛ ⎜ ⎜ ⎝f0+
K·x|n|·M+m
t−rP−ndsinθP C ⎞ ⎟ ⎟ ⎠
t−r−ndsinθ C
+f0r
P−ndsinθP
C −K·x|n|·M+m
⎤ ⎥ ⎥ ⎦ ⎫ ⎪ ⎪ ⎬ ⎪ ⎪ ⎭
Consequently, the resulting power pattern at targetP can be expressed as
AF(t;rP, θP)= (2N + 1)·M, t∈[0, T] (8) It can be seen from Equation (8) that the maximum energy of the signal is obtained at the target point P in the pulse duration. By normalization, the final transmitted signal model can be obtained as
⎧ ⎪ ⎪ ⎪ ⎪ ⎪ ⎪ ⎪ ⎪ ⎪ ⎨ ⎪ ⎪ ⎪ ⎪ ⎪ ⎪ ⎪ ⎪ ⎪ ⎩
Sn,m(t) = 1
(2N + 1)·M ·exp{−j2π(fn,m·t+ϕn,m)}
fn,m(t) =f0+
K·x|n|·M+m
t− r
P −ndsinθP
C
ϕn,m=f0·r
P −ndsinθP
C −K·x|n|·M+m
(9)
2.2. Theory of Focusing Signal Power on Multi-Targets
When it comes to multi-targets, the slot processing mode is used. Different time periods are assigned to different targets. In each time period, signal power is focused only at the corresponding target. Therefore, the targets location (rP, θP) can be designed as
rP(t) = [ε(t−tk−1)−ε(t−tk)]rk
θP(t) = [ε(t−tk−1)−ε(t−tk)]θk
where, k indicates the time slot number, and ε(t) is a step function. Correspondingly, each sub-signal frequency and phase are designed as
⎧ ⎪ ⎪ ⎪ ⎪ ⎨ ⎪ ⎪ ⎪ ⎪ ⎩
fn,m(t) =f0+
K·x|n|·M+m
t−r
P(t)−ndsinθP(t)
C
ϕn,m=f0·r
P(t)−ndsinθP(t)
C −K·x|n|·M+m
(11)
3. NUMERICAL SIMULATIONS
This section provides numerical simulation results to validate the theoretical model proposed earlier. More precisely, the reported results are intended to: 1) verify the effectiveness of the proposed scheme to focus the signal power at a single-target and multi-targets during the pulse duration; 2) demonstrate the performance of the proposed scheme with respect to previous methods including C-TMOFO scheme and multi-log FDA scheme.
3.1. Focused Transmit Beampatterns Synthesis
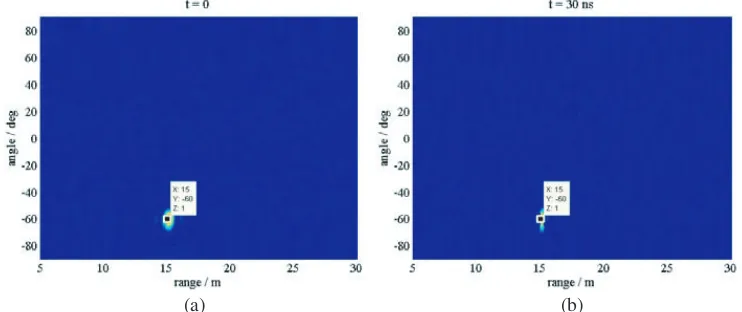
In this experiment, the FDA system parameters are as follows: the number of array elements is 21; f0 = 3 GHz is the center carrier frequency; the number of sub-signals is M = 4; frequency offset
coefficient is K = 20; the inter-element spacing is d = λ0/2 = 0.05 m; T = 30 ns is the transmitted
signal pulse duration. The numerical simulation parameters are as follows: the whole range-angle region is Ω ={(r, θ)|5 m≤r≤30 m, −π/2≤θ≤π/2},rstep = 0.1 m andθstep=π/720 are the accuracies of space grid, and the accuracy of time iststep= 1 ns. Besides, the target is located at (15 m,−π/3).
The resulting normalized power patterns at time instantst= 0 andt= 30 ns are shown in Figs. 2(a) and 2(b), respectively. The distribution of signal power at the target location over time is shown in Fig. 3. Fig. 3(a) shows the distribution of the signal power on the range and time dimension at θ = −π/3. Meanwhile, Fig. 3(b) represents the distribution of signal power in azimuth and time dimension at r= 15 m.
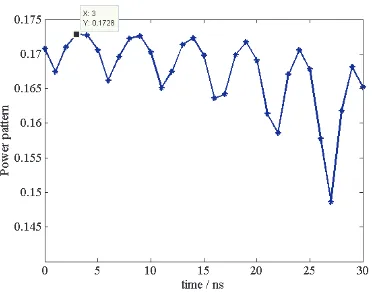
It is observed from Fig. 2 and Fig. 3 that the maximum power of the signal is always obtained at the target P within the pulse width. The maximum side-lobe peak at each instant is shown in Fig. 4. During the pulse duration, the normalized maximum side-lobe peak appears att= 30 ns, with a value of 0.1728. Taking into account Fig. 2, Fig. 3 and Fig. 4, it is proved that the proposed scheme can precisely focus the signal power at the target P during the pulse duration.
In the pulse duration, the 3 dB width in the range and angle dimension vary with time, as shown in Fig. 5(a) and Fig. 5(b), respectively. It can be seen that with the evolution of time, the focusing on
(a) (b)
(a) (b)
Figure 3. The distribution of signal power at the target over time, (a) in the range and time dimension at θ=−π/3, (b) in the azimuth and time dimension atr= 15 m.
Figure 4. The maximum side lobe peak at each instant.
the range gets concentrated, while the focusing on the angle gets blurred.
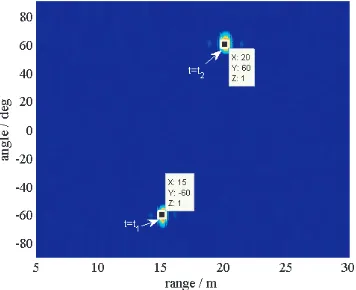
When it comes to multi-targets, let us assume that there are two targets respectively located at (15 m,−π/3) and (20 m, π/3). The pulse duration is divided into two time slots (slot a: 0 < t <15 ns and slot b: 15 ns< t <30 ns). Then the targets function can be designed as
rP(t) = [ε(t−tk−1)−ε(t−tk)]rk
θP(t) = [ε(t−tk−1)−ε(t−tk)]θk
, t∈[tk−1, tk) (12)
where, (r1, θ1) = (15 m,−π/3), (r2, θ2) = (20 m, π/3), t0 = 0, t1 = 15 ns and t2 = 30 ns. All the other
system parameters are identical to before. Consequently, the resulting power pattern is shown in Fig. 6. It is observed from Fig. 6 that the maximum power of the signal is obtained at different targets in different time slots.
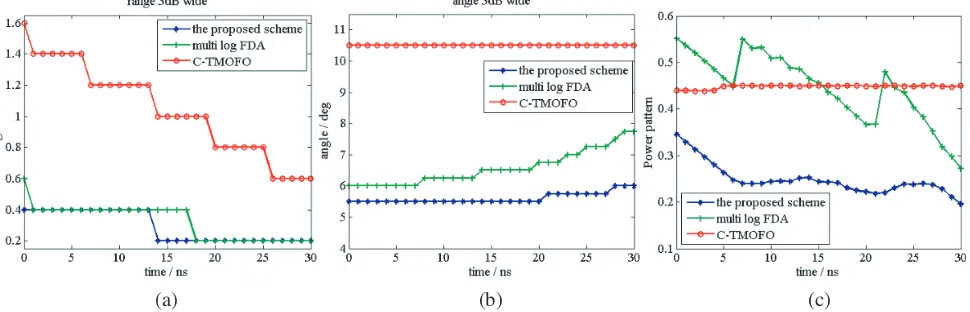
3.2. Performance Comparison
The proposed scheme is compared with the C-TMOFO and multi-log-FDA schemes in this section, in order to show the advantages of the proposed scheme in reducing the side-lobe peak and 3 dB width. In comparative experiment, the parameters used for all the three schemes are as follows: f0 = 3 GHz is the
center carrier frequency; number of elements is 21; number of sub-signals on each element isM = 4; inter-element spacing is d=λ0/2 = 0.05 m; the target location is (15 m,−π/6); pulse duration isT = 30 ns.
(a) (b)
Figure 5. Relationship between focusing performance and time, (a) azimuth angle 3 dB width changes over time, (b) range 3 dB width changes over time.
Figure 6. Normalized power pattern of two targets.
(a) (b) (c)
Figure 7. Comparison of focusing performance of three schemes, (a) the range 3 dB width versus time curve, (b) the angle 3 dB width versus time curve, (c) the maximum side lobe peak versus time curve.
C-TMOFO scheme achieves better azimuth focusing performance than the proposed scheme. However, the performance of the proposed scheme is better than multi-log FDA.
Another great advantage of the proposed scheme is its flexibility. Double the inter-element spacing (d=λ0 = 0.1 m) and keep other parameters constant. The new comparison results are shown in Fig. 8.
The arrangement of Fig. 8 is the same as that of Fig. 7.
(a) (b) (c)
Figure 8. Comparison of focusing performance of three schemes, (a) the range 3 dB width versus time curve, (b) the angle 3 dB width versus time curve, (c) the maximum side lobe peak versus time curve.
It can be seen from Fig. 8 that the performance of the proposed scheme is better than the other two schemes, when the inter-element spacing is doubled. Moreover, after comparing Fig. 8 with Fig. 7, we find that the performance of the C-TMOFO scheme is not changed significantly after the inter-element spacing is doubled. Although the main lobe width of the multi-log FDA scheme is similar to that of the proposed scheme, the side lobe suppression is far less. In C-TMOFO scheme, the focusing performance is mainly determined by the number of array elements and the optimization algorithm. In C-TMOFO scheme, the side lobe suppression and the decrease of main lobe width should be taken into account simultaneously in the optimization process. Therefore, the optimization results usually cannot meet these requirements at the same time. For example, in the above comparison experiment, the maximum side lobe peak expectation is 0.35, but the actual optimization result is about 0.45. Moreover, the focusing performance can be improved by increasing the number of array elements. However, once the number of elements has been changed, the system needs to be optimized again. Even worse, the amount of computation of the algorithm grows geometrically, when adding an element. Therefore, it is not convenient to change the number of array elements in C-TMOFO scheme, and the application scenario of the C-TMOFO focus scheme is limited.
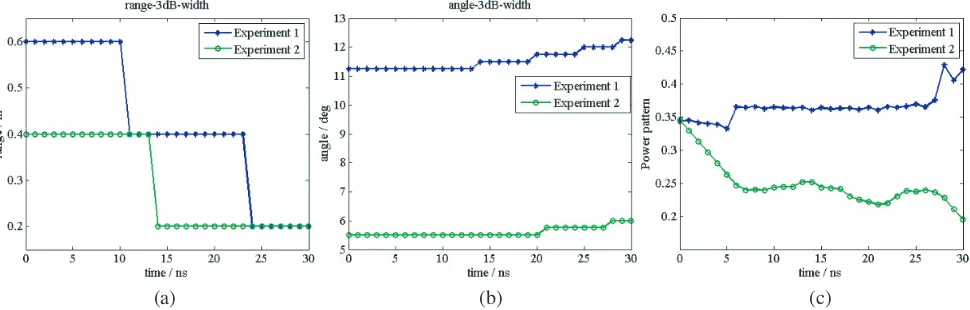
In the proposed scheme, two groups of different system parameters are selected to do contrast experiment. The system parameters combination of experiment 1 is as follows: The number of array elements is 11; the number of sub-signals is 2; the frequency offset coefficient is 16; the inter-element spacing is 0.05 m. On the other hand, the system parameters combination of experiment 2 is as follows: the number of array elements is 11; the number of sub-signals is 4; the frequency offset coefficient is 20; the inter-element spacing is 0.1 m. The contrast experiment results are shown in Fig. 9. The arrangement of Fig. 9 is the same as that of Fig. 7. It is clear that the performance indicators in experiment 2 are better than experiment 1. It can be seen that the ability to suppress side lobes and reduce the main lobe width is improved by adjusting the system parameters, with the number of elements unchanged.
(a) (b) (c)
Figure 9. Comparison of focusing performance of two experiments, (a) the range 3 dB width versus time curve, (b) the angle 3 dB width versus time curve, (c) the maximum side lobe peak versus time curve.
The number of elements, number of sub-signals, frequency offset coefficient and inter-element spacing of the system can be adjusted separately or simultaneously. The desired focusing performance can be obtained or approached by adjusting these parameters. In addition, system performance varies over time. Specifically, range focusing performance and side lobe suppression performance will be enhanced, and azimuth focusing performance will be deteriorated. Therefore, it is necessary to pay attention to the selection of pulse width in specific applications.
4. CONCLUSION
In this paper, we are engaged in beamforming of a frequency diverse array radar utilizing nonlinear frequency offset based on logistic map. A novel multi-carrier nonlinear frequency modulation system based on pseudo-random frequency offset has been proposed which is capable to reduce the main lobe 3 dB width and the side-lobe peaks simultaneously. The numerical simulation results show that the proposed scheme can focus the signal power on both single-target and multi-targets. Compared to C-TMOFO scheme and multi-log FDA scheme, the proposed scheme simplifies the system. By appropriately adjusting the number of sub-signals, the frequency offset coefficient and the inter-element spacing, it is possible to reduce the peak of the side lobe without widening the main lobe, when the number of elements remains unchanged. Multiple adjustable parameters provide more application scenarios for the system. The power focusing of different targets is achieved by time slot processing.
ACKNOWLEDGMENT
This work was supported in part by the National Natural Science Foundation of China under Grant 61271331 and in part by the National Natural Science Foundation of China under Grant 61571229.
REFERENCES
1. So, H. C., M. G. Amin, S. Blunt, et al., “Introduction to the special issue on time/frequency modulated array signal processing,”IEEE Journal of Selected Topics in Signal Processing, Vol. 11, No. 2, 225–227, 2017.
2. Ren, W., H. Chen, and W. Gao, “On the design of time-domain implementation structure for steerable spherical modal beamformers with arbitrary beampatterns,”Applied Acoustics, Vol. 122, 146–151, 2017.
4. Antonik, P., M. C. Wicks, H. D. Griffiths, and C. J. Baker, “Range dependent beamforming using element level waveform diversity,” Proc. Int. Waveform Diversity Des. Conf., 1–4, Las Vegas, NV, USA, Jan. 2006.
5. Khan, W., I. M. Qureshi, and S. Saeed, “Frequency diverse array radar with logarithmically increasing frequency offset,” IEEE Antennas Wireless Propag. Lett., Vol. 14, 499–502, 2015. 6. Khan, W., I. M. Qureshi, A. Basit, and W. Khan, “Range bins based MIMO Frequency diverse
array radar with logarithmic frequency offset,” IEEE Antennas Wireless Propag. Lett., Vol. 15, 885–888, 2016.
7. Basit, A., I. Qureshi, W. Khan, et al., “Beam pattern synthesis for an FDA radar with hamming window based non-uniform frequency offset,” IEEE Antennas & Wireless Propagation Letters, PP(99), 1–1, 2017.
8. Fang, D.-G., A.-M. Yao, and W. Wu, “Synthesis of 4-D beampatterns using 4-D arrays,” Proc. IEEE APS/URSI, Fajardo, Puerto Rico, 703–704, Jun. 26–Jul. 1, 2016 (Special session invited paper).
9. Yao, A.-M., W. Wu, and D.-G. Fang, “Frequency diverse array antenna using time-modulated optimized frequency offset to obtain time-invariant spatial fine focusing beampattern,”IEEE Trans. Antennas Propag., Vol. 64, No. 10, 4434–4446, Oct. 2016.
10. Rocca, P., L. Manica, L. Poli, and A. Massa, “Synthesis of compromise sum-difference arrays through time-modulation,” IET Radar Sonar Navig., Vol. 3, No. 6, 630–637, 2009.
11. Poli, L., Poli, P. Rocca, L. Manica, and A. Massa, “Handling sideband radiations in time-modulated arrays through particle swarm optimization,”IEEE Trans. Antennas Propag., Vol. 58, No. 4, 1408– 1411, Apr. 2010.
12. Poli, L., P. Rocca, and A. Massa, “Sideband radiation reduction exploiting pattern multiplication in directive time-modulated linear arrays,”IET Microw. Antennas Propag., Vol. 6, No. 2, 214–222, 2012.
13. Rocca, P., Q. Zhu, E. T. Bekele, S. Yang, and A. Massa, “4D arrays as enabling technology for cognitive radio systems,”IEEE Trans. Antennas Propag., Vol. 62, No. 3, 1102–1116, Mar. 2014. 14. Maneiro-Catoira, R., J. C. Br´egains, J. A. Garc´ıa-Naya, et al., “Enhanced time-modulated arrays
for harmonic beamforming,”IEEE Journal of Selected Topics in Signal Processing, Vol. 11, No. 2, 259–270, 2017.
15. Wang, Y., W. Li, G. Huang, et al., “Time-invariant range-angle dependent beampattern synthesis for FDA radar targets tracking,” IEEE Antennas & Wireless Propagation Letters, PP(99), 1–1, 2017.