Article
1
Evaluation of the PAHs Content in Soot from Solid
2
Fuels Combustion in Low Power Boilers
3
Ewa Szatyłowicz 1,* and Iwona Skoczko 1
4
1 Department of Technology and System Environmental Engineering, Faculty of Civil and Environmental
5
Engineering, Bialystok University of Technology, Wiejska 45A, 15-351 Bialystok, Poland; e-mail:
6
[email protected], [email protected]
7
* Correspondence: [email protected]; Tel.: +48-571-443-151
8
9
Abstract: The emission of carbon compounds (in the form of soot) to the atmosphere has a
10
significant impact on the environment and human health. Air pollution with combustion products,
11
having a unique combination of physical and chemical properties, is an important component of
12
very fine suspended dust, which is emitted from various sources related to combustion processes.
13
The carbon compounds in the aerosol and deposited in the substrate are found all over the Earth.
14
The paper presents results of comparative research on the content of 16 polycyclic aromatic
15
hydrocarbons (PAHs) in soot samples obtained as a result of combustion of solid fuels such as hard
16
coal with granulation above 60 mm, coal with a grain size of 25-80 mm, coal with a grain size of
8-17
25 mm, pellets and dry wood. On the basis of the conducted tests, it was found that the soot obtained
18
in the combustion of coal in different granulation contains more cytotoxic PAHs in comparison to
19
the combustion of wood pellets or dry firewood.
20
Keywords: solid fuels, combustion, soot, PAHs
21
22
1. Introduction
23
Emission of carbon compounds in the form of soot to the atmosphere has a significant impact
24
on the environment and human health. Soot is an air pollution that has a unique combination of
25
physical and chemical properties. It is also an important component of very fine suspended dust,
26
which is emitted from various sources related to combustion processes [1]. Often in literature, soot
27
compounds are referred to as EC (elemental carbon), alternatively the name is black carbon (BC) or
28
black smoke. The soot is a toxic waste produced mainly as a result of low emissions, i.e. in the
29
combustion processes of solid fuels and waste in individual heat sources. Other sources of soot in the
30
environment include emission of pollutants from vehicles and vessels with Diesel engines,
31
production of energy and heat in the power industry, production of heat in industry, forest fires and
32
biomass burning in agriculture [1-3]. This waste consists of highly toxic, carcinogenic or mutagenic
33
compounds, including: amorphous carbon, graphite-like connections, fullerenes, metal compounds,
34
including heavy metals and metalloids and ashes. In addition, hydrocarbons, in particular aliphatic
35
and aromatic hydrocarbons, including large amounts of PAHs, constitute a large proportion of the
36
soot. Chemical composition of soot depends on the fuel composition and the physicochemical
37
conditions of the combustion process [4-6].
38
The soot particles under the microscope resemble a layer structure formed from condensed six
39
and five-membered rings. The presence of these rings causes the expanding layers to develop into
40
spherical structures with a diameter of several dozen nanometers. A well-developed specific surface
41
of soot translates into a high adsorption capacity. Along with soot, other toxic substances are
42
transferred. Due to its very low density, it can persist in the atmosphere for a long time. Small size of
43
soot particles (soot is part of the PM10 and PM2.5 dust) makes it able to penetrate the body’s barrier,
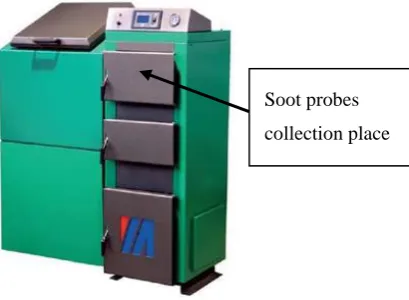
44
penetrating not only through the airways, but sometimes even through the skin [7-9]. Medical
45
research conducted in this direction has shown that it can cause mutagenic and carcinogenic changes
46
in the human body, as well as cardiovascular and respiratory diseases [10-11].
47
In addition, soot is considered a factor affecting the climate of the Earth. Initially, the share of
48
soot in this area was treated very slightly, and all attention was focused mainly on carbon dioxide, as
49
the main factor contributing to global warming. Recent scientific studies show that soot is the second
50
most important factor that influences the current climate change after carbon dioxide. An additional
51
feature of BC is that it absorbs sunlight. Absorbed energy is released in the form of heat and thus
52
contributes to the warming of air, which results in the acceleration of melting ice and snow. In
53
addition, soot affects the climate change through such processes as cloud formation, water
54
evaporation and disappearance or precipitation [12-14].
55
According to researchers’ forecasts and trends of changes obtained in international research
56
centers, the soot emission in Europe has significantly decreased, based on inventory and
57
measurements from soot emission sources, but the structure of emission sources has changed. An
58
increase in emissions in the municipal and household sector in the overall carbon pollution balance
59
was observed. This phenomenon is caused by a greater share of organic carbon in the dust emitted
60
from the combustion of solid fuels in energy and emission inefficiencies in installations. This is
61
connected with the dominating share of solid fuels, i.e. coal and biomass in the fuel structure of the
62
municipal sector in Eastern Europe and a large share of diesel-powered vehicles in Western Europe
63
[14]. However, in Poland, according to the report prepared by The National Centre For Emissions
64
Management of The Institute of Environmental Protection – National Research Institute, (IEPNRI)
65
published in 2018, the volume of emissions of the BC dust soot fraction increased in 2015-2016. The
66
emission of BC dust fractions in 2016 increased by approximately 7% compared to 2015, mainly due
67
to higher consumption of fuels in the sector of combustion processes outside the industry and in road
68
transport [15].
69
In connection with the above, the research was undertaken to assess the content of individual 16
70
representatives of the PAH group (polycyclic aromatic hydrocarbons) in soot from the combustion
71
of various solid fuels in the low power boilers. Therefore, samples of soot selected for testing were
72
from the combustion of: imported hard coal with dimensions over 60 mm, hard coal with a grain size
73
of 25-80 mm, bituminous coal with a grain size of 8-25 mm, pellet with a grain size of 6 mm and
74
mixed firewood. The content of the ΣLMW fraction containing the hydrocarbons containing in their
75
structure from 2 to 4 aromatic rings, ΣHMW, in which the concentrations of 5 and 6-ring
76
hydrocarbons and ΣWWA was taken into account, takes into account the total concentration of 16
77
compounds from the PAH group, the content of which is recommended for monitoring in the
78
environment by EPA. In addition, the carcinogenicity equivalent and selected mutagenic and toxic
79
equivalents of the TCDD-TEQ interaction of the PAH mixture and the ΣWWAcarc/ΣWWA ratio for
80
all types obtained from the combustion of solid carbonaceous fuels were calculated.
81
2. Materials and Methods
82
The tests were carried out by burning the following fuels: hard coal with a size of over 60 mm,
83
hard coal with a grain size of 25-80 mm, hard coal with a granulation of 8-25 mm, pellet with a grain
84
size of 6 mm and mixed firewood. The combustion process was carried out on a laboratory bench
85
[16] (Figure 1) consisting of Moderator Unica Vento Eko boiler 25 kW with an automatic feeder
86
equipped with a manual and retort grate. Three events of combustion were carried out each of 5 solid
87
fuels selected for testing, collecting each day from the heat exchanger (Figure 1). Each time, 15 kg of
88
each fuel was burned, maintaining the same combustion conditions, i.e. temperature of the fumes
89
and the temperature of the feed water (at the boiler’s outlet), which was about 70-80 °C, while at the
90
return not less than 50 °C.
92
Figure 1. Laboratory stand for fuel combustion with a soot collection point.
93
Then, after the combustion of individual types of fuels, soot samples were collected. The soot is
94
a side effect of the combustion process. About 3 g of soot was taken from the heat exchanger. The
95
soot was extracted twice with a mixture of hexane-acetone solvents (20 ml / 5 ml) for 2 hours to elute
96
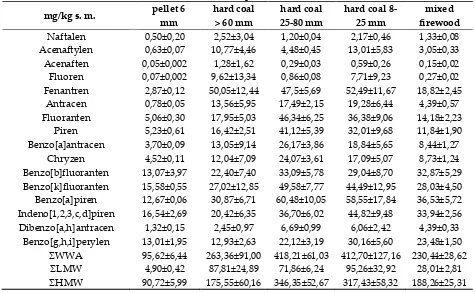
the PAHs tested therein, i.e.: acenaphthalene, anthracene, benzo(a)anthracene,
97
benzo(b)fluoroanthrone, benzo(k)fluoroanthrone, benzo(g,h,i)perylene, benzo(a)pyrene, chrysene,
98
dibano(a,h)anthracene, fluoroanthene, fluoren, indeno(1,2,3-c,d)pyrene, naphthalene, phenanthrene
99
and pyrene. Acetone and polar compounds extracted from it were removed by washing twice with
100
10 ml of deionized water. The remaining organic phase was dried over anhydrous sodium sulfate
101
(anhydrous, ACS reagent, ≥99% Sigma-Aldrich). The extracts were then concentrated on a Turbo-Vap
102
apparatus under an inert gas - nitrogen atmosphere, to a volume of 1 ml. The solutions prepared in
103
this way were subjected to chromatographic analysis for the presence of aromatic hydrocarbons
104
mentioned above. A gas chromatograph coupled with a mass spectrometer (Agilent GC/MS Triple
105
Quad 7000C) was used, equipped with a split/splitless dispenser and an HP-5MS capillary column
106
measuring 30 m x 0.25 mm and a film thickness of 0.25 μm. Working conditions of the apparatus
107
during the analysis were as follows:
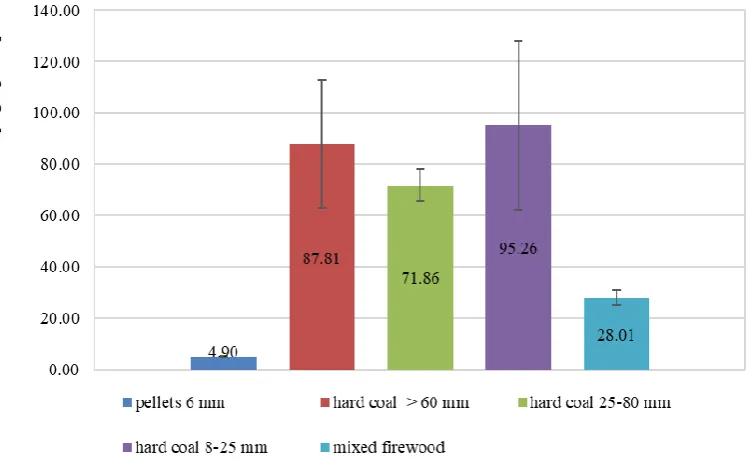
108
- carrier gas - helium with purity 6.0;
109
- carrier gas flow rate through the column - 1ml/min (splitless);
110
- volume of the injected sample – 1 μl;
111
- dispenser temperature – 260 °C;
112
- ion source temperature – 230 °C;
113
- transfer line temperature – 300 °C;
114
- quadrupole temperature – 150 °C;
115
- scanning mode – single ion monitoring (SIM - selected ion monitoring).
116
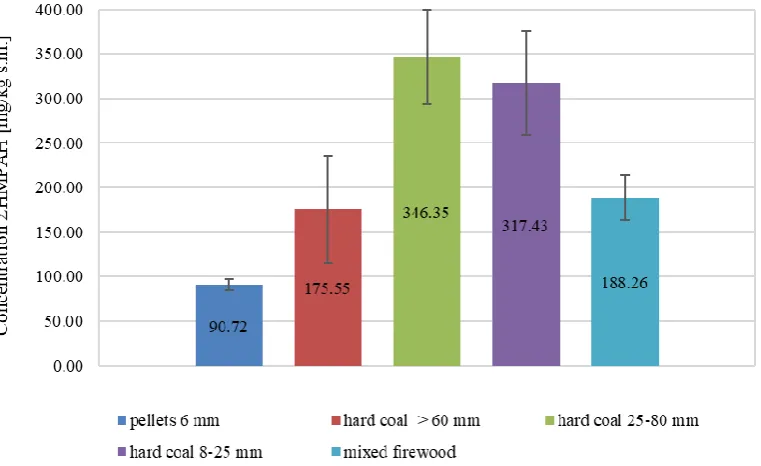
- gaz nośny - Hel o czystości 6.0;
117
The temperature program was set as follows:
118
- initial temperature of the 60 °C column furnace, 2 min isothermal;
119
- temperature increase 30 °C/min to 120 °C;
120
- from 120OC temperature increase 5 °C/min to 300 °C;
121
- end temperature of the column furnace 300 °C, isothermal 15 min.
122
During the extraction, no internal standard addition was used, whereas the method control was
123
carried out by simultaneous execution of the entire analytical procedure for a sample of certified
124
reference material - Clean soil Reference Material EDF-5183 (CERILLIANT Analitical Reference
125
Standards). The tests used external calibration with calibration curves for individual compounds.
126
Calibration solutions were prepared from a standard of 16 PAHs mixture (AccuStandard, Z-014G).
127
In order to determine the harmfulness of the 16 PAHs examined, indicators were used which
128
define the toxicity of individual PAHs and the whole group as well. A universal method for
129
calculating the risk related to exposure to PAH mixture was adopted. BaP is assumed to be a reference
130
compound. The carcinogenic potential, called the Toxicity Equivalence Factor (TEF) of other
131
Soot probes
compounds is calculated relative to BaP. The RTBaP toxicity equivalent value (TEQ - Toxic
132
Equivalent) is the sum of the products of the concentrations of individual PAHs and their relative
133
toxicity coefficients [17]:
134
RTBaP = 0,001 × [Nap] + 0,001 × [Acy] + 0,001 × [Ace] + 0,001 × [Fl]
135
+ 0,001 × [Phe] + 0,01 × [Ant] + 0,001 × [Flu] + 0,001 × [Pyr] + 0,1 × [B(a)A]
136
+ 0,01 × [Chr] + 0,1 × [B(b)F] + 0,1 × [B(k)F] + 1 × [B(a)P] +5 × [D(ah)A] + 0,1 ×
137
[B(ghi)P] + 0.1 × [I(cd)P] (1)
138
Durant and others (1996) reported mutagenic coefficients for individual PAHs. Wilellet and
139
others. (1997) proposed that the carcinogenic potential of PAHs may be calculated with respect to
140
dioxin (2,3,7,8-tetrachlorodibenzo-p-dioxin - TCDD), for which the carcinogenicity coefficient value
141
is equal to 1. To assess the harmfulness of PAHs, in addition to the CEQ toxicity equivalent (RTBaP)
142
given by Nisbet and LaGoy (1992), the mutagenicity equivalent (MEQ) and carcinogenicity
(TCDD-143
TEQ) is also used [18]. Using the mutagenicity factors [19] and carcinogenicity factors [20], those were
144
selected, which refer to 16 priority PAHs according to the EPA list. The mutagenicity equivalent was
145
given as the sum of the product of the concentration of individual PAHs and their relative
146
mutagenicity coefficients [18]:
147
MEQ = 0,00056 × [Acy] + 0,082 × [B(a)A] + 0.017 × [Chr] + 0.25 × [B(b)F]
148
+ 0,11 × [B(k)F] + 1 × [B(a)P] + 0,31 × [I(cd)P] + 0,29 × [D(ah)A] + 0,19 × [B(ghi)P] (2)
149
On the other hand, the equivalent of carcinogenicity as the sum of the products of the concentrations
150
of individual PAHs and their relative carcinogenicity coefficients:
151
TCDD-TEQ = 0,000025 × [B(a)A] + 0,00020 × [Chr] + 0,000354 × [B(a)P] +
152
0,00110 × [I(cd)P] + 0,00203 × [D(ah)A] + 0,00253 × [B(b)F] + 0,00487 × [B(k)F] (3)
153
The harmfulness of PAHs is also expressed as the ratio of PAHs considered carcinogenic to
154
the sum of all PAHs determined [21]:
155
ΣWWAcarc/ΣWWA=([B(a)A]+[B(a)P]+[B(b)F]+[B(k)F]+[Chr]+[D(ah)A]+
156
[I(cd)P])/([SWWA]) (4)
157
Based on the calculated carcinogenicity and mutagenicity indicators, the toxicity of the tested
158
types of solid fuels was determined. It was assumed that the value of the ratio ΣWWAcarc/ΣWWA is
159
closer to 1, the PAHs pose a greater threat to the population.
160
3. Results and discussion
161
Table 1 shows the basic properties of the analyzed 16 polycyclic aromatic hydrocarbons:
162
acenaphthalene, anthracene, benzo(a)anthracene, benzo(b)fluoroanthrone, benzo(k)fluoroanthrene,
163
benzo(g,h,i)perylene, benzo(a)pyrene, chrysene, dibenzo(a,h)anthracene, fluoroanthene, fluoren,
164
indeno(1,2,3-c,d)pyrene, naphthalene, phenanthrene and pyrene. The studied hydrocarbons were
165
divided into three groups: ΣLMW (Low Molecular Weight) (hydrocarbons containing from 2 to 4
166
aromatic rings in their structure: naphthalene, acenaphthene, acenaphthalene, fluorene,
167
phenanthrene, anthracene); ΣHMW (High Molecular Weight), (5, 6-ring compounds: fluoranthene,
168
pyrene, benzo(a)anthracene, chrysene, benzo(b)fluoranthene, benzo(k)fluoranthene,
169
benzo(a)pyrene, indeno(1,2,3-c,d)pyrene, dibenzo(a,h)anthracene and benzo(g,h,i)perylene and a
170
total of 16 aromatic hydrocarbons - ΣWWA.
171
Table 1. ΣPAHs included hydrocarbons containing from 2 to 6 rings in their structure
Ordinal number
Polycyclic aromatic hydrocarbons
Short name
Structure (number of rings)
Molecular weight (g/mole)
Solubility (mg/L)
Vapor pressure (mm Hg)
1 Naphthalene Nap 2 128.17 31 8.89E−02
2 Acenaphthene Ace 3 154.21 3.8 3.75E−03
3 Acenaphthylene Acy 3 152.20 16.1 2.90E−02
4 Anthracene Ant 3 178.23 0.045 2.55E−05
5 Phenanthrene Phe 3 178.23 1.1 6.80E−04
6 Fluorene Flu 3 166.22 1.9 3.24E−03
7 Fluoranthene Flr 4 202.26 0.26 8.13E−06
8 Benzo(a)anthracene B(a)A 4 228.29 0.011 1.54E−07
9 Chrysene Chr 4 228.29 0.0015 7.80E−09
10 Pyrene Pyr 4 202.26 0.132 4.25E−06
11 Benzo(a)pyrene B(a)P 5 252.32 0.0038 4.89E−09
12 Benzo(b)fluoranthene B(b)F 5 252.32 0.0015 8.06E−08
13 Benzo(k)fluoranthene B(k)F 5 252.32 0.0008 9.59E−11
14 Dibenz(a,h)anthracene D(ah)A 6 278.35 0.0005 2.10E−11
15 Benzo(g,h,i)perylene B(ghi)P 6 276.34 0.00026 1.00E−10
16 Indeno[1,2,3-cd]pyrene I(cd)P 6 276.34 0.062 1.40E−10
Source: Own elaboration on [22-23].
173
Table 2 presents results of PAH content analysis in the studied soot samples from the
174
combustion of selected fuels. PAHs are the most frequently tested pollutants in environmental
175
samples. It is dictated primarily by their negative impact on health, including toxicity, carcinogenicity
176
and mutagenicity [19, 24-25].
177
Table 2. Results of PAH determinations in soot samples from the combustion of solid fuels
178
mg/kg s. m. pellet 6
mm
hard coal > 60 mm
hard coal 25-80 mm
hard coal 8-25 mm
mixed firewood
Naftalen 0,50±0,20 2,52±3,04 1,20±0,04 2,17±0,46 1,33±0,08
Acenaftylen 0,63±0,07 10,77±4,46 4,48±0,45 13,01±5,83 3,05±0,33
Acenaften 0,05±0,002 1,28±1,62 0,29±0,03 0,59±0,26 0,15±0,02
Fluoren 0,07±0,002 9,62±13,34 0,86±0,08 7,71±9,23 0,27±0,02
Fenantren 2,87±0,12 50,05±12,44 47,5±5,69 52,49±11,67 18,82±2,45
Antracen 0,78±0,05 13,56±5,95 17,49±2,15 19,28±6,44 4,39±0,57
Fluoranten 5,06±0,30 17,95±5,03 46,34±6,25 36,38±9,06 14,18±2,23
Piren 5,23±0,61 16,42±2,51 41,12±5,39 32,01±9,68 11,84±1,90
Benzo[a]antracen 3,70±0,09 13,05±9,14 26,17±3,86 18,84±5,65 8,44±1,27
Chryzen 4,52±0,11 12,04±7,09 24,07±3,61 17,09±5,07 8,73±1,24
Benzo[b]fluoranten 13,07±3,97 22,40±7,40 33,09±5,78 29,04±8,70 32,87±5,29
Benzo[k]fluoranten 15,58±0,55 27,02±12,85 49,58±7,77 44,49±12,95 28,03±4,50
Benzo[a]piren 12,67±0,06 30,87±6,71 60,48±10,05 58,55±17,84 36,53±5,72
Indeno[1,2,3,c,d]piren 16,54±2,69 20,42±6,35 36,70±6,02 44,82±9,48 33,94±2,56
Dibenzo[a,h]antracen 1,32±0,15 2,45±0,97 6,69±0,99 6,06±2,42 4,39±0,33
Benzo[g,h,i]perylen 13,01±1,95 12,93±2,63 22,12±3,19 30,16±5,60 23,48±1,50
WWA 95,62±6,44 263,36±91,00 418,21±61,03 412,70±127,16 230,44±28,62
LMW 4,90±0,42 87,81±24,89 71,86±6,24 95,26±32,92 28,01±2,81
HMW 90,72±5,99 175,55±60,16 346,35±52,67 317,43±58,32 188,26±25,31
179
As a result of chromatographic analysis of soot samples, it was found that the sum of 16
180
determined hydrocarbons included in the PAH group depends significantly on the type of fuel
181
burned while maintaining the same combustion conditions. The total PAH content in fuel samples
182
ranged from 95.62 ± 6.44 mg/kg DM in the case of combustion of pellets with a grain size of 6 mm to
418.21 ± 61.03 mg/kg DM in the case of coal combustion with a grain size of 25-80 mm. Relative
184
uncertainty of each of the PAH sum assays within the framework of separate combustion for
185
individual fuels was estimated from 6% to 34%, which means that the combustion process is
186
characterized by high variability and nonlinearity, even while maintaining the same fuel and
187
combustion parameters [26].
188
Analyzing the content of the sum of 16 PAHs (Figure 2), the smallest content in the soot in
189
the samples from pellet combustion was found, which was 95.62 ± 6.44 mg/kg DM. Another fuel,
190
which was characterized by the second lowest PAH content, was wood mixed fuel, for which 230.44
191
± 28.62 mg/kg DM was obtained. The remaining three analyzed fuels were hard coal with different
192
granulation. Soot samples from the combustion of selected hard coals were characterized by much
193
higher PAH content as compared to soot samples from the combustion of pellets and mixed fuel
194
wood. In the group of coals, the highest total PAH content was found in soot samples from the
195
combustion of coal with a grain size of 25-80 mm, which was 418.21 ± 61.03 mg/kg DM, while the
196
smallest content was characterized by soot samples from coal combustion granulation >60 mm, which
197
was 263.36 ± 91.00 mg/kg DM. Soot from the combustion of coal with large irregular cubes over 60
198
mm was characterized by a smaller content not only from the combustion of coal with a grain size of
199
25-80 mm, but also from hard coal granulation 8-25 mm, as a result of which PAH content was
200
obtained amounting to 412.70 ± 127.16 mg/kg DM.
201
202
Figure 2. Average content of PAH in soot samples from the combustion of selected fuels.
203
Research conducted by Kakareka and others (2005) on the emission of polycyclic aromatic
204
hydrocarbons (PAHs) from several types of solid fuel combustion in various low power boilers in
205
Belarus proved that the highest PAH emissions were detected in waste gases from the incineration
206
of household waste and wood waste. The lowest PAH emissions originated from the combustion of
207
peat briquettes. PAH concentrations in flue gases from solid fuel combustion differed significantly
208
more than PAH concentrations depending on the type of boiler, in which the fuel was burned. The
209
PAH content from birch wood combustion was higher than in the case of pine wood emissions [27].
210
When analyzing the compactness of light PAH fraction determined with the abbreviation LMW
211
(Low Molecular Weight) (Figure 3) containing hydrocarbons consisting of 2 and 3 aromatic rings, it was
212
found that soot from the combustion of pellets and mixed fuel wood contains, as in the case of a total
213
of 16 PAHs, the least LMW; these values were 4.90 ± 0.42 mg/kg DM and 18.01 ± 2.81 mg/kg DM,
214
respectively. It was only 5% of the total PAH content for pellets and 12% for firewood. The content
of LMW in soot samples from hard coal combustion was much higher than in the case of pellets and
216
firewood. The highest content of LMW was obtained in soot samples from the combustion of coal
217
with 8-25 mm granulation and it amounted to 95.26 ± 32.92 mg/kg DM, which constituted 23% of the
218
total PAH content. Compared with samples after combustion of coal with a grain size of 25-80 mm
219
and coal with a grain size of over 60 mm, the LMW content was: 71.86 ± 6.24 mg/kg DM and 87.81
220
± 24.89 mg/kg DM. These contents constituted respectively: 17% and 33% of the total PAH content.
221
This information indicates that among the coals, the combustion of bituminous coal with a grain size
222
of 25-80 mm is the most advantageous as it contains the largest percentage of light aromatic
223
hydrocarbons. Compounds from the PAH group are the more biodegradable the easier their
224
construction is [28].
225
226
Figure 3. Average content of LMW in soot samples from the combustion of selected fuels.
227
Results of heavier PAH fraction of the so-called HMW (Figure 4) (High Molecular Weight), which
228
includes hydrocarbons with four or more rings [29] showed that the percentage of HMW was in the
229
case of samples of solid fuels from wood biomass, i.e. 95% of pellets and 88% of mixed firewood.
230
Considering the percentage share of heavier PAH fraction, it is more beneficial to burn mixed
231
firewood than pellets. In the case of coal samples, the per cent content of heavier PAHs was 67% for
232
hard coal with a grain size exceeding 60 mm, for hard coal with a grain size of 25-80 mm - 83%, and
233
77% for hard coal 8-25 mm. A higher percentage of PAHs with higher molecular weights, i.e. having
234
at least four aromatic rings in their molecule, accounted for more than 50% in each of the analyzed
235
solid fuels. These hydrocarbons are characterized by higher durability in the environment compared
236
to hydrocarbons with lower masses. This property is related to their lower solubility in water as well
237
as the volatility described by Henry’s constant. Both values decrease with the increase of molecular
238
mass, while their value depends on the intensity of PAHs elimination through biochemical changes
239
and evaporation [30].
241
Figure 4. Average content of HMW in soot samples from the combustion of selected fuels.
242
In addition, taking into account that individual PAHs show very diversified degree of
243
carcinogenicity, the equivalent value of TEQ toxicity was determined (Table 3), which characterizes
244
the total toxicity of the test compounds relative to the indicator benzo[a]pyrene. Value of the TEQ
245
toxicity equivalent depends primarily on the PAH content with high TEF toxicity ratios [31]. The
246
highest equivalent of toxicity characterized soot from the combustion of hard coal with a grain size
247
of 25-80 mm and hard coal of 9-25 mm. It amounted to 158.76 ± 23.34 mg/kg DM and 158.53 ± 31.77
248
mg/kg DM, respectively. This means that although both soot types have similar contents of 16 PAH,
249
the soot from combustion of coal with a granulation of 25-80 mm contains more carcinogenic
250
homologs. Whereas, the soot coming from the combustion of wood pellets with a grain size of 6 mm
251
had the smallest value of toxicity equivalent, which was 28.39 ± 1.19 mg/kg DM. The highest
252
mutagenic equivalent (Table 3) was also obtained for soot derived from the combustion of
253
bituminous coal 80 mm (94.28 ± 15.47 mg/kg DM) and hard coal 9-25 mm (93.93 ± 16.65 mg/kg DM),
254
and the lowest for soot obtained from the combustion of pellets (26.02 ± 1.68 mg/kg DM).
255
Table 3. Mean values of the four risk indicators (CEQ, MEQ, TCDD-TEQ and PAHcanc/ΣPAH) at soot
256
samples.
257
Indicator pellet 6 mm
hard coal > 60 mm
hard coal 25-80 mm
hard coal 8-25 mm
mixed firewood
TEQ = CEQ 28,39±1,19 103,06±37,95 158,76±23,34 158,53±31,77 90,16±11,12
MEQ 26,02±1,68 50,22±13,47 94,28±15,47 93,93±16,65 64,93±8,56
TCDD-TEQ 0,19±0,01 0,33±0,06 0,61±0,09 0,55±0,11 0,39±0,06
ΣWWAcarc/ΣWWA 0,70±0,02 0,60±0,15 0,56±0,01 0,53±0,01 0,66±0,02
On the other hand, when comparing the toxicity equivalent of soot samples with combustion
258
of fuels, the highest one was obtained for soot samples from hard coal combustion with granulation
259
of 25-80 mm (0.61 ± 0.09 mg/kg DM). The next largest was the equivalent calculated for soot samples
260
from the combustion of black coal 8-25 mm (0.55 ± 0.11 mg/kg DM), then for samples from burning
261
mixed fuel wood (0.39 ± 0.06 mg/kg DM), further for combustion samples the hard coal >60 mm (0.33
262
± 0.06 mg/kg DM). The smallest TCDD-TEQ was obtained in the case of samples from 6 mm pellet
263
combustion, which was 0.19 ± 0.01 mg/kg DM. Analyzing the ratio of PAHs considered carcinogenic
to the sum of all PAHs (Table 3) in the soot samples, it was found that the highest ratio had the soot
265
from the combustion of pellets 6 mm (0.70 ± 0.02), then the soot from the combustion of mixed fuel
266
wood was classified (0 66 ± 0.02). The smallest ratio ΣWWAcarc/ΣWWA was obtained in the case of
267
soot samples from the combustion of black coal 8-25 mm (0.53 ± 0.01). Despite the lowest TEQ, MEQ
268
and TCDD-TEQ coefficients for soot from the combustion of pellets with a grain size of 6 mm, the
269
highest ratio of carcinogenic PAHs to the total PAH was obtained for this soot, which proves that the
270
more carcinogenic PAH homologues are predominant.
271
Of approximately 100 PAHs present in the environment, the US Environmental Protection
272
Agency (US EPA 2015) paid particular attention to 16 hydrocarbons with the most potent
273
carcinogenic and mutagenic properties [30]. Therefore, it was decided to evaluate the content of
274
PAHs in soot samples from the combustion of solid fuels in a low power class 5 boiler that met the
275
eco-design standards. Soot is a carbonaceous matter that is contained in atmospheric aerosols, i.e.
276
suspended solid particles with a characteristic size of 0.01-10 μm and a retention time in the
277
atmosphere of at least a few hours [32]. Soot, as a product of incomplete combustion of fuels mainly
278
from stationary sources, i.e. household furnaces used in the housing sector, causes climate change
279
[33]. The potential for reducing emissions of soot and its components depends on technical and
non-280
technical solutions that should be applied in the sector of human activity bringing the largest load of
281
soot to the air [14]. Research results presented in this article show that a very significant impact on
282
the content of mutagenic and toxic compounds such as PAHs in soot is affected by the type of solid
283
fuel burned in household furnaces. Reduction of PAH emissions in soot particles is extremely
284
important due to the occurrence of adverse health effects [23]. The National Agency for Research on
285
Cancer (IARC) has identified benzo(a)pyrene as a group of compounds with proven carcinogenicity
286
(IARC 2012). Carcinogenic compounds are non-threshold substances, which entails the risk of cancer
287
changes when exposed to any substance concentration [34].
288
It is necessary to conduct activities aimed at limiting the exposure of the population to these
289
compounds. The most effective action would be the elimination of low-emission sources by changing
290
the way apartments are heated, because coal burning in the municipal sector is still the most
291
important source of PAH emissions. On the basis of the conducted research, it was stated that hard
292
coal, regardless of the form in which it is adapted for combustion, whether it is large cubes with
293
granulation over 60 mm or fine coal walnut-type with granulation of 25-80 mm or also eco-pea coal,
294
which is adapted to combustion in boilers equipped with an automatic feeder, which evenly
295
dispenses the material, generates higher amounts of PAH in soot than the combustion of biomass in
296
the form of mixed firewood or pellets 6 mm. According to the Wielgosiński et al. (2017), who studied
297
the combustion of seven types of biomass (basket willow, primitive willow, rape straw briquettes,
298
granules of cakes and sawdust, fuel wood chips, oak bark), the emission of organic compounds in
299
many cases was unexpectedly higher than in the case of hard coal. It is difficult to recognize biomass
300
as a truly ecological fuel, although it is undoubtedly a renewable fuel. Due to significant differences
301
in the chemical composition (elemental), calorific value, volatile content and properties of biomass
302
and coal emissions, biomass combustion should be carried out under different technological
303
conditions (temperature, excess air, etc.) than combustion of fossil fuels (e.g. coal [35]. According to
304
the research by Horak and others (2017), the issue of PAHs is influenced not only by the type of fuel,
305
but also by the type of boiler, in which this fuel is combusted. To burn biomass, in order to achieve
306
low PAH emissions, more oxygen should be supplied than coal, i.e. the combustion parameters
should be selected accordingly and then lower PAH emissions will be obtained than in the case of
308
hard coal combustion [36].
309
4. Conclusions
310
1. Among the examined soot samples from the combustion of solid fuels, the highest PAH
311
concentration was obtained in soot samples from combustion of 6 mm pellets (95.62 ± 6.44
312
mg/kg DM), and the largest of 25-80 mm coal (418.21 ± 61.03 mg/kg DM), which was over 4
313
times higher than in the case of 6 mm pellets.
314
2. Analysis of the compactness of the light LMW fraction showed that the smallest share of this
315
fraction in the total concentration was recorded in samples of pellets 6 mm; it was only 5% of
316
the total PAH total, and 12% for firewood. In the case of coals, much higher percentages of
317
the LMW fraction were obtained, which indicates a greater share of more biodegradable
318
compounds from the PAH group.
319
3. Higher percentage of PAHs with higher molecular weights, i.e. HMW fraction, accounted for
320
more than 50% in each of the analyzed solid fuels. These hydrocarbons are characterized by
321
higher durability in the environment compared to hydrocarbons with lower masses.
322
4. Considering the calculated TEQ = CEQ, MEQ and TCDD-TEQ indicators, it was found that
323
the most toxic and carcinogenic is carbon black with the granulation of 25-80 mm, while soot
324
samples from combustion 6 mm pellets were the least affecting living organisms and the
325
environment.
326
5. The largest ratio of ΣWWAcarc/ΣWWA was obtained in the case of soot samples from the
327
combustion of pellets 6 mm, while the smallest from the combustion of coal with a
328
granulation of 8-25 mm
329
Funding: The research was carried out as part of research work No. MB/WBIIS/12/2018 and No.
330
WZ/WBiIS/8/2019 at the Białystok University of Technology and financed from a subsidy provided by the
331
Ministry of Science and Higher Education.
332
Author Contributions:, E.Sz. and I.S.; methodology, E.Sz.; validation, E.Sz. formal analysis, E.Sz. data curation,
333
E.Sz.; writing—original draft preparation, I.S. writing—review and editing, E.Sz. visualization, I.S.; supervision,
334
I.S. project administration, E.Sz. funding acquisition.
335
Conflicts of Interest: The authors declare no conflict of interest.
336
References
337
1. Skotak, K.; Degórska, A.; Ulańczyk, R.; Pecka, T. Soot as an indicator of human activity for life and
338
environment. Chemical Industry 2016, 95(3), 548-553. https://doi.org/10.15199/62.2016.3.39
339
2. European Environment. The state and the forecast. Synthesis.. Environmental Protection Agency 2015, EPA,
340
Copenhagen.
341
3. Zhan, C.; Zhang, J.; Zheng, J. Characterization of carbonaceous fractions in PM2.5 and PM10 over a typical
342
industrial city in central China. Environ Sci Pollut Res 2019, 26, 16855. https://doi.org/
343
2073/10.1007/s11356017-9970-9
344
4. Fernandes M.B.; Brooks P. Characterization of carbonaceous combustion residues: II. Nonpolar organic
345
compounds. Chemosphere 2003, 53, 447-448. https://doi.org/10.1016/S0045-6535(03)00098-5
346
5. Lokeshappa B.; Dikshit A.K. Fate of metals in coal fly ash ponds. International Conference on Environmental
347
Science and Development 2012, 3(1), 43-48.
348
6. Status of black carbon monitoring in ambient air in Europe, EEA. Technical report No 18/2013, European
349
Environment Agency, Copenhagen 2013.
350
7. Wainwright M.; Alharbi S.; Wickramasinghe N.C. How do microorganisms reach the stratosphere? Int. J.
351
of Astrobiology 2006, 5(1), 1-3. https://doi.org/10.1017/S1473550406002825
352
8. Lewtas J. Air pollution combustion emissions: Characterization of causativeagents and mechanisms
353
associated with cancer, reproductive, and cardiovascular effects. Mutation Res. 2007, 636, 95–133.
354
https://doi.org/10.1016/j.mrrev.2007.08.003
9. Tiwari, S.; Pipal, A.S.; Srivastava, A.K.; Bisht D.S.; Pandithurai G. Determination of wood burning and fossil
356
fuel contribution of black carbon at Delhi, India using aerosol light absorption technique. Environ. Sci.
357
Pollut. Res. 2015, 22(4), 2846. https://doi.org//2073/10.1007/s11356-014-3531-2
358
10. Pope C.A.; Ezzati M.; Dockery D. Fine-Particulate Air Pollution and Life Expectancy in the United States.
359
N Engl J Med. 2009, 360, 376-386. https://doi.org/10.1056/NEJMsa0805646
360
11. Pratt M.M.; John K.; MacLean A.B.; Afework S.; Phillips D.H.; Poirier M. C. Polycyclic aromatic
361
hydrocarbon (PAH) Exposure and DNA adduct semi-quantitation in archived human tissues. Int. J.
362
Environ. Res. Public Health 2011, 8, 2675-2691. https://doi.org/10.3390/ijerph8072675
363
12. Anenberg, S. Technology: clean stoves benefit climate and health. Nature 2012, 490, 343.
364
https://doi.org/10.1038/490343e
365
13. Schmidt, C. W. Black carbon: the dark horse of climate change drivers. Environ Health Perspect 2011, 119,
366
A172– A175. https://doi.org/10.1289/ehp.119-a172
367
14. Kubica R.; Kubica K.; Kacprzyk W. Limitation of black carbon emissions from solid fuel combustion in
368
small plants, Chemical Industry 2016, 95(3), 472-479. https://doi.org/ 10.15199/62.2016.3.27
369
15. Poland’s National Inventory Report 2019 Greenhouse Gas Inventory for 1988-2017, Institute Of
370
Environmental Protection – National Research Institute, The National Centre For Emissions Management,
371
Submission under the UN Framework Convention on Climate Change and its Kyoto Protocol, Warsaw
372
2018.
373
16. Dołżyńska M.; Obidziński S.; Kowczyk-Sadowy M.; Krasowska M. Densification and Combustion of
374
Cherry Stones. Energies 2019, 12(16), 3042; https://doi.org/10.3390/en12163042
375
17. Nisbet I.C.T., LaGoy P.K. Toxic equivalency factors (TEFs) for polycyclic aromatic hydrocarbons (PAHs).
376
Regulatory Toxicology and Pharmacology 1992, 16(3), 290–300.
377
18. Rogula-Kozłowska W.; Kozielska B.; Klejnowski K. Concentration, origin and health hazard from fine
378
particle-bound PAH at three characteristic sites in Southern Poland. Bulletin of Environmental Contamination
379
and Toxicology 2013, 91(3), 349–355. https://doi.org/1010.1007/s00128-013-1060-1
380
19. Durant J.L.; Busby Jr W.F.; Lafleur A.L.; Penman B.W.; Crespi C.L. Human cell mutagenicity of oxygenated,
381
nitrated and unsubstituted polycyclic aromatic hydrocarbons associated with urban aerosols. Mutation
382
Research Genetic Toxicology 1996, 371(3–4), 123–157. https://doi.org/10.1016/S0165-1218(96)90103-2
383
20. Willett K.L.; Gardinali P.R.; Sericano J.L.; Wade T.L.; Safe S.H. Characterization of the H4IIE rat hepatoma
384
cell bioassay for evaluation of environmental samples containing polynuclear aromatic hydrocarbons
385
(PAHs). Archives of Environmental Contamination and Toxicology 1996, 32(4), 442–448.
386
https://doi.org/10.1007/s002449900211
387
21. Bourotte C., Forti M. C., Taniguchi S., Bícego M.C., Lotufo P.A. (2005) A wintertime study of PAHs in fine
388
and coarse aerosols in São Paulo city, Brazil. Atmospheric Environment 39(21):3799–3811.
389
https://doi.org/10.1016/j.atmosenv.2005.02.054
390
22. Biache C.; Mansuy- Huault L.; Faure P. Impact of oxidation and biodegradation on the most commonly
391
used polycyclic aromatic hydrocarbons (PAH) diagnostic ratios: Implications for the source identification,
392
J Hazard Mater 2014, 267, 31-39. https://doi.org/10.1016/j.jhazmat.2013.12.036
393
23. Kubiak S.M. Polycyclic Aromatic Hydrocarbons (PAHs) – their occurrence in the environment and food.
394
Probl Hig Epidemiol 2013, 94(1),31-36.
395
24. Kim K.H.; Jahan S.A.; Kabir E.; Brown R.J.C. A review of airborne polycyclic aromatic hydrocarbons
396
(PAHs) and their human health effects. Environ Int 2013, 60, 71-80.
397
https://doi.org/10.1016/j.envint.2013.07.019
398
25. Jyethi D.S.; Khillare P.S.; Sarkar S. Risk assessment of inhalation exposure to polycyclic aromatic
399
hydrocarbons in school children. Environmental Science and Pollution Research 2014, 21, 366–378.
400
https://doi.org/10.1007/s11356-013-1912-6
401
26. Wójcik W.; Kotyra A.; Smolarz A.; Gromaszek K. Modern methods of monitoring and control of the solid
402
fuels combustion process in order to reduce its impact on the natural environment. Annual Set The
403
Environment Protection 2011, 13, 1559-1576.
404
27. Kakareka S. V.; Kukharchyk T. I.; Khomich V.S. Study of PAH emission from the solid fuels combustion in
405
residential furnaces. Environ Pollut. 2005, 133(2), 383-7. https://doi.org/10.1016/j.envpol.2004.01.009
406
28. Oleszczuk P., Baran S. Degradation of individual polycyclic aromatic hydrocarbons (PAHs) in soil polluted
407
with aircraft fuel. Polish Journal of Environmental Studies 2003, 12(4), 431-437.
29. Lamichhane S.; Krishna K. C.; Sarukkalige R. Polycyclic aromatic hydrocarbons (PAHs) removal by
409
sorption: A review. Chemosphere 2016, 148, 336-353. https://doi.org/10.1016/j.chemosphere.2016.01.036
410
30. Kamińska G.; Kudlek E.; Dudziak M.; Bohdziewicz J. Removal and fate of PAHs during
mechanical-411
biological wastewater treatment. Proceedings of ECOpole 2016, 10(2), 653-660.
412
https://doi.org/10.2429/proc.2016.10(1)071
413
31. Kozielska B.; Rogula-Kozłowska W.; Rogula-Kopiec P.; Jureczko I. Polycyclic Aromatic Hydrocarbons in
414
different airborne particulate matter fractions of areas dominated by communication emissions, Ecological
415
Engineering 2016, 49, 25–32. https://doi.org/1010.12912/23920629/64512
416
32. Seinfeld J.H.;Pandis S.N. (1998) Atmospheric chemistry and physics from air pollution to climate change,
417
Willey Interscience Publication ISBN: 978-1-118-94740-1, Hoboken, New Jersey
418
33. Kupiainen K.; Klimont Z. Primary emissions of fine carbonaceous particles in Europe. Atmospheric
419
Environment 2007, 41(10), 2156-2170 https://doi.org/10.1016/j.atmosenv.2006.10.066
420
34. Brzeźnicki S.; Bonczarowska M.; Gromiec J.P. Maximum levels for Polycyclic Aromatic Hydrocarbons
421
(PAHs). Current legal situation and proposed amendments. Med Pr 2009, 60(3), 179-185.
422
35. Wielgosiński, G.; Łechtańska, P.; Namiecińska, O. Emission of some pollutants from biomass combustion
423
in comparison to hard coal combustion. J Energy Inst 2017, 90(5), 787–796.
424
https://doi.org/10.1016/j.joei.2016.06.005
425
36. Horak, J.; Kubonova, L.; Krpec, K.; Hopan, F.; Kubesa, P.; Motyka, O.; Placha, D. PAH emissions from old
426
and new types of domestic hot water boilers. Environ Pollut. 2017, 225, 31–39.
427
https://doi.org/10.1016/j.envpol.2017.03.034