“Interval Type-2 Fuzzy Logic Rule based Data mining for Steam Turbine Fault
Analysis of a Power System Rotatory Machine Component”
1
Neelam Sahu,
2Manoj Jha,
3M. F. Qureshi
1
Ph.D. Scholar, Computer Science Department, Dr. C.V. Raman University, Bilaspur, India
([email protected])
2
Department of Applied Mathematics, Rungta Engg. College, Raipur, India
([email protected])
3
Department of Electrical Engg., Govt. Polytechnic Dhamtari, India
([email protected])
Abstract
Fuzzy decision tree or Soft Decision Tree (SDT) classifier using interval type-2 fuzzy logic rule based data
mining for steam turbine fault analysis of a power system rotatory machine component is used not only for database
analyses, but also for machine learning. The classification rules are based on standardized vibration frequency data for
steam turbines and field experts’ analyses of turbine vibration problems. The system can identify twenty types of
standard steam turbine faults. The system was developed using 1500 simulated data sets. The data mining methods were
then used to identify 20 explicit rules for the turbine faults. The results indicate that the fuzzy decision tree classifier
using interval type-2 fuzzy logic rule based data mining can be effectively applied to diagnosis of rotating machinery by
giving useful rules to interpret the data. The data mining and analysis was implemented between the fault information
dimensions table and the relationship rule dimensions table. We made sure the causes of the fault and chose the priority
solution for troubleshooting by generating candidates sets and filtering the candidate set and matching the fault. Fuzzy decision trees called soft decision trees (SDT) combines tree growing and pruning, to determine the structure of the soft decision tree, with refitting and back fitting, to improve its generalization capabilities. Moreover, a global model variance study shows a much lower variance for soft decision trees than for standard trees as a direct cause of the improved accuracy.
Keywords: Faults diagnosis, data mining, decision tree classifier (DTC); Soft Decision Tree (SDT), Interval Type-2 Fuzzy Logic Rules (IT2FLR).
I.
Introduction
Beginning in around 1985, the goal of rotating machinery (here steam turbine) fault diagnostics was primarily
to store the vibration spectra and to provide graphical tools so that the analyst could quickly access the data and
determine what might be wrong with the machine. But as the data collection devices (originally spectrum analyzers)
became smaller, faster, and more portable, the amount of data to be analyzed rapidly grew. The data acquisition system
could soon store hundreds of spectra. As the data acquisition systems and measurement techniques improved, the
analyst was faced with mountains of data. The overwhelming amount of data resulted in the new technique of data
mining, which seeks to extract knowledge from huge volumes of data through numerical analysis of the data. Data
mining is not only database analysis method, but also an important machine learning tool. This paper describes Fuzzy
decision tree classifier using interval type-2 fuzzy logic rule based data mining for steam turbine fault analysis of a
power system rotatory machine component. Many methods have been used for data mining, with the decision tree (DT)
often shown to be the most valuable form of data mining. The most important feature of Decision Tree Classifier (DTC)
is their capability to break down a complex decision-making process into a collection of simpler decisions, thus
providing a solution which is often easier to interpret.
Fault diagnosis is based on pattern identification and classification. The first step in steam turbine fault
diagnostics is pattern identification from the measured data. The next step is to interpret what the patterns indicate about
the machine, but proper interpretation requires some knowledge about the machine. Decision trees provide a good
approach to supervised classification and prediction in artificial intelligence and statistical pattern recognition. Crupi et
al. [2004] describe the use of neural networks to evaluate vibration signatures in rotating machinery and recognize the
occurrence of faults. Decision trees can be more effectively applied to steam turbine fault diagnosis because the fault
diagnosis requires not only pattern classification, but also rule extraction and knowledge interpretation.
In the spirit of solving our-days-needs of learning methods, this paper proposes a method called soft decision trees (SDT), i.e. a variant of classical decision tree inductive learning using interval type-2 fuzzy logic theory. Soft decision tree techniques have already been shown to be interpretable, efficient, problem independent and able to treat large scale applications. Interval type-2 fuzzy logic brings in an improvement in these aspects due to the elasticity of interval type-2 fuzzy sets formalism. The proposed method has been studied in detail and compared with alternative crisp methods and the results show a much improved prediction accuracy, explainable by a much reduced model variance. Also, more stability at the parameters level leads to better interpretability.
Steam Turbine Fault Diagnosis Study in Present Situation
Power system goes wrong in randomness, when each fault i.e. steam turbine fault has been taken places, it’s
changes in the scope of its parameters have a very strong randomness. There are more techniques and methods would
be used in steam turbine fault analysis, for example: expert systems, causal maps, fuzzy sets, inductive learning,
Artificial Neural Networks, wavelet transformation, Kalman Filters, etc…,In addition, the Chaos and Fractal Theories
already begun to attract people’s attention. The steam turbine operating conditions change, transient signal caused by
fault is a non-stationary random process, and the data mining is to analysis the fault, which based on high-frequency
transient state component of fault, and which to predict, determine and deal with the possible fault, so that we can set up
the scheduling plan for reasonable and guarantee the security of electricity supply and improve operation efficiency.
Fault Mode
Steam turbine in the long-term operation and maintenance has accumulated rich experience and a lot of
original information, and it is important for enterprises to change these experiences and information
Table.1. the Structure of Fault Mode Dimensions
ID Fault properties Description
1 Fault code The fault of unique identifier
2 Fault Statistics code
Used for statistical analysis, the user can determine the statistical particle size.
3 Fault Level Fault Level can be divided into mild fault, general fault, a serious fault and a fatal fault
4 Fault Parent code The structure of fault mode organized by tree, and definite the logical relationship each other
5 Type of coding parts
Identification of the components correspond to the type of fault mode
6 Service Time The fault corresponding to the general maintenance service time
7 Cause of fault The essence reasons for fault
manifestation)
into knowledge. Fault mode is the genuine cause of the fault which is the appearance summarized when the products
take place fault. Fault mode is the one of the main target of data mining, the appearance of fault are classified and
cleaned up to form the fault mode is a valuable resource for enterprises. The user's description of fault is often the fault's
appearance, and the fault appearance is only the outward manifestation of the issue of fault in many cases, the
appearance of fault will correspond to the fault cause can be cleaned up and analyzed by the experience and relevant
technical standards and come into a standard dimension table of the fault mode. A typical fault mode recorded content
as shown in table 1. Among them, the items 1,2,4,7 are the key elements of the system and are the basic to deal with the
fault information. The data of the fault mode dimension table initialization comes from the historical experience of
enterprise data; Fault mode dimension table can be maintained by automatically and artificial maintenance, the main
source of information is the user feedback of the new fault appearance.
II. Interval Type-2 Fuzzy Logic Rule Generation for Data Mining Based Fault Detection
Data mining rules
The knowledge characteristics of diagnosis field and the steam turbine fault mode analysis are provided by a
variety of technical parameters or experience, it combined with interval type-2 fuzzy logic methods, production rules
based on the uncertain knowledge reasoning were adopted, the general form of the rules as follows: Fuzzy Rules: IF P
THEN Q, in which P = P1 (C1) AND / OR P2 (C2) ... Pn(Cn),
P is fault appearance, it could be a simple fault appearance, and also, it could be a logical combination by a
number of a simple fault appearance, for example,
P = P1(C1) AND P2 (C2) OR P3 (C3)
For each fault appearance P1, P2, ..., Pn can be assigned a corresponding confidence value C1, C2, ..., Cn, it is the
percentage of the credibility of the fault appearance (probability of the fault appearance); Q is the real reason for the
fault ,and it may be one or more conclusions. A large number of valuable knowledge would be found from fault
information for production, management and for maintenance steam turbine and circuitry to use for reference, so that,
the accuracy of fault diagnosis is improved and the time of fault remove is shorten. Data mining process in the fault
information was shown in Fig 1.
The main objective of data mining is to use the correlation of the fault information in data warehouse in order
to find the information which is hidden and divinable and understandably and valuable, and to find the model which is
easy understand by people to describe the data in the data warehouse. The data was collected according to fault model
which was cleaned up and a fairly standard, it is easy for enterprises to establish knowledge dimension table and the
relationship rules dimension table, in the data warehouse can be found a large number of knowledge about equipment’s
performance, operation status, scheduling scheme, the cause of the fault, service decision, etc. It can generate many
different fault conclusions; it is fit for multi-fault diagnosis of intelligent systems.
Fig.1 The data mining process of trouble information
First of all, the sequence of the fault dimension table was created in the data warehouse, the corresponding ID
number was found according to these faults number, and the ID numbers were sorted. Then the output results of the
Package1 were be converted into numeric, and it kept in the computer's memory as hexadecimal number. A "Test
Model" was created by the rules of the dimension table records, and with the “Fault Model” match, then an ideal
frequent item sets and candidate frequent item sets were generated.
We would be carried out with “Fault Model” and “Test Model” computing as the rules of data mining were
given in previous, the frequent item sets 1 and frequent item sets 2 were generated. At last, traversing each records in
the rules dimension table, repeat it, the frequent item sets 1 and frequent item sets 2 were generated. If the frequent item
sets 1 is empty while it replaced by the contents of frequent item sets 2, while empty frequent item sets 2. Matching
fault mode combines with the fuzzy inference rules to filter the dimension.
Interval Type-2 Fuzzy Logic Systems (IT2FLS)
Fuzzy Logic Systems (FLS) are known as the universal-approximators and have various applications in
identification and control designs. A type-1 fuzzy system consists of four major parts: fuzzifier, rule base, inference
engine and defuzzifier. A type-2 fuzzy system has a similar structure, but one of the major differences can be seen in the
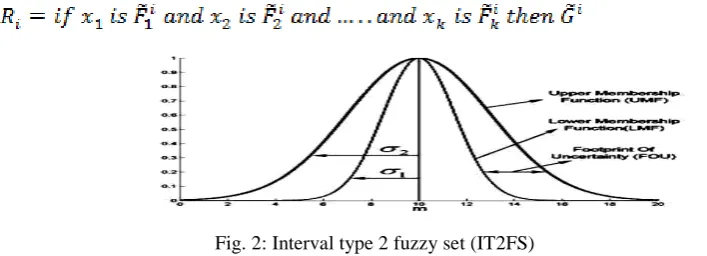
rule base part, where a type-2 rule base has antecedents and consequents using Type-2 Fuzzy Sets (T2FS). In a T2FS,
we consider a Gaussian function with a known standard deviation, while the mean (m) varies between m1 and m2.
Therefore, a uniform weighting is assumed to represent a footprint of uncertainty as shaded in Fig.2. Because of using
such a uniform weighting, we name the T2FS as an Interval Type-2 Fuzzy Set (IT2FS). Utilizing a rule base which
consists of IT2FSs, the output of the inference engine will also be a T2FS and hence we need a type-reducer to convert
it to a type-1 fuzzy set before defuzzification can be carried out. Fig.3 shows the main structure of type-2 FLS.
By using singleton fuzzification, the singleton inputs are fed into the inference engine. Combining the fuzzy
if-then rules, the inference engine maps the singleton input x = [x1, x2,…x3] into a type-2 fuzzy set as the output. A typical
form of an if-then rule can be written as:
(1)
Fig. 2: Interval type 2 fuzzy set (IT2FS)
Where Fk are the antecedents (k = 1,2,…,n) and G i
is the consequent of the ith rule. We use sup-star method as
one of the various inference methods. The first step is to evaluate the firing set for ith rule as following:
(2)
As all of the Fks are IT2FSs, so Fi( ) can be written as
Where:
(3)
(4)
The terms and are the lower and upper membership functions, respectively (Fig.2). In the next step,
the firing set Fi(x) is combined with the ith consequent using the product t-norm to produce the type-2 output fuzzy set.
with the defuzzification procedure, which uses Center of Sets (COS) method. First, the left and right centroids of each
rule consequent are computed using Karnik-Mendel (KM) algorithm. Let’s call them yl and yr respectively.
The firing sets computed in the inference engine are combined with the left and
right centroid of consequents and then the defuzzified output is evaluated by finding the solutions of following
optimization problems:
(5)
(6)
Define flk( ) and frk ( ) as a functions which are used to solve (5) and (6) respectively and let
And
Then we can write (5) and (6) as:
(7)
(8)
Fig.3: Main structure of interval type-2 FLS
Where
And are the fuzzy basis functions and
And are the adjustable parameters.
Finally, the crisp value is obtained by the defuzzification procedure as follows:
(9)
Where
and
III.
Soft Decision Tree Classifier (Interval Type-2 Fuzzy Logic based Decision Tree
Classifier)
Soft decision trees versus crisp regression trees
We present intuitively the formal representation of a soft decision tree by explaining first the regression tree
(RT) type of induction. Regression trees and soft decision trees (SDT) are extensions of the decision tree
(a). RT (b). SDT
Fig.4 Regression tree versus soft decision tree.
induction technique, predicting a numerical output, rather than a discrete class. Both trees may be used in regression problems given their output (numerical by definition), or in classification problems, by a priori de4ning symbolic classes on the numerical output. Fig.4shows a crisp regression tree (left part (a)) and a soft decision tree (right part (b)). Both were built for a steam turbine fault diagnosis. The input space is here defined by an attribute characterizing the system
Fig.5 Example of a crisp class and a fuzzy class
state,denoted respectively by “P” fault appearance. The output is denoted by “Q” real cause of fault. We formulated it
as an interval type-2 fuzzy class based on a parameter called critical clearingtime (CCT) of the system state (see Fig.5).
The trees predict the membership degree of instancesto this interval type-2 fuzzy class. In a crisp decision (see Fig.5),
the system could be considered “unhealthy” if the CCT is smaller than 155ms, “healthy” otherwise (classification
problem). In a soft decision, there is a transition region of 110 ms (as we defined it) in which the system is
neither”healthy” nor “unhealthy”(regression problem).
We may also express the result in a crisp way (see crisp class of Fig.5): since 0.87 ms corresponds to a CCT
value smaller than 155 ms, the conclusion is that the class estimated by the regression tree is “unhealthy”. By translating
the tree into a rule base, the rule extracted from the tree fired by our instance looks like:
Rule: If P is .87 ms then Q unhealthy
Soft decision tree
The two parameters defining it are: α, which is the location of the cut-point and corresponds to the split threshold in a test node of a decision or a regression tree, and β which is the width, the degree of spread that defines the
transition region on the attribute chosen in that node. With such a
Fig.6 Example of discriminator function: piecewise linear.
Piecewise linear discriminator function, the local input space of a node is split (fuzzy partitioned) into two
overlapping sub regions of objects. Some objects go only to the left successor, some only to the right one, and the
objects in the overlap region go to both successors. The larger the transition region in a test node, the larger the overlap
and the softer the decision in that node. In consequence, any given instance is in general propagated through the tree by
multiple decision paths in parallel: in the simplest case through one path, in the most complex case, through all the paths. This given instance does not effectively belong to a node it passes through, but has a membership degree attached to that node. Thus, the node may be seen as a fuzzy set. Finally, the given instance reaches multiple terminal nodes and the output estimations given by all these terminal nodes are aggregated through some defuzzification scheme in order to obtain the final estimated membership degree to the target class.
Building a soft decision tree (SDT)
Fig.7 presents an overview of the complete procedure for building a soft decision tree (SDT). The process
starts by growing a “sufficiently large” tree using a set of objects called growing set GS. Tree nodes are successively
added in a top-down fashion, until stopping criteria are met. Then the grown tree is pruned in a bottom-up fashion to
remove its irrelevant parts. At this stage, a cross validation technique is used which makes use of another set of objects,
called the pruning set PS. Next, a third step could be either a refitting step or a back fitting step. Both consist of tuning
certain parameters of the pruned tree model in order to improve its approximation capabilities further. These steps use
the whole learning set: LS =GS ∪PS. At the end of every intermediate stage, the obtained trees (fully developed, pruned, refitted or backfitted) may be tested in order to quantify their generalization capability. A third sample, independent from the learning set, called test set TS, is used to evaluate the predictive accuracy of these trees. Thus, a given dataset is split initially into two disjoint parts, the learning set LS and the test set TS. The learning set is then used to create two other disjoint sets: the growing GS and the pruning PS sets. Growing, pruning and test sets are (normally) composed of mutually independent samples, as far as one can assume that this is the case for the original dataset.
Fig.7 The procedure of building a SDT. Fig.8 Fuzzy partitioning of a node in a SDT.
Fault Classification
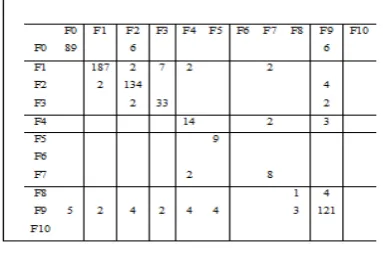
The Confusion Matrix, shown in Table 2 is a convenient way of examining the classification accuracy of the
models and their distribution in various classes. It gives the count of the correctly classified instances.
Table2. The Confusion Matrix obtained from the decision tree model
Correctly classified instances 588 92.52 %
Incorrectly classified instances 58 8.85 %
The diagonal elements are the correctly classified faults, and the off-diagonal elements are the incorrectly
classified faults. One can preprocess a dataset, feed it into a learning scheme, and analyze the resulting classifier and its
performance. The learning methods are called classifiers. A soft decision tree (SDT), cross fold validation or a
multilayer perceptron can be used to classify instances.
IV.
Steam turbine fault diagnostics
Steam turbine faults are generally classified into twenty types listed in Table 3 based on field experts’
experience and theoretical analyses.
In any faults diagnosis, feature extraction is an important step for detecting steam turbine faults. Features can
be extracted from the frequency domain of a typical steam turbine vibration analysis. However, analysis of the steam
turbine data requires a detailed understanding of the steam turbine design, operation, and maintenance. Vibration
spectrum analysis is a practical and powerful tool for steam turbine fault diagnosis because it is based on a great deal of
engineering experience. Although there have recently been many new methods applied to fault diagnosis, most
approaches are based on or related to the vibration spectrum data. However, the fault cannot be easily related to the
spectrum data because the steam turbine system is very complex and influenced by numerous process parameters. The
best method is to use the feature-fault relationship matrices in well-established machining reference databases, expert
intelligence for the reasoning and decision-making and experimental results of signal characteristics for various
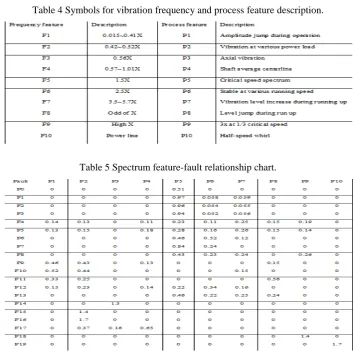
working conditions. Table 5 show a fuzzy feature-faults relationship matrix for a steam turbine developed using fuzzy
mathematics. The table relates the typical twenty steam turbine faults with ten vibration spectrum features. The
alphabetic symbols used to describe the spectrum and process features are listed in Table 4. The notation n・X in the
second column of table 4 denotes a frequency component (or range) in the spectrum at n times the turbine’s rotational
speed.
Table 3 Steam turbine fault classification.
The relationships listed in Table 5 show that some faults such as an imbalance, F1 and a bent shaft, F3 cannot
be distinguished since they have similar spectrum features. Therefore, a second relationship matrix given in Table 6 is
used to relate the process features to the steam turbine faults. Table 5 was derived directly from the author and other
field expert experience, so it can be used to efficiently diagnose faults. The two relationship charts in Tables 5 and 6
provide the basis for steam turbine fault diagnosis.
Table 4 Symbols for vibration frequency and process feature description.
Table 5 Spectrum feature-fault relationship chart.
Table 6 Process feature- fault relation chart.
V.
Problem Simulation
Interval Type-2 Fuzzy Inference System (IT2FIS)
An Interval Type-2 Fuzzy Inference System (IT2FIS) are used for automatically generate the necessary rules.
The phase of data mining using Interval Type-2 Fuzzy Inference Systems (IT2FIS) becomes complicated, as there are
enough rules to determine which variables one should take into account. The search method of back-propagation and
hybrid learning (BP+RLS) is more efficient in other methods. Since the IT2FIS method seems to produce more accurate
models with fewer rules is widely used as a numerical method to minimize an objective function in a multidimensional
space, find the approximate global optimal solution to a problem with N variables, which minimize n the function,
varies smoothly.
Fig.9 Rules on a Type-2 Fuzzy Inference System.
With the application of this grouping algorithm we obtain the rules, the agent receives input data from its
environment and chooses an action in an autonomous and flexible way to fulfill its function. We create an Interval
Type-2 Fuzzy Inference System as how we could represent different agencies as a decision-making system into agents.
The Fig.10 shows a type-2 fuzzy inference system for steam turbine fault diagnosis. It depicts a set of
input-output variables and a rule set. Output variables are healthy and unhealthy as a response of the system. We could use the
difference between both values to make decisions into an agent as a preference decision-making system. The Fig.11
depicts the resolution example of the rules by the fuzzy inference system. Different quantitative input values could be
introduced and the system resolve creating different responses. Depending of the combination of inputs, we can expect
different responses of the system. An agent will use this inference system as a decision-making system to show different
behaviors depending of the situation.
Table.7 Classification results for various purities. Fig.10 Fuzzy Inference System for
steam turbine fault diagnosis.
Fig.11 Fuzzy Inference System Rule Set Evaluation for Steam Turbine Fault Diagnosis.
VI. Application of data mining to steam turbine fault diagnosis
A numerical simulation was developed based on the two relationship matrices in Tables 3 and 4 to test the soft
decision tree classifier. The simulation firstly generated one hundred data points including spectrum features and
process features for each type of steam turbine fault for a total of 2000 data points. Then, the data set was randomly
divided into training and test sets. Next, the Ctree software was used to analyze the data set and to grow the soft
decision tree. The pruning technique was used to generate a stable tree. The maximum purity of the tree was adjusted to
get better results.
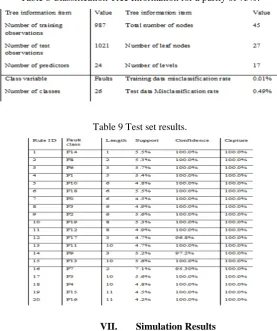
For example, for a maximum purity rate of 100%, the misclassification rate for the training set was 0% and for
the test set was 1.8%. However, when maximum purity was reduced to 75%, the misclassification rate for test set was
reduced to 0.50%. Table 9 lists the results for various purities.
Table 8 Classification Tree Information for a purity of 75%.
Table 9 Test set results.
VII. Simulation Results
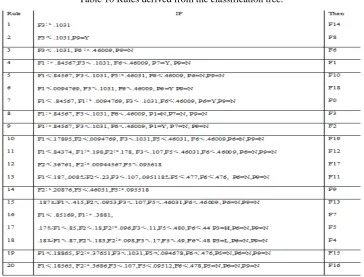
Tables 6, 7, and 8 list the classification results for the simulated steam turbine faults data. Table 6 describes the
resulting soft decision tree for a maximum purity of 75%. The misclassification rate is sufficiently low for common
engineering applications. The soft decision tree was then used to develop the IF-THEN rules used by engineers to
analyze and interpret the fault diagnosis results. The method can automatically extract the knowledge from the data as
part of a fault diagnosis expert system. Table 7 summarizes the rule results for the test set, including the support,
confidence rate measures the accuracy of the rule. The capture indicates how many records of a fault were correctly
captured by the rule. The twenty rules after pruning correspond to the twenty types of faults. Most of the confidence
rates were 100%, with only 3 confidence rates less than 100% due to misclassification of the test data. Table 8 lists the
specific rules for each fault type. The rules agree well with spectrum analysis theory. In addition, many process features
from the field experts’ experience are integrated into the rules to improve the classification process.
VIII.
Conclusions
Soft Decision Tree Classifier using Interval Type-2 Fuzzy Logic Rule based Data mining was used to classify
simulated data and real data into known classes for Steam Turbine Fault Analysis of a Power System Rotatory Machine
Component. The use of the simulated data enabled the system to directly capture the field experts’ knowledge into the
resulting classification rules. The classification rules were automatically extracted from the data sets for use by
engineers to diagnose and interpret steam turbine faults. The simulation results and the results using actual data from
operating power plants shows that the soft decision tree classifier using interval type-2 fuzzy logic rule based data
mining methods can be effectively applied to steam turbine fault diagnostics. The automatic extraction of the
classification rules shows that these machine learning methods can be applied to large turbo-machinery databases and
can include engineering knowledge and field experience. The results can then be used for fault diagnosis of large
rotating machines, such as steam turbines.
Table 10 Rules derived from the classification tree.
References
1. HE Yue-shun; DING Qiu-Lin (October 2005) “Technique research of data mining based on semi-structure data source” Journal of Harbin
Institute of Technology, Vol.37, pp.1363-1365,1369
2. HE Yue-shun, DU Ping,DING Qiu-lin (2005) “Trouble Pattern Analyze Based on Data Mining[J]”. Application Research of Computers,
22(11):42-43.
3. Efrem G. Mallach “Decision support and data warehouse systems” Boston: McGraw-Hill, 2005.12,79-80.
4. I.H. Witten and E. Frank: Data Mining: Practical Machine Learning Tools and Techniques with Java Implementations (Academic Press.
USA, 2000).
5. S.K. Tso, J.K. Lin, H.K. Ho, C.M. Mak, K.M. Yung, Y.K.Ho (Feb. 2004) “Data mining for detection of sensitive buses and influential
buses in a power system subjected to disturbances”, IEEE Trans. on Power Svstems, Vol.19, No.1, pp. 563 - 568.
6. V. Figueiredo, F. Rodrigues, Z. Vale, J.B.Gouveia, (May 2005) “An Electric Energy Consumer Characterization Framework Based on
Data Mining Techniques”, IEEE Trans. on Power Systems, Vol.20, No.2, pp. 596 - 602.
7. M. Chaganti, B.H. Chowdhury (2004) “Data mining of substation relay data”, IEEE Power Engineering Society General Meeting, Vol.1,
pp. 369 - 375, 6-10 June.
8. J. Han and M. Kamber, (2001) “Data Mining Concepts and Techniques”, Morgan Kaufmann Publishers.
9. X.Z. Wang, B. Chen, G. Qian, F. Ye, (2000) “On the optimization of fuzzy decision trees”, Fuzzy Sets and Systems 112 (1), 117–125.
10. L. Wehenkel, M. Pavella (1993), “Decision tree approach to power system security assessment”, Electrical Power Energy Systems 15 (1), 13–36.
11. Y. Yuan, M.J. Shaw (1995) “Induction of fuzzy decision trees”, Fuzzy Sets and Systems 69, 125–139.
12. Y. Peng, G. Kou, Y. Shi and Z. Chen (2008). “A descriptive framework for the field of data mining and knowledge discovery”.
International Journal of Information Technology and Decision Making, 7:639–682.
13. J.R. Castro, O. Castillo, P. Melin and A. Rodr´ıguez-D´ıaz, (2008). “A hybrid learning algorithm for a class of interval type-2 fuzzy neural
networks”. Journal of Information Sciences, 179(13):2175–2193.