A Ten-Year Study of Vegetational Changes
Associated with Biological Control of
Klamath Weed1
C. B. HUFFAKER AND C. E. KENNETT
Entomologist, and Principal Laboratory Technician, De- partment o j Biological Control, Agricultural Experiment Station, University of California, Berkeley
The introduction of the effec- tive leaf-beetle, Chrysolina quad- rigemina (Rossi), into the United States for the control of Klamath weed, or St. Johnswort
(Hypericum perfoTatum) , was
first accomplished in February, 1946 (Holloway and Huffaker, 1951). During the 12 years which have elapsed since this introduc- tion, data on the composition of rangelands previously heavily infested with this weed have been obtained. It is the purpose of this paper to discuss these data as they bear upon two important questions: (1) To what degree has the weed been reduced by this biological control in the areas studied, and (2) what has been the economic nature of the changes in composition of the vegetation on these ranges?
At the request of the senior author the California State De- partment of Agriculture initiated a survey in 1951 of the Klamath weed infestations in the State, projected as prior to control by bettles, which control was at that time just getting under way. The county agricultural commission- ers estimated a total of 2% mil- lion acres of Klamath weed in- fested ranges (Pryor, 1952). This indicates the seriousness of the original problem.
In a study of this kind it is
1 This work was conducted as part of a cooperative project; with the Agricultural Research Service, U.S. Department of Agriculture. The entomological aspects of this work have appeared in various journals. The program was initiated by the late Professor H. S. Smith.
necessary to ponder the possible improvement even if maximal success in reduction of the weed were attained. Clements and Shelford (1939: 285-293) consid- ered that three-fourths of the land south of Mt. Shasta and from the Coast to the foothills of the Sierra Nevada in Northern California was originally peren- nial climax grassland, and that replacement by annuals was largely due to overgrazing. Hor- may and Fausett (1942) state that annuals now make up 90 to 100 percent of the forage on such ranges, and Sampson (1944)) Jones and Love (1945)) and Bentley and Talbot (1948) con- clude that general re-establish- ment of perennials cannot be ex- pected on some ranges, nor would such necessarily be desir- able.
The present work accents the role which insects may exert with respect to the composition of natural vegetation. Range ecologists have given prominent position to the role of the large herbivores and rodents in deter- mining the composition of range vegetation. They have paid prac- tically no attention to the role of the much more selective graz- ers among the plant feeding in- sects which abound on those same ranges. They are, in fact, largely unaware of the high de- .gree of restriction in diet of many of these forms (Huffaker, 1957).
The present effort is limited to the period from 1947 to 1957 at specific study-areas in three of the important infested counties
and Placer. The data are indic- ative of results generally, al- though the specific changes in vegetation vary greatly in time and place.
The results form an essential part of the general evidence and confirm this program as one of the striking world-wide ex- amples of biological control of a weedy species.
Methods
The data were obtained in two ways. First, the ranges and spe- cific sites on which the beetles were first released were studied at four locations by use of an in- tensive method of samplng, and these results are presented sep- arately for the Loftus site
(Shasta County), the Loomis site (Placer County), the Blocks- burg site (Humboldt County), and the Fort Seward site (Hum- boldt County). The second method of study was used to fol- low the general progress of con- trol of Klamath weed and changes in plant composition over a much more extensive area, but this method of study sacrificed accuracy in determin- ing specific composition, particu- larly as represented by plant species of purely secondary im- portance. These latter results are included under the topic, “Vege- tation of the Ten Mile Sequence Quadrats.” This designation is used because the data embrace the changes occurring in a region extending 10 miles from the point of the original colonization of beetles at the Blocksburg site to a position about 3 miles south of Alderpoint. Twenty-seven range areas were sampled at this sequence of locations. They are not designated except by dis- tance from the point of begin- ning.
The more intensive study was designed to give an accurate picture of the detailed changes in vegetative composition assoc- iated with the action and densi- ties of the two leaf-feeding
*
70 C. B. HUFFAKER AND C. E. KENNETT
the microplots were recorded at each pin.
beetles, Chrysolina quadrigem- ina (Rossi) and C. hyperici Forst. Consequently, counts of the beetle populations as well as the plant densities were taken. Excepting for the Loftus site, the method used at these four study areas was described by Huff aker and Holloway (1949) and Huffaker (1951). A samp- ling frame (Figure 1) one- fourth square meter in area and having 28 rods as microplot des- ignators was used. The plant spe- cies of greatest development within a radius of 1 inch (all levels considered) was recorded at each rod. The frame made pos- sible a rapid determination of the dominant plants, with a con- siderable degree of sensitivity to species which were dominant only at small micro-areas in a quadrat. The method reflects what is implied-the proportions of micro-positions two inches in diameter dominated by the dif- ferent species. Parker (1948) de- veloped a similar method. Four distance zones were used at the Loftus site in Shasta County-at the center, or beetle release zone, and at y2 mile, 1 mile, and 3 mile distances. The first sampling Gas done in 1951. Seven permanent
quadrats at each distance zone were used. It is significant that the Loftus areas were not typical of infested ranges in that county or generally. The location was chosen because it was at that time the only chance of studying the natural movement of beetles from the center zone to the farth- est distance. Thus, this study made it possible to infer natural dispersion and control of the weed, but it did not represent typical, sun-exposed range under normal grazing management, such as was the case for the other sites.
No description has been pub- lished of the second method of sampling. In the lo-mile se- quence area, time did not permit the detailed method that was used at the four original beetle release sites. Only the three pre- dominant plant species present in each quadrat were listed as to estimated coverage. Beginning at 4 the original beetle colony site at Blocksburg in Humboldt County, positions southward toward Alderpoint were established at each quarter-mile, up to and in- cluding 10 miles, except as such positions were occupied by heavy timber, barren river beds, lum-
ber camps, or other terrain on which Klamath weed had no pos- sibility of characteristic success. This study is therefore represent-
ative of the ranges in that region, independent of whether the weed ever existed there for whatever reasons except that of obvious unsuitability. The re- sults reveal the extent of previ- ous infestations by this weed, the degree of control, and the pat- tern of vegetative improvement during the course of beetle action
over the past 12 years.
At each distance, three quad- rats, each of 1 square meter area, were staked out, and these were: (1) about 5 yards within the range area from the roadside, (2) 50 yards straight in perpendic- ular to the road, and (3) 100 yards in the same direction. These samples inadequately repre- sented any given field, but col- lectively, they provided a de- pendable estimate of the range condition for the region. Table 6 shows the proportions of the total coverages that were typi- cally included by the three pre- dominant species in each quad- rat. The remaining coverage was in each case unassigned, but was occupied by miscellaneous spe- cies. Actually, in many of those quadrats where a generally dom- inant species did not occupy a position as one of three predomi- nants, it nevertheless was pres- ent as an important element among the miscellaneous repre- sentatives. Hence, on the aver- age the figures listed for each species are probably lower than would have been the case had a more complete sampling been done.
All Klamath weed plants were listed whether or not this spe- ties was predominant, as were all perennial grasses. This was done so as to follow any progres- sive changes in perennials.
Results
C. hyperici,
in controlling Klamath weed in California was reviewed in some detail by Hol- loway and Huffaker (1951), and Huffaker (1951, 1953). Typical of their action generally, in the present study the critical action was the feeding of the larvae, which keeps the plants defoli- ated over a long period at a time when the food reserves in the root system are low. Mass de- struction of plants from this action was common, whereas adult feeding, voracious as it is, was extended over too short a period for effective results.The larvae fed actively at warm periods throughout the winter and early spring on the prostrate, leafy winter growth. By midwinter and early spring when the larvae reached near- maturity, the destruction was very intense after sufficient time had elapsed at a given site for the building up of a large pop- ulation. A large proportion of these plants, which were heavily fed upon and continuously stripped of foliage from mid- winter to spring, failed to put out growth and died. Some of the most vigorous ones, as well as those which were, during a given year, less damaged, sent out new growth; and these, as well as others distant from the heavy populations, were later destroyed or weakened by the adults. Adult activity is most conspicuous at the period of flowering in late spring.
The graphs of weed and beetle densities presented by Huffaker (1951), covering the first few years’ results, showed (1) the rapid control of the weed, (2) the associated mature insects issuing each year, and (3) the decline of the beetles themselves following depletion of their own food. The decline in weed densities, zone by zone, followed a course ex- plicable only, and directly ac- complished, by larval feeding.
However, the sampling of ma- ture or nearly mature beetles gave a poor reflection of the pop-
ulations accomplishing the con- trol. The size of the mature brood is an indication of destruc- tion to come rather than that previously accomplished, be- cause the larvae of the following generation represent the actual controlling factor. Only rarely do the larvae occur in numbers just sufficient to control the weed and yet have adequate food to mature. Starvation usual- ly reduces them prior to matur- ity to a small proportion of those which accomplish the destruc- tion.
The work at Loftus was initi- ated in 1951 and sampling of im- mature populations was done in order to correct for the inade- quacy of the earlier method.
Figure 2 shows the zone by zone pattern of beetle and Kla- math weed densities. The main weed decline occurred in the center zone in 1951-52 as a result of the winter feeding of the large number of larvae - 291 per 1/4 square meter. The next year there was a slight resurgence of the weed as the beetles moved into adjacent, more lush weed areas. These weeds were de- stroyed by the large population per plant the next year. The beetles attained controlling den- sities at the $-mile zone during the winter of 1952-53, and sharp decline of the weed followed. At this mildly shaded location the weed persisted every year at a very low density, and beetle lar- vae were recorded every year except 1956.
Progress at the l-mile and 3- mile zones was similar, except that larger populations were re- quired to achieve the result at the shaded, l-mile location. Beetles were first observed in both zones in 1952, although the build-up of larval populations was rapid in the sunny zone and retarded in the shaded one. Nevertheless, during 1953 and 1954 the weed began declining and this continued for three or four years - the control being much less sudden and dramatic
LOFTUS
CENTER ZONE 300
250
I I
3 MILE ZONE
KLAMATH WEED
* .
BEETLES
o-m- -4
FIGURE 2. The zone-by-zone pattern of reduction in Klamath weed and the cor- responding populations of immature beetles per %-square-meter quadrat at the Loftus site.
than is characteristic for Hum- boldt County, for example, but, nevertheless, ultimately satis- factory.
From this study it was shown that even in areas such as the Fort Seward and Blocksburg sites, where Klamath weed re- mained at an exceedingly low level during the entire )reriod subsequent to its destruction, the beetles maintained themselves at very low densities each winter in or near the quadrats, even though no established, mature plants were present for several years (Tables 2 and 3).
72
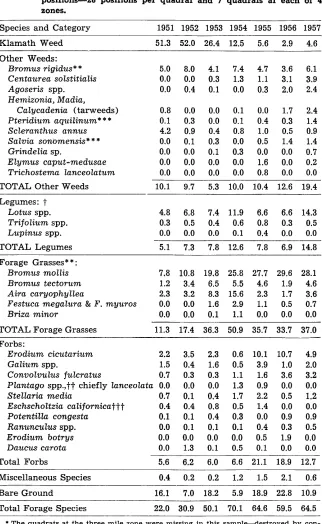
Table 1.
C. B. HUFFAKER AND C. E. KENNETT
Dominance of range planf species af micro-plof posifions in quad- rafs laf fhe Loftus beetle sites, expressed as percentages of fofal posifions-28 posifions per quadraf and 7 quadrafs af each of 4 zones.
Species and Category 1951 1952 1953 1954 1955 1956 1957
Klamath Weed 51.3 52.0 26.4 12.5 5.6 2.9 4.6
Other Weeds:
Bromus rigidus * * 5.0 8.0 4.1 7.4 4.7 3.6 6.1
Centaurea solstitialis 0.0 0.0 0.3 1.3 1.1 3.1 3.9
Agoseris spp. 0.0 0.4 0.1 0.0 0.3 2.0 2.4
Hemixonia, Madia,
Calycadenia (taxweeds) 0.8 0.0 0.0 0.1 0.0 1.7 2.4
Pteridium aquilinum* * * 0.1 0.3 0.0 0.1 0.4 0.3 1.4
Scleranthus annus 4.2 0.9 0.4 0.8 1.0 0.5 0.9
Salvia sonbmensis* * * 0.0 0.1 0.3 0.0 0.5 1.4 1.4
Grindelia sp. 0.0 0.0 0.1 0.3 0.0 0.0 0.7
Elymus caput-medusae 0.0 0.0 0.0 0.0 1.6 0.0 0.2
Trichostema Zanceolatum 0.0 0.0 0.0 0.0 0.8 0.0 0.0
TOTAL Other Weeds 10.1 9.7 5.3 10.0 10.4 12.6 19.4 Legumes: t
Lotus spp. 4.8 6.8 7.4 11.9 6.6 6.6 14.3
Trijolium spp. 0.3 0.5 0.4 0.6 0.8 0.3 0.5
Lupinus spp. 0.0 0.0 0.0 0.1 0.4 0.0 0.0
TOTAL Legumes 5.1 7.3 7.8 12.6 7.8 6.9 14.8
Forage Grasses * * :
Bromus mollis 7.8 10.8 19.8 25.8 27.7 29.6 28.1
Bromus t(ectorum 1.2 3.4 6.5 5.5 4.6 1.9 4.6
Aira caryophyllea 2.3 3.2 8.3 15.6 2.3 1.7 3.6
Festuca megalura & F. myuros 0.0 0.0 1.6 2.9 1.1 0.5 0.7
Briza minor 0.0 0.0 0.1 1.1 0.0 0.0 0.0
TOTAL Forage Grasses 11.3 17.4 36.3 50.9 35.7 33.7 37.0 Forbs:
Erodium cicutarium 2.2 3.5 2.3 0.6 10.1 10.7 4.9
Galium spp. 1.5 0.4 1.6 0.5 3.9 1.0 2.0
Convolvulus julcratus 0.7 0.3 0.3 1.1 1.6 3.6 3.2
Plantago spp.,$T chiefly Zanceolata 0.0 0.0 0.0 1.3 0.9 0.0 0.0
Stellaria media 0.7 0.1 0.4 1.7 2.2 0.5 1.2
Eschscholtzia calijornica-ftt 0.4 0.4 0.8 0.5 1.4 0.0 0.0
Potentilla congesta 0.1 0.1 0.4 0.3 0.0 0.9 0.9
Ranunculus spp. 0.0 0.1 0.1 0.1 0.4 0.3 0.5
Erodium botrys 0.0 0.0 0.0 0.0 0.5 1.9 0.0
Daucus carota 0.0 1.3 0.1 0.5 0.1 0.0 0.0
Total Forbs 5.6 6.2 6.0 6.6 21.1 18.9 12.7
Miscellaneous Species 0.4 0.2 0.2 1.2 1.5 2.1 0.6
Bare Ground 16.1 7.0 18.2 5.9 18.9 22.8 10.9
Total Forage Species 22.0 30.9 50.1 70.1 64.6 59.5 64.5 * The quadrats at the three mile zone were missing in this sample-destroyed by con-
struction. This accounts in part for the increase in percentage of weedy species, compared with 1955 (see text).
** Bromus rigidus produces an abundance of palatable forage during its early growth, and since it can be grazed sufficiently to curtail heavy production of the objection- able seed heads, it is questionably placed as a weed.
*** These two species occupied an expected position at these shaded locations. They are a natural part of such vegetation.
t All species of these genera were considered with the desirable forage species, since although some have low palatability, they are not pernicious and all add to soil fertility.
tt Thornber (1910) classed some plantains very important as forage.
ttt “Range Plant Handbook” rates this species as fair forage for sheep and states that tests have failed to establish it as poisonous.
varying with the years, there was a marked decline after about five years. In 1955 and 1957 a very greatly reduced number of seedlings was characteristic. The beetles fed actively on the seed- lings, deposited eggs on them, and a very rare larva developed to maturity by moving from seedling to seedling to feed. Thus, the beetles survived, though widely dispersed in pro- portion to numbers, and synchro- nous with any focal points of weeds which would otherwise become mature, flower, and pro- duce seeds.
Another reason the beetles are able to survive and control their host plant at very low weed den- sities is that they do not achieve full success under shade (Table 1). This is commonly observed in this country, and is reported by Clark (1953) and Parsons (1954) as a reason why they gave inadequate control in Australia, where, contrary to the status in California, important inf esta- tions occur in partially wooded areas. However, differences in summer rainfall are also in- volved. When laying eggs, the beetles shun heavy shade for sunnier locations. The grazing value of such shaded rangelands in California is very small in pro- portion to the extensive open ranges where control is com- plete; and these shaded areas furnish “marginal” survival, maintaining a better distribution of the beetles against the po- tential localized resurgence of the weed on the important open ranges.
Vegetifion af The Loffus Site, Shasta Counfy2
Table 1 and Figure 2 show the control of Klamath weed and the changes in cover for other plants
at the Loftus site. In 1951, Kla- math weed was dominant in all zones, although deervetch (Lotus americanus), soft chess (Bromus mollis), and ripgut brome (B. rigidus) were, collectively, im- portant in the center zone. Kla- math weed was the sole domi- nant at the other three zones, and bare spots between the clumps of weeds were common, as were certain substrata1 forms. The weed decline and beetle action, zone by zone, is shown in Figure 2.
The beetles had been released in 1948, but their results were slight through 1951. By 1952, they had destroyed nearly all the weed in the central zone, and soft chess, ripgut brome and Lotus spp., then predominated. Yet, there was an increase in the weed’s importance in the other zones, as the beetles had not at- tained high densities there. This accounts for the fact (Table 1) that Klamath weed was just as important, as a whole, in 1952 as in 1951. By 1953, the beetles had removed the weed at the $-mile zone, and there was some reduc- tion at the other two zones, the greater reduction being at the one-mile zone. By 1954, the weed in the two closest zones had been brought under good control, and a marked reduction achieved at the distant zones.
Combining the zones (Table 1), Klamath weed was reduced by 1953 to 26.4 percent; by 1954, to 12.5 percent; and by I955 to 5.6 percent. In 1956 and 1957 there was no appreciable further de- crease. This is contrary to ex- perience nearly everywhere in California except in shaded lo- cations, and many of these quad- rats were in partially shaded areas. Thus, these areas, as pre- viously stated, are not typical of the former economic problem.
As the weed was reduced, the space vacated was taken by spe- cies previously present. Only in 1957 was the proportion of “other” weedy species much
greater than in I951 when Kla- math weed was abundant. This abundance of other weeds in 1957 is partially due to the fact that the quadrats at the 3-mile zone were no longer present, and that location had been more typi- cal range with a better class of forage developing there. Hence, of the remaining three zones, only one was in fairly open, typi- cal range, the other two being shaded and less suitable to good range species such as soft chess and filaree (Erodium spp.). In spite of this, there was only a minor increase in other weeds,
and the pattern has not been one of increasing claim by pernicious species. For example, ripgut brome,, the predominant among the weedy species, had the same coverage when Klamath weed was abundant as later. Also, it is questionably placed as a weed, as it is good forage when young and is controlled by moderate grazing.
The serious weed, medusa head, (Elymus cup&-medusae), occupied a small area adjacent to one of the quadrats since 1953, but it spread very slowly and hardly disturbingly at this loca- tion. The same situation has ex- isted for 7 years near one of the study areas in Humboldt County.
Also, yellow starthistle (Cen- tuureu solstitiulis) came in with the reduction of Klamath weed at this location. Here it was favored by an oak leaf cover which hindered germination and establishment of good forage spe- cies less than it did the thistle, which is a summer annual and germinates after substantial de- composition of the leaves, This thistle remained low in abund- ance but did reach a level of 4 percent in 1957. Seedlings of tar- weed (Mudiu glomerutu) were also of variable occurrence. Bracken fern (Pteridium uquili- num) and sonoma salvia (Salvia sonomensis) are perennials which increased slightly in spots where they had been pres-
ent, even when Klamath weed was abundant.
Forage grasses, legumes and forbs claimed the major part of the space vacated (Figures 2 and 3). By 1954, the grasses reached the level previously occupied by Klamath weed, and yielded some of that predominance in 1955, 1956, and 1957, mainly to species of legumes and forbs. The years 1954 and 1957 were comparative- ly good “legume years,” while 1955 and 1956, on the other hand, were favorable years for filaree
(Erodium cicuturium). The pat- tern of total forage species was 22.0, 30.9, 50.1, 70.1, 64.6, 59.5 and 64.5 percent, respectively, and 1951 through 1957 (Table 1). The total for all forage species was highest in 1954, and slightly less in 1955 and 1957. The amount of bare ground has been quite vari- able and it is caused by many factors - excessive litter, rocks, hoof disturbances, manure chips, rodent action, or vehicle disturb- ance.
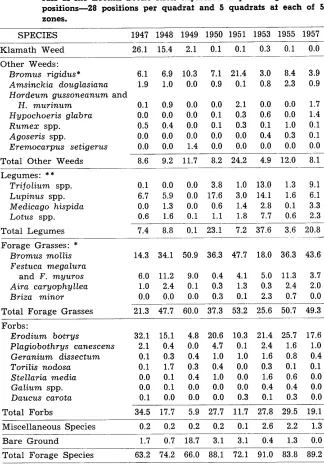
Vegetation af fhe Fort Seward Site. Humboldt County
Table 2 and Figure 3 show the changes in vegetation for this site from 1947 through 1957. In 1946, the year the beetles were introduced, this site had Kla- math weed uniformly as the principal dominant, but the plants were sufficiently spread so that grasses and forbs, collec- tively, shared about equally with it in total predominance at the micro-positions. By 1948, the beetles had reduced the density of the weed in one of the sam- pled zones (Huffaker, 1951), and thus its general abundance was reduced to 22.5 percent, with a corresponding increase in total forage species. By 1949, the weed was further reduced to 15.6 per- cent, and at no time since then has it attained dominance at any micro-position sampled; hence, the zero levels from 1950 through 1957.
Total forage associated with the control at this location has
74
Table 2.
C. B. HUFFAKER AND C. E. KENNETT
Dominance of range plant species af micro-ploi positions in quad- rats af fhe Fort Seward beetle sites, expressed as percentages ot total positions-28 positions per quadraf and 7 quadrats at each of 4 zones.
SPECIES -_ 1947 1948 1949 1950 1951 1953 1955 1957
Klamath Weed 36.6 22.5 15.6 0.0 ~- 0.0 0.0 0.0 0.0
Other Weeds:
Hypocholeris glabra 6.1 11.4 7.6 3.2 13.6 1.3 6.6 2.2
Hordeum gussoneanum and
H. murinum 1.5 0.0 0.0 1.9 0.9 0.7 0.0 1.3
Bromus rigidus * 0.0 0.0 0.0 0.0 0.0 0.3 0.1 1.1
Agoseris spp. 0.0 1.2 0.0 1.7 0.0 1.4 0.4 0.1
Amsinckia douglasiana 0.0 0.3 0.0 0.8 0.0 0.5 0.1 0.1
Eremocarpus setigerus 0.0 0.0 0.0 0.1 0.4 0.1 0.0 0.1
Micropus spp. 0.5 0.1 0.1 0.1 0.0 0.0 0.0 0.1
Total Other Weeds 8.1 13.0 7.7 7.8 14.9 4.3 7.2 5.0 -
Legumes:
Lotus spp. 0.1 2.0 1.7 11.6 6.2 3.4 0.5 8.7
Trifolium spp. 2.3 6.4 0.0 17.4 1.9 8.3 0.4 5.6
Lupinus spp. 0.0 0.1 0.0 0.5 0.3 0.0 0.0 1.0
Total Legumes 2.4 8.5 1.7 29.5 8.4 11.7 0.9 15.3
Forage Grasses: *
Bromus mollis 14.8 6.4 34.1 20.3 23.7 29.7 44.1 23.5
Danthonia californica 2.9 0.5 2.8 1.6 3.1 0.4 5.9 9.2
Aira caryophyllea 4.8 3.8 10.3 3.9 3.2 14.3 2.3 11.1
Avena fatua 4.7 1.7 0.8 0.6 2.7 4.2 2.7 2.9
Festuca megalura &
F. myurols 2.3 1.0 2.4 0.6 1.0 3.0 4.6 0.9
Briza minor 0.1 1.9 0.0 3.6 0.5 7.0 0.7 0.3
E lymus glaucus 0.0 1.0 0.4 0.8 0.4 0.3 0.4 0.4
Total Forage Grasses 29.6 16.3 50.8 31.4 34.6 58.9 60.7 48.3 Forbs:
Erodium spp.
chiefly botrys 9.9 21.0 11.7 11.8 28.0 13.2 27.4 20.1
Plagiobothrys canescens 0.3 0.9 0.0 0.8 2.4 0.4 0.4 4.4
Linanthus bicolor 0.1 3.3 0.3 0.8 1.0 1.0 0.3 2.6
Geranium dissectum and
G. molle 0.5 1.4 1.3 3.6 2.8 3.0 1.0 2.1
Baeria chrysostoma* * 0.6 3.8 0.7 2.7 2.4 5.1 0.7 1.4
Galium spp. 0.0 0.1 0.5 1.3 0.1 0.1 0.1 0.3
Stelluria media 0.0 0.0 0.0 0.6 0.3 0.3 0.3 0.1
Ranunculus spp. 0.0 0.6 1.2 0.3 0.0 0.0 0.1 0.3
Orthocarpus, Cordylanthus,
Cas$lleia 0.8 2.2 0.1 2.3 -_ 0.3 0.1 0.1 1.1
Total Forbs 12.2 33.3 15.8 24.2 37.3 23.2 30.4 32.4
Miscellaneous Species 1.5 0.7 1.3 2.0 2.0 1.3 0.6 ___- 0.3
Bare Ground 9.7 5.6 7.4 5.1 2.8 0.3 0.7 0.4
Total Forage Species 44.2 58.1 68.3 85.1- 80.3 93.8 92.0 96.0 * Bromus rigidus is questionably placed as a weed (see
note, Table 1).
** Although this species is conspicuous because of its relatively large andshowy flowers, it has not been classed as noxious. Also, it was
a char-
acteristic component of the climaxSince it is also grazed, it is classed V vegetation, having evolved with it. vith the forbs.
been very good. Subsequent to
complete control of the weed,
only during 1951 did total forage
fall below 85 percent, and dur-
ing
the years of the last three
samplings, the levels were over
90 percent-96 percent in 1957.
The lower level in 1951 was due
to an increase in a single weedy
species, hawkbit (Hypochoeris
glabra), which forms a tight
winter rosette effectively reduc-
ing competition when conditions
for its germination give it ad-
vantage.
One species may compensate
for the low importance of an-
other, and of course this may
apply to a weed or a forage spe-
cies. Fortunately, the compensa-
tion experienced was usually be-
tween grasses, forbs, and le-
gumes of some forage value. In
1950 and 1951, the grasses in-
creased very little over their
status when Klamath weed was
abundant, but during 1950 the le-
gumes were at their greatest de-
velopment at 29.5 percent, while
in 1951 filaree (Erodium botrys)
reached its highest density. The
lower level of the forage grasses
in 1957 is compensated by a high
level of legumes at 15.3 percent,
and a good level of forbs, mainly
filaree, at 32.4 percent.
An attempt to correlate years
of abundance of certain of the
annual species with meteorlogi-
cal data was not fruitful.
P- - -e- - - a a0 FORT SEWARD ,.- T, _- H
/ / = 60 .’ w z 40 /’ ”
20 -b_ w 0 0 *
c
a
.- -c 4* &- _ _ -_O-___-+--__e
LOFTUS 80
_! 1947 1948 IQ49 1950 1951 I952 1953 1954 1955 IQ56 IQ57
KLAMATH WfED FOft4.x SPLCIES OTHER WttOS . F--.
Frcurt3. Char& ii cover of Klamath weed, other weeds, and forage species from 1947 through 1957 associated with continuous control of Klamath weed by beetles at the Loomis, Fort Seward, Blocks- burg, and Loftus sites.
Only two perennial grasses were dominant at any time. These were California oatgrass (Danthonia caZifornica), the dominant climax species of this region, and blue wildrye (Ely- mus gluucus) the latter of only minor but stable occurrence. The changes in California oat- grass were encouraging. Before 1955, it occurred sparingly on this range. It existed in the quadrats only at the center zone. In such areas where it was initi- ally present, it has greatly in- creased during the past ten years.
Not only has it increased where it originally occurred, but it has appeared within the past three years in other quadrats representing three of the four distance zones. Other data (see “Blocksburg site” and “Ten-Mile Sequence Quadrats”) show that once established
in a local area,
it may increase moderately fast if conditions are favorable. Sub- sequent to Klamath weed re- moval, no noxious species has shown consistent inroads. 0,nly hawkbit amounted to anything, and it only in 1951.
Vegetation af fhe Blocksburg Sife, Humboldt Counfy
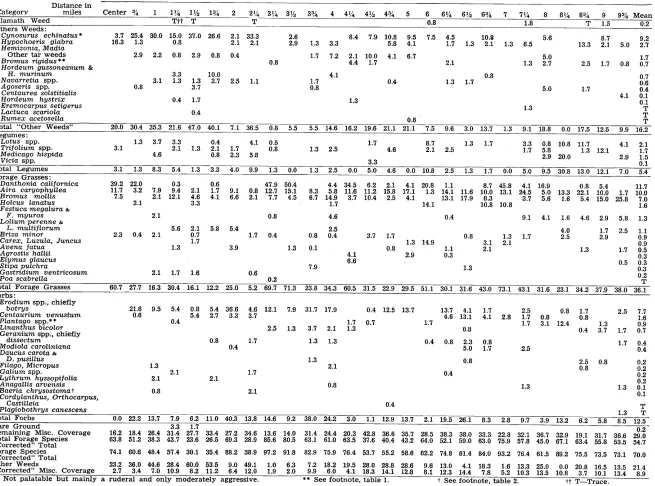
In 1946, when the beetles were introduced, and in 1947 prior to much beetle activity, this range was a solid stand of dense Kla- math weed. The dominance shown in Table 3 and Figure 3 for 1947 illustrates the degree to which the importance of Kla- math weed is compromised by the method of sampling, which favors minor substrata1 associ- ates present in the inter-spaces. Pictures taken at this location
(Figure 4) show the denseness of the weed. In June or July, it characteristically attained sole dominance and almost complete coverage, although in Table 3 it is listed at only 57.6 percent in 1947. This is because the sam- ples were taken in May prior to its attainment of full dominance. This was in one sense desirable, since such sampling gave a meas- ure of the substrata1 associates, many of which assumed greater importance upon removal of the weed; but it constitutes an “under-rating” of the former im- portance of the weed, which is inherent to the method of sam- pling.
Considering the denseness of the weed formerly, and noting from Table 3 that by 1949 it was not present at any micro-posi- tion, and only in 1955 did it re- appear at a 0.1 percent level, the perfection in control is obvious. Forage species increased mark- edly, including return of the cli- max bunchgrass, California oat- grass (Huffaker, 1951). The data demonstrate that at such loca- tions oatgrass may steadily in- crease once established in local areas, and at the same time spread more slowly to greater distances. It occurred at only
9.2 percent when Klamath weed was dominant in 1947, mainly in wet areas and along cattle paths. It increased to 22.7 percent in 1949, the year the weed was re- moved, and, subsequently, to 23.4, 28.9, 30.3, 52.6 and 45.0 per- cent, respectively, for 1950-51- 53-55-57. The differences be- tween 1955 and 1957 are prob- ably due to phase of growth and variable robustness of associated plants and do not necessarily mean its actual disappearance anywhere. It is not yet as com- pletely dominant as was Klam- ath weed initially, but it is the principal species, and still in- creasing.
Aside from California oat- grass, the increase in other for- age grasses was at first sub- stantial, but these have given way somewhat to oatgrass, and, during 1951, to hawkbit, which reached a level of 40 percent that year. Here, hawkbit is commonly present and if unfavorability exists for more robust plants, it fills in the void; but it has not shown persistent aggressiveness or dominance generally. Soft chess was the dominant annual grass, but silver hairgrass was about equal with it. Two other perennial grasses were present, Halls bentgrass (Agrostis hullii) and Pacific panicum (Panicurn pacificurn), but neither was ag- gressive during this study.
Total forage was fairly high, but depressed somewhat by the prevalence of hawkbit, particu- larly in 1951. Total forage was dominated by the grasses, but legumes contributed 12.4 percent in 1953 and lesser amounts dur- ing other years. Total forbs were commonly low in importance, never exceeding 9 percent and usually at 7 or 8 percent, with Plantago spp. slightly surpassing others.
Vegetation af Loomis Site, Placer Couniy
76 C. B. HUFFAKER AND C. E. KENNETT
Table 3. Dominance of range plant species af micro-plot positions in quad- rats at fhe Blocksburg beetle sites, expressed as percentages of iota1 positions-28 positions per quadraf and 7 quadrafs af each of 4 zones.
-_____
SPECIES 1947 1948 1949 1950 1951 1953 1955 1957
Klamath Weed 57.6 31.1 0.0 0.0 0.0 0.0 0.1 0.0
Other Weeds:
Hypochoeris glabra 12.9 15.4 11.7 18.8 39.9 9.4 3.4 12.5 Cynosurus echinatus 0.0 0.0 0.0 0.0 0.9 5.0 4.7 5.0 Agoseris spp. 0.0 0.0 0.0 0.1 0.0 0.4 1.9 0.6
Bromus rigidus * 0.0 0.0 0.4 0.8 0.3 0.3 0.3 0.1
Rumex spp. 0.4 0.4 1.5 1.0 0.4 0.3 0.4 0.0
Eremocarpus setigerus 0.0 0.0 0.0 0.0 0.0 0.1 0.3 0.0
Total Other Weeds 13.3 15.8 13.6 20.7 41.5 15.5 11.0 18.2 Legumes :
Trifolium spp. 0.8 0.8 0.1 2.9 0.9 8.0 0.6 4.5
Lotus spp. 0.0 0.9 0.8 2.3 2.2 4.3 0.5 1.4
Lupinus spp. 0.0 0.0 0.0 0.0 0.0 0.1 0.0 0.0
Total Legumes -0.8 1.7 0.9 5.2 3.1 12.4 1.1 5.9
Forage Grasses:
Danthonia californica 9.2 13.3 22.7 23.4 28.9 30.3 52.6 45.0
Bromus mollis 4.9 10.1 18.5 16.2 7.9 8.2 5.6 8.5
Aira caryophyllea 5.9 3.7 23.6 7.1 6.5 14.6 17.9 7.9
Briza minor 0.0 4.3 0.3 2.8 2.4 9.3 1.5 3.1
Avena fatua 0.0 0.0 0.0 0.0 1.7 0.5 0.1 0.4
Agrostis hallii 0.5 1.5 2.3 1.1 0.0 0.0 0.1 0.3
Panicum pacificum 0.7 0.3 0.4 0.3 0.3 0.8 0.5 0.0
Total Forage Grasses 21.2 33.2 67.8 50.9 47.7 63.7 78.3 65.2-
Forbs:
Plantago spp. * *
chiefly Zanceolata 1.7 2.4 0.7 0.5 2.5 2.4 2.5 2.8 Orthocarpus, Cordylanthus,
Castilleia 0.1 0.3 0.0 0.4 0.9 0.5 0.6 1.9
Sisyrinchium bellum,
Brodiaea spp. 0.0 0.0 1.4 1.2 0.4 0.1 2.3 1.0
Filago gallica 0.0 0.4 0.2 0.2 0.1 1.5 0.0 1.1
Linanthus bicolor 0.3 0.7 0.0 0.1 0.0 0.4 0.3 0.3
Ranunculus spp. 0.0 0.1 0.4 0.3 0.3 0.3 0.1 0.1
Luzula, Juncus, sedges 0.0 0.4 1.3 0.9 0.0 0.1 0.7 0.6
Daucus carota 0.5 0.1 1.2 0.0 0.0 0.3 0.1 0.5
Chlorogalum pomeridianum 0.3 0.4 0.3 0.4 0.0 0.1 0.5 0.3
Galium spp. 0.1 0.3 2.1 3.6 0.8 1.1 0.5 0.0
Prunella vulgaris 0.4 0.4 0.5 0.5 0.5 0.3 0.4 0.0
Geranium dissectum 0.3 0.1 0.1 0.7 0.3 0.4 0.0 0.0
Total Forbs 3.7 5.6 8.2 8.8 5.8 -_____ 7.5 8.0 8.6 Miscellaneous Species 0.4 0.6 0.7 2.1 _____ 0.3 0.6 0.5 ___. 2.0 Bare Ground 3.5 12.4 8.8 12.8 1.7 0.1 0.8 0.5
Total Forage Species 25.7 40.5 76.9 64.9 56.6 83.6 87.4 79.7
* Bromus rigidus is questionably placed as a weed (see note, Table 1). * * Thornber (1910) classed some plantains very important as forage.
distribution of Klamath weed, for example. Although
again an
but in those areas where it oc- underestimate of reality, the curred, heavy growth of plants weed in 1947 prior to injury by up to 4 feet in height was char- beetles, is shown at 26.1 percent. acteristic, but these were not so This is partly because the zones close together as at Blocksburg, and quadrats were laid out with-out regard to the patches of weed and represented the open range, generally, as was so at each site. These robust plants of a “bunched” habit of growth have some years individually supported large numbers of beet- les, and yet a small percentage of the plants would partially re- cover following even fairly pro- longed defoliation, after the beetles ceased feeding and en- tered aestivation. Observations showed that specific plants in- variably succumbed the next year except in the one quadrat among the 28 which was shaded. Even in the open areas a few new plants appeared occasion- ally, sufficiently dispersed to es- cape destruction until after their maturity and seeding, but a shifting sequence in time and place at a low density of weeds and beetles was characteristic.
This example is intermediate between the Loftus site on the one hand and the Fort Seward and Blocksburg sites on the other, but with the economic re- sult much closer to the latter. Economically, it is of little mo- ment that the weed persisted at 0.1 to 0.3 percent representation.
Ripgut brome was the only weedy species of importance, al- though fiddleneck (Amsinckia douglasiana) occurred at about the one percent level in 1950, 1953 and 1957, and at 2.3 percent in 1955. This is about equal to the presence initially in 1947 and 1948 of both species, except that in 1951 ripgut brome was about three times as important as com- monly.
Ripgut brome is much inferior to soft chess, but it is doubtfully considered a weed on such ranges, although in other situa- tions it may be highly objection- able and aggressive. It rarely at- tains importance and seems to yield readily to better forage on moderately grazed ranges, Its foliage is readily taken by live- stock until the long-awned, barbed seed heads form.
CONTROL OF KLAMATH WEED BY BEETLES 77
Table 4. Dominance of range plant species af micro-plot positions in quad- rats at the Loomis beetle sites, expressed as percentages of total positions-28 positions per quadraf and 5 quadrats af each of 5 zones.
SPECIES 1947 1948 1949 1950 1951 1953 1955 1957
Klamath Weed 26.1 15.4 2.1 0.1 0.1 0.3 0.1 0.0
Other Weeds:
Bromus rigidus * 6.1 6.9 10.3 7.1 21.4 3.0 8.4 3.9
Amsinckia douglasiana 1.9 1.0 0.0 0.9 0.1 0.8 2.3 0.9
Hordeum gussoneanum and
H. murinum 0.1 0.9 0.0 0.0 2.1 0.0 0.0 1.7
Hypochoeris glabra 0.0 0.0 0.0 0.1 0.3 0.6 0.0 1.4
Rumex spp. 0.5 0.4 0.0 0.1 0.3 0.1 1.0 0.1
Agoseris spp. 0.0 0.0 0.0 0.0 0.0 0.4 0.3 0.1
Eremocarpus setigerus 0.0 0.0 1.4 0.0 0.0 0.0 0.0 0.0
Total Other Weeds 8.6 9.2 11.7 8.2 24.2 4.9 12.0 8.1
Legumes: * *
Trifolium spp. 0.1 0.0 0.0 3.8 1.0 13.0 1.3 9.1
Lupinus spp. 6.7 5.9 0.0 17.6 3.0 14.1 1.6 6.1
Medicago hispida 0.0 1.3 0.0 0.6 1.4 2.8 0.1 3.3
Lotus spp. 0.6 1.6 0.1 1.1 1.8 7.7 0.6 2.3
‘Total Legumes 7.4 8.8 0.1 23.1 7.2 37.6 3.6 20.8
Forage Grasses: *
Bromus mollis 14.3 34.1 50.9 36.3 47.7 18.0 36.3 43.6
Festuca megalura
and F. myuros 6.0 11.2 9.0 0.4 4.1 5.0 11.3 3.7
Aira caryophyllea 1.0 2.4 0.1 0.3 1.3 0.3 2.4 2.0
Briza minor 0.0 0.0 0.0 0.3 0.1 2.3 0.7 0.0
Total Forage Grasses -21.3 47.7 60.0 37.3 53.2 25.6 50.7 49.3 Forbs:
Erodium botrys 32.1 15.1 4.8 20.6 10.3 21.4 25.7 17.6
Plagiobothrys canescens 2.1 0.4 0.0 4.7 0.1 2.4 1.6 1.0
Geranium dissectum 0.1 0.3 0.4 1.0 1.0 1.6 0.8 0.4
Tori&s nodosa 0.1 1.7 0.3 0.4 0.0 0.3 0.1 0.1
Stellaria media 0.0 0.1 0.4 1.0 0.0 1.6 0.6 0.0
Galium spp. 0.0 0.1 0.0 0.0 0.0 0.4 0.4 0.0
Daucus carota 0.1 0.0 0.0 0.0 0.3 0.1 0.3 0.0
Total Forbs -34.5 17.7 5.9 27.7 11.7 27.8 29.5 19.1
Miscellaneous Species 0.2 0.2 0.2 0.2 0.1 2.6 2.2 1.3
_~
Bare Ground 1.7 0.7 18.7 3.1 3.1 0.4 1.3 0.0
Total Forage Species 63.2 74.2 66.0 88.1 72.1 91.0 83.8 89.2
* Bromus rigidus is questionably placed as a weed (see note, Table 1). * * All these legumes were considered beneficial (see note, Table 1).
proved in direct proportion to
the reduction in Klamath weed (Figure 3). Levels of forage from 72.1 percent in 1951 (low because of the high level of ripgut that year) to 91.0 percent in 1953 and 89.2 percent in 1957 were at- tained. The low level of 66.0 percent in 1949 was due mainly to an excessive amount of bare ground. This was caused by a very heavy mat of litter from the unusually vigorous growth
the previous year, which deter- red germination and prevented proper growth of seedlings.
Again, 1953 and 1957 were very favorable for- the annual legumes, these totalling 37.6 per- cent in 1953 and 20.8 percent in 1957. The fluctuating fortunes of the legumes, edible forbs and “other weeds,” mainly ripgut brome (of doubtful weedy sta- tus), caused the forage grasses to vary considerably year to
year, the scarcity of these during a given year being compensated by increases in legumes and f orbs.
Vegetation of the Ten-Mile Sequence Quadra&
The sites of this study were one-quarter mile apart, except where timber or other non-range land existed, and extended from the original beetle colony (1946 release) near Blocksburg to be- yond Alderpoint, Humboldt County. The 27 locations are rep- resentative of the range im- provement in the county result- ing from control of Klamath weed by beetles.
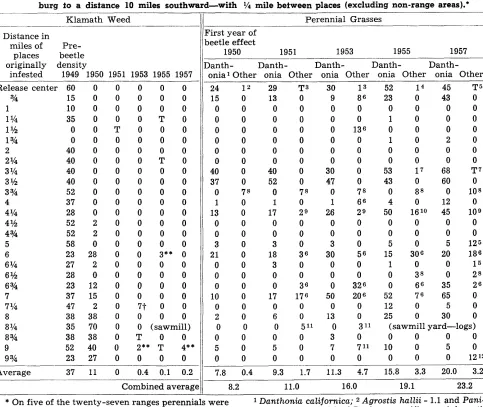
Table 5 presents the densities of Klamath weed both before control and subsequently through 1957, as well as densities of the perennial grasses. Of the 27 ranges randomly established, 25 were infested with Klamath weed at the beginning of the study. The average coverage by Klamath weed was 37 percent, and the infested fields varied from a low of 10 percent to a high of 60 _nercent. This included quadrats either too wet or too dry for this weed, as well as those on ideal slopes.
Control was complete at this site in the practical sense. By 1950 the beetles had controlled the weed within 5 miles from the release site. At some sites beyond that distance the weed increased in importance. There were other scattered areas more distant which had been control- led by secondary, disjunct col- onies of beetles; and there were still other areas where there was little change in the importance of the weed that year. The aver- age density was about 10 percent. In 1951 beetle action was deci- sive. At only one micro-area was any Klamath weed dominant, and it was recorded there as a trace.
78 C. B. HUFFAKER AND C. E. KENNETT .
numbers, Only in the shaded or disturbed soil areas did the weed establish itself beyond the posi- tion of a trace. Its average im- portance for the years, 1951, 1953, 1955 and 1957 was less than 0.2 percent, compared with 37 percent originally.
Because of its importance among the perennials, California oatgrass is listed separately. Other perennials are recorded, but their identities are shown only by footnotes.
At only 12 of the 27 locations
were such perennials originally present. By 1957 or previously, at 22 of the 27 locations peren- nials were to some degree locally dominant. The average combined importance of all species of these desirable perennials was low, at 8.2 percent, initially in 1950, and increased to 11.0, 16.0, 19.1, and 23.2 percent for the years 1951, 1953, 1955 and 1957, respectively.
Of this increase, California oatgrass was the major contribu- tant. It had a density of 7.8 per- cent in 1950, 9.3 in 1951, 11.3 in
1953, 15.8 in 1955, and 20.0 per- cent in 1957-still only 2% times its original abundance generally. However, on some ranges its progress was very promising, and this was generally associated with favorable grazing manage- ment (see also Murphy, et al., 1954). Where this perennial was present in 1950 but at a low level due, among other things, to com- petition by Klamath weed, it in- creased rapidly with beetle con- trol of the weedy competitor. At the 4-mile distance, it was then
Table 5. Change in perceniage composition of Klamafh weed and desirable perennial grasses coincident wifh biological control of Klamafh weed on 27 ranges in a series from fhe beetle release center near Blocks- burg io a distance 10 miles southward-with ‘/4 mile between places (excluding non-range areas).”
-___
Klamath Weed --
Distance in miles of Pre-
places beetle originally density
infested 1949 1950 1951 1953 1955 1957 Release center 60 0
3/4 15 0
1 10 0
1 ?kI 35 0
1% 0 0
1% 0 0
2 40 0
2% 40 0
3% 40 0
3% 40 0
3% 52 0
4 37 0
4% 28 0
4% 52 2
4% 52 2
5 58 0
6 23 28
6% 27 2
6% 28 0
6% 23 12
7 37 15
7% 47 2
8 38 38
8% 35 70
83/4 38 38
9 52 40
9% 23 27
-
Average 37 11 0 0.4 0.1 0.2 7.8 0.4 9.3 1.7 11.3 4.7 15.8 3.3 20.0 3.2
0 0 0 0 T 0 0 0 0 0 0 0 0 0 0 0 0 0 0 0 0 0 0 0 0 0 0
0 0 0
0 0 0
0 0 0
0 T 0
0 0 0
0 0 0
0 0 0
0 T 0
0 0 0
0 0 0
0 0 0
0 0 0
0 0 0
0 0 0
0 0 0
0 0 0
0 3** 0
0 0 0
0 0 0
0 0 0
0 0 0
7Jf 0 0
0 0 0
0 (sawmill)
T 0 0
2** T 4**
0 0 0
Combined average 8.2 11.0 16.0 19.1 23.2
* On five of the twenty-seven ranges perennials were 1 Danthonia calijornica; 2 Agrostis hallii - 1.1 and Pani-
never sampled. cum pacijicum - 0.3; 3 Panicum pacijicum; 4 Agrostis
* * Marshy area and/or partially shaded. hallii - iii; 6 Holcus 0.1 and Zanatus; 7 Panicum pacijicum - 0.5; 5 Agrostis hal- Poa scabrslla; 8 Stipa pulchra;
24 12 29
15 0 13
0 0 0
0 0 0
0 0 0
0 0 0
0 0 0
0 0 0
40 0 40
37 0 52
0 7s 0
1 0 1
13 0 17
0 0 0
0 0 0
3 0 3
21 0 18
0 0 3
0 0 0
0 0 0
10 0 17
0 0 0
2 0 6
0 0 0
0 0 0
5 0 5
0 0 0
T3 0 0 0 0 0 0 0 0 0 78 0 29 0 0 0 36 0 0 36 176 0 0 30 9 0 0 0 0 0 0 30 47 0 1 26 0 0 3 30 0 0 0 50 0 13
511 0
0 3
0 7
0 0
13 86 0 0 13s 0 0 0 0 0 7s 6s 29 0 0 0 56 0 0 326 206 0 0 31’ 0 711 0
52 14 45 T5
23 0 43 0
0 0 0 0
1 0 0 0
0 0 0 0
1 0 2 0
0 0 0 0
0 0 0 0
53 17 68 T7
43 0 60 0
0 88 0 10s
4 0 12 0
50 1610 45 109
0 0 0 0
0 0 0 0
5 0 5 125
15 30s 20 186
1 0 0 15
0 3s 0 2s
0 66 35 2s
52 76 65 0
12 0 5 0
25 0 30 0
(sawmill yard-logs)
0 0 0 0
10 0 5 0
0 0 0 12 12
- Perennial Grasses _____
First year of beetle effect
1950 1951 1953 1955 1957
3anth- Danth- Danth- Danth- Danth-
onial Other onia Other onia Other onia Other onia Other
t Seedlings on disturbed area. T-Trace.
present at the 1 percent level. By 1955 it had crept up to 4 per- cent, and by 1957 to 12 percent- a twelve fold increase. At the 4y4 mile distance a threefold in- crease occurred during that pe- riod; at the ‘I-mile distance, an increase from 10 percent in 1950 to 65 percent in 1957; and at the 8-mile distance, from 2 to 30 per- cent. At a few locations there was a very minor increase.
The perennials have thus come to dominate the vegetative pic- ture on a portion of these ranges, but they remain at low levels on others. The results suggest that the maximal improvement could be accomplished in this region, to the decided advantage of the rancher, if proper developmental management w e r e employed. The data also suggest that many ranchers are not apt to utilize the necessary caution in degree and timing of grazing.
Table 6 presents the data for all plants, but the post-control years are averaged. Since the perennial Klamath weed and the perennial grasses were presented by years (Table 5), and since an- nuals vary greatly from year to year, the loss is not great.
Since in each quadrat the method was to record coverage of only the three dominant spec- ies, there was for each quadrat a residue of other occupants. This residue was, in quadrat “B,” for example, not necessar- ily distinct from the species which were dominant in quadrat “A.” If the “other weeds” con- stitute a given percentage among the 3 dominants of respective quadrats, presumally they would constitute an approxi- mately equal percentage among the aggregate residue of plants not represented by the 3 dom- inants in the respective quad- rats. Thus, as “corrected” val- ues, the aggregate of residue is prorated to the range types, aug- menting those values to a closer approximation than is revealed by the “uncorrected” figures. This technique is not applied by
species, so it must be remem- bered that the percentage figures for each species are lower than they should be. This “correc- tion” is not entirely logical in all respects, but the plus and minus errors tend to cancel out the re- sults being considered closer ap- proximations of the weedy cate- gory compared with the forage catagories.
The unaltered figures for “other weeds” varied from zero at the 8% mile distance to 47.0 percent at the 1% mile distance, with the moderately noxious dogtail, or winter annual grass (Cynosurus e&in&us) far sur- passing at most locations the sec- ond most abundant weedy spe- cies, hawkbit. The value for dog- tail was 9.2 percent, and the total for all weeds was 16.2 percent, with hawkbit contributing 2.7 percent. Specialists do not con- sider either dogtail or hawkbit serious range weeds. The grass is grazed some when young, and it heads and dries later than some of the other more palatable forage such as soft chess, cheat- grass (Bomus tectorum) , ripgut brome, the foxtail grasses (Hor- deum gussoneanum and H. mur- inum) the spiny Navarretia spp., and the tarweeds, collectively, constituted the bulk of the weedy species. It is worth noting that in this region, studied for ten years, medusa head was not recorded.
The more adequate “correc- ted” figures for “other weeds” varied from zero to 60 percent, the latter as before, at the 1% mile distance under heavy graz- ing by sheep. The average “cor- rected” figure for weedy species was 21.4 percent, and since more than half of this was by the less serious and partially utilized dogtail, this figure is not so dis- couraging.
The total forage was also “cor- rected.” The two “corrections” presumably involve errors un- prejudiced in either direction. There was a marked improve-
ment after control of Klamath weed. Areas that originally had dense stands of the weed were largely lost to cattle grazing and could be brought back by sheep grazing only slowly, and often to the detriment of range condi- tion. The 37 Percent coverage by the weed initially is considered a de-emphasis of the standing of Klamath weed, as an estimate of its harmfulness to the ranchers’ interest in this area at that time (Figure 4). Other weeds which increased slightly since the re- moval of Klamath weed are not of comparable aggressiveness, persistence, or toxicity. Also, this increase was no more than an approximate sharing of the va- cated space with the forage spe- cies according to each group’s respective composition on the range before Klamath weed was brought under control.
Table 6. Average perenfage composfi~n by forage specks and weeds on twenty-seven ranges subsequent to removal of Klamafh weed by beetles lgsl-lg57.
Distance in
Category miles Center ?h l 1?/4 l?/2 1% 2 2?/4 3514 3$/2 33,h 4 4;& 4;/2 43/h 5 6 6?‘4 6)s 6gi 7 7” 8 g
Klamath Weed ;:8
8$/4 83’ /4
Ttt T T 0.8 T 1.5 9% Mean 0.2
Others Weeds : ~_
Cynosurus echinatus * 3.7 25.4 30.0 15.0 37.0 26.6 2.1 33.3
Hypochoeris glabra 16.3
2.6 8.4 7.9
1.3
10.8 9.5
0.8
7.5 4.5
10.8
2.1 2.1 5.6
Hemizonia, Madia 2.9 1.3 3.3 5.8 4.1 1.7 1.3 2.1 1.3 6.5 13.3 5:: 5.0 ;:;
Other tar weeds 2.9 2.2 0.8 2.9 0.8 0.4 1.7
Bromus rigidus * *
7.2 2.1 10.0 4.1 6.7
0.8
Hordeum gussoneanum & 4.4 1.7 2.1 1.3 5:: 2.5 1.7 0.8 k::
H. murinum 3.3 10.0 4.1
Navarretia spp.
0.8
3.1 1.3 1.3 2.7 2.5 1.1
Agoseris Centaurea solstitialis spp. 0.8 3.7 i:X 0.4 1.3 1.7 5.0 1.7 8:;
Hordeum hystrix 0.4 1.7 4.1
Eremocarpus setigerus 1.3 002 011
Lactuca scariola 0.4 1.3
Rumex acetosella 0.8 ; T
Total “Other Weeds” 20.0 30.4 35.3 21.6 47.0 40.1 7.1 36.5 0.8 5.5 5.5 14.6 16.2 19.6 21.1 21.1 7.5 9.6 3.0 13.7 1.3 9.1 18.8 0.0 17.5 12.5 9.9 16.2
Legumes :
Lotus Trifolium spp. spp. 3.1 1.3 3.7 2.1 3.3 1.3 202 4.1 0.5 1.7 8.7 1.3 1.7
8:;
3.3 0.8 10.8 11.7 4.1 2.1
Medicago hispida
0.8 1.3 2.5
4.6 0:8
4.6 2.1
2.5 1.7 5.8
5.8 1.3 12.1
Vicia spp. 3.3 2.9 20.0 2.9 0:1 i-75
Total Legumes 3.1 1.3 8.3 5.4 1.3 3.3 4.0 9.9 1.3 0.0 1.3 2.5 0.0 5.0 4.6 0.0 10.8 2.5 1.3 1.7 0.0 5.0 9.5 30.8 13.0 12.1 7.0 5.4
Forage Grasses :
Danthonia calijornica 39.2 22.0
Aira caryophyllea 11.7 3.2 7.9 90s 2.1 0.6 ::: 9.1 47.9 50.4 4.4 34.5 6.2 2.1 4.1 20.8 1.1 8.7 45.8
Bromus mollis 7.5 2.1 12:1 Q:! 6.6 0.8 12.7 15.1 8.3 5.8 11.6 11.2 15.8 17.1 1.3 14.1 11.6 10.0 13.1 24.5 4.1 16.9 11.7
2.1 7.7 5.0 13.3
202.81
4.5 6.7 14.9 3.7
150.40
10.4 5:4 1.7
Holcus lanatus 2.5 4.1
10.0 13.1
2.1 17.9 8.3 3.7 5.6 1.6
Festuca megalura & 1.7
15:0
25.8 7.0
14.1 10.8 10.8 1.6
F. myuros 2.1 0.8
Lolium perenne & 4.6 0.4 9.1 4.1 1.6 4.6 2.9 5.8 1.3
L. multijlorum 5.6 2.1 5.8 5.4
Briza minor 2.3 0.4 2.1 0.7 1.7 0.4 0.8 :;:
3.7 ;:: ;:I 2.5 1.1
Carex, Luzula, Juncus 1.7 1.7 0.8 1.7
Avena fatua
1.3 14.9
1.3 3.9 f ::
1.3 0.1
Agrostis hallii 0.8 23::
t ::
1.3 1.7
Elymus glaucus 2.9 ::3’
8.: 0:5
Stipa pulchra
Gastridium ventricosum
Poa scabrella Total Forage Grasses
Forbs :
Erodium spp., chiefly botrys
Centaurium venustum
Plantago spp.* *
Linanthus bicolor
Geranium spp., chiefly
dissectum Modiola caroliniana Daucus carota &
7.9 0.5
2.1 1.7 1.6 0.6 1.3 013 :.:
0.2 0.2
T
60.7 27.7 16.3 30.4 16.1 12.2 25.0 5.2 69.7 71.3 23.8 34.3 60.5 31.5 22.9 29.5 51.1 30.1 31.6 43.0 73.1 43.1 31.6 23.1 34.2 37.9 38.0 36.1
21.6 0.6 9.5 5.4 0.8 5.4 2.7 5.4 36.6 3.3 4.6 12.1 3.7 7.9 31.7 17.9 0.4 12.5 13.7 13.7 4.1 1.7 2.5 0.8 1.7 2.5
0.4
4.6 13.1 4.1 7.7
2.8 1.7 0.8
1.7 0.7 1.7 0.8
1.7
2.5 1.3 3.7 2.1 1.3 0.8 3.1 12.4 0.4 31:; 1.7 017 :*t
0.8 0.4 1.7 1.3 1.3 0.4 0.8 2.3 0.8 1.7 0.4
5.0 1.7 2.5 0.4
D. pusillus 1.3
Filago, Micropus 1.3 2.1 0.8 0.8 0.2
Galium spp. 2.1 1.7
?i:5
Lythrum hyssopifolia 2.1 2.1 0.4 !I:;
Anagallis arvensis 0.8
Baeria chrysostoma t 0.8 2.1 1.3 1.3 00.:
Cordylanthus, Orthocarpus, 0:1
Castilleia 0.4
Plagiobothrys canescens 1.3 T T
Total Forbs 0.0 22.2 13.7 7.9 6.2 11.0 40.3 13.8 14.6 9.2 38.0 24.2 3.0 1.1 12.9 13.7 2.1 19.5 26.1 8.3 2.8 9.7 3.9 13.2 6.2 5.8
Bare Ground
8.5 12.5
Remaining Misc. Coverage 16.2 18.4 26.4 3;:: 2::: 33.4 27.2 34.6 13.6 14.0 31.4 24.4 20.3
Total Forage Species 63.8 51.2 38.3 43.7 23.6 26.5 69.3 28.9 42.8 36.6 35.7 28.5 38 3 38
85.6 80.5 63.1 61.0 63.5
“Corrected” Total 37.6 40.4 43.2 64.0 5211 59:0 0 63:0 33 3 22 75:9 8 57:8 32 1 45:0 36 7 67:l 329 63:4 19 1 55:8 31 7 36 5315 6 2z.E 54:7
Forage Species “Corrected” Total 74.1 60.6 48.4 57.4 30.1 35.4 88.2 38.9 97.2 91.8 82.9 75.9 76.4 53.7 55.2 58.6 82.2 74.8 81.4 84.0 93.2 76.4 61.5 89.2 75.5 73.5 73.1 70.0
Other Weeds 23.2 36.0 44.6 28.4 60.0 53.5 9.0 49.1 1.0 6.3 7.2 18.2 19.5 28.0
“Corrected” Misc. Coverage 2.7 3.4 7.0 10.9 8.2 11.2 6.4 12.0 1.9 2.0 9.9 6.0 4.1 28.8 28.6 9.6 13.0 4.1 18.3 1.6 13.3
18.3 14.1 12.8 8.1 12.3 14.4 7.8 5.2 10.3 13.5 10.8 25.0 0.0 20.8 3.7 10.1 16.5 13.5 21.4
the latter two plus Lotus spp., in Shasta and Placer Counties.
In general, increase of other
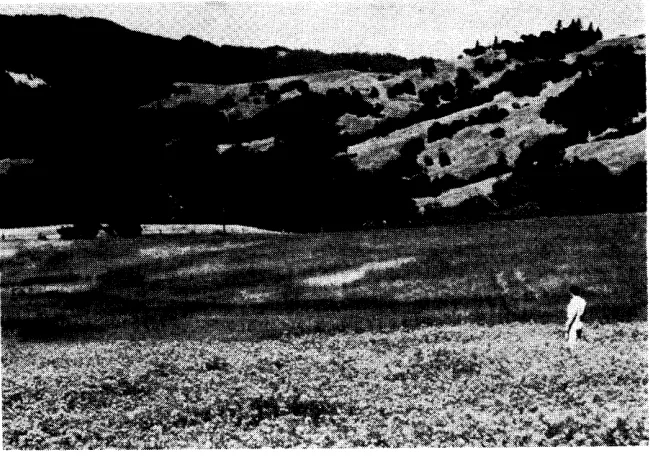
FIGURE 4. Panoramic view showing type of rangeland in the lo-mile sequence study originally infested with Klamath weed. The striking control of the weed by beetles is shown in the upper foreground, and the complete coverage of the weed at the flowering stage in the then uncontrolled area is shown in the immediate foreground. (Photograph by J. K. Hollowa~y, June 1949).
ium venusturn). Combined forbs, “uncorrected,” amounted to 12.5 percent.
Summary and Conclusions Klamath weed, prior to 1949, was estimated to infest 2% mil- lion acres of valuable range- land in northern California. The failure of other solutions prompted the late H. S. Smith to initiate biological control, a pro- gram he had discussed as early as 1928 with the late R. J. Till- yard of Australia. In 1947, a ten- year study was begun on control of this weed by imported beetles, primarily Chrysolina quadri- gemina (Rossi), relative to de- gree of control and range plant composition. The data show that a major improvement in the ranges resulted. Control was more effective than hoped for even by enthusiasts. The weed now exists at less than 1 percent of its former occurrence. There was concurrent marked increase in perennial grasses, chiefly California oatgrass in Humboldt County, and there and elsewhere the winter annuals-grasses.
weeds following decline of Klamath weed was minor; in many instances no increase at all. The main weeds in Hum- boldt County were dogtail and hawkbit, while ripgut brome was the predominant in Shasta and Placer Counties. None of these was a serious aggressor on these ranges. In Humboldt County dogtail and hawkbit are exten- sive in places, but they do not displace or dominate California oatgrass, which was the domi- nant single species in an area within 10 miles of the beetle re- lease site. Also, both are an- nuals and neither toxic nor per- nicious. Ripgut brome is highly objectionable in grain fields or abandoned areas, but it can be controlled by moderate grazing. It is grazed and of value prior to formation of the barbed seed legumes and forbs-of fair to heads.
good forage value claimed a ma- Medusa head is a serious jor portion of the space opened claimant, but in the extensive up by decline of Klamath weed. area represented by the Blocks- This low level of the weed con- burg, Fort Seward, Alderpoint stitutes no loss whatever, ex- region of southern Humboldt cept as it may occasion prema- County, formerly notorious for ture intervention to eradicate it its Klamath weed, it has made
locally. little inroad. It may or may not
There was good correlation in be significant, but in the equally the progress in beetle densities extensive region westward to- with control of Klamath weed ward Garberville, where the when the former were plotted in soils are more shallow and po- the immature rather than the rous and Klamath weed was mature stage-consistent with never a problem, medusa head an explanation of reciprocal den- has during the same period of sity-dependence in the two pop- time increased from a status of
ulations. rarity to one of continuousness