Some issues when using Fourier analysis for the extraction of
modal parameters
M. Lamb1 and V. Rouillard2
Victoria University, PO Box 14428 MCMC 8001, Melbourne, Australia
1[email protected], 2 [email protected]
Abstract. It is sometimes necessary to determine the manner in which structures deteriorate with respect to time; for instance when quantifying a material’s ability to withstand sustained dynamic loads. In such cases, it is well established that loss of structural integrity is reflected by variations in modal characteristics such as stiffness. This paper addresses some practical limitations of Fourier analysis with respect to temporal resolution and the uncertainties associated with extracting variations in modal parameters. The statistical analysis of numerous numerical experiments shows how techniques, such as data overlapping and zero-padding, can be used to improve the sensitivity of modal parameter extraction.
Keywords: frequency response, health monitoring, modal parameters, random vibrations.
1. Introduction
With the various parameters and spectral enhancement techniques used to obtain modal parameter estimates via Fourier analysis, it is important to evaluate their influence on the variability of the estimates obtained. This evaluation will assist analysts with the development of optimal modal parameter extraction procedures, which is particularly important in situations where modal estimates need to be obtained in the least possible amount of time. These situations include applications such as continuous structural health monitoring, which requires sensitivity in both the temporal and frequency domains.
2. Modal Parameter Estimation
The dynamic characteristics of all stable physical systems can be described using their frequency response function (FRF). The FRF of a system represents the complex ratio of output/response to input/excitation in the frequency domain. The most common application of FRFs is in modal analysis where they are used to extract the global properties of mechanical systems, namely their damping ratios and natural frequencies (the mode shapes of mechanical systems are also defined by the residuals of their FRF). Such modal parameter extraction requires the experimental frequency response to be fitted with an appropriate theoretical model which can, in turn, be used to extract the required modal properties. A number of modal parameter extraction techniques exist. For single degree-of-freedom (SDoF) systems, Ewins [1] recommends a technique based on fitting a circle to the Nyquist plot. Another technique uses least squares regression on the magnitude of the FRF in the region of resonance [2]. Garcia-Romeu-Martinez et al. [3], and later Rouillard et al. [4], showed that, for physical SDoF systems, the least squares regression technique is particularly robust. Based on the successful, practical, application of the least squares technique by Garcia-Romeu-Martinez et al., it will be used as the basis for analysis in the remaining sections.
3. Experimental Design
The research presented in this paper addresses the behaviour of linear, viscously damped, SDoF systems in a moving base configuration [3]. The systems were analysed using their acceleration excitation and response signals.
Excitation for the SDoF systems was synthesized using a band-limited spectral function (magnitude) coupled with a uniformly-distributed phase spectrum to form a complex spectrum. The inverse Fourier transform of the complex spectrum was then taken to produce a Gaussian random signal. This process was undertaken repeatedly to produce a random signal of arbitrary duration and spectral content. This random signal was later uploaded into a simulation tool developed using the Simulink® package in Matlab® which uses incremental analysis to solve the SDoF equation of motion [5].
Post-processing was achieved using the modified, short-time Fourier transform (STFT) based Welch method described by Rouillard et al. [4] in conjunction with the least squares regression curve- fitting procedure, described in the same article. This technique allows for the addition of zero-padding, spectral averaging overlap (individual FRF window overlap) and changes to the analysis sub-record length (window length), all of which are often manipulated in an attempt to improve spectral estimates.
4. Influence of Spectral Averaging and Sub-record Length
Spectral estimation using random signals requires some degree of averaging to minimise statistical uncertainty. However, in many applications, the time available to capture data is limited, thus restricting the amount of data available for averaging. This limited window means that a compromise needs to be made between the number of spectral averages and the analysis sub-record length. For the purposes of modal parameter extraction it is unclear which is most important. Frequency resolution, hence the sub-record length, is important as it affects the sensitivity of the frequency estimates (although it is not the limiting factor in this instance as curve-fitting is applied). However, it is not clear how much spectral averaging can be compromised.
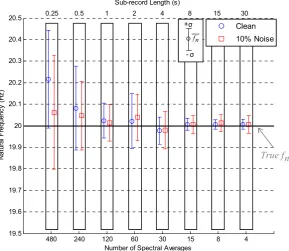
An initial set of experiments (experiment 1) was developed to evaluate the influence of various amounts of averaging, in conjunction with varying sub-record lengths (with the combination of the two varying parameters resulting in a constant analysis window size, or temporal resolution), on modal parameter extraction. The results gathered from experiment 1 (for excitation response signal pairs containing 0% and 10% extraneous noise respectively) are presented in Figure 1, as the mean natural frequency extracted from the 50 signal pairs along with error bars indicating ± one standard deviation. It must be noted that during experiment 1 no spectral overlapping or zero padding was applied.
The results from experiment 1 indicate that, for the purposes of modal parameter extraction, spectral resolution, hence sub-record length, has a more significant effect on the extracted natural frequencies than reduced spectral uncertainty via spectral averaging. This is made most evident by the small variability of the results obtained using the 30second sub-record, which provides fine spectral resolution (0.033Hz) but only allows for 4 spectral averages (50% theoretical uncertainty). This finding is attributed to the fact that spectral uncertainty only creates variability in the magnitude of frequency estimates, which, due to its random nature, has a limited effect when curve-fitting using
least squares regression. Conversely, coarse spectral resolution limits the amount of data available within the bandwidth appropriate for curve-fitting, thereby creating uncertainties in terms of both magnitude and spectral locality.
Figure 1: Experiment 1 – Spectral resolution and uncertainty.
0.25 0.5 1 2 4 8 15 30
Sub-record Length (s)
N
at
ur
al
F
reque
nc
y
(H
z)
480 240 120 60 30 15 8 4
19.5 19.6 19.7 19.8 19.9 20 20.1 20.2 20.3 20.4 20.5
Number of Spectral Averages
Clean 10% Noise
True fn fn
+σ
-σ
5. Influence of Zero-padding
Given the limited temporal data available to produce a frequency domain estimate of a system with time-varying modal properties, there is a need to obtain the required frequency domain information while consuming as little as possible temporal data. This minimised consumption of temporal data can only be achieved by improving the evaluation of spectral estimates with relatively coarse frequency resolution. This improved evaluation is often attempted by artificially refining the frequency resolution of the coarse spectrum using zero-padding. However, it is uncertain whether or not zero-padding actually helps. Most agree that zero-padding does not actually improve true frequency resolution; however, the majority of authors are unclear about what it does achieve [6, 7, 8, 9].
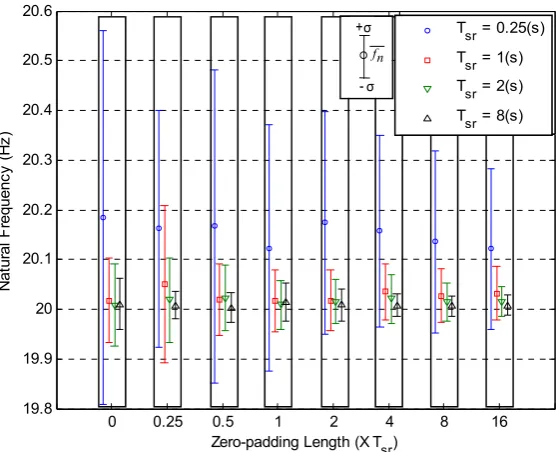
An attempt to determine whether or not zero-padding can improve modal parameter extraction from coarse frequency spectra was made by conducting a second set of experiments (experiment 2). The signals used in the previous experiment were again analysed using various sub-record lengths (Tsr) with various amounts of zero-padding and spectral averaging (where the number of spectral averages was proportional to the inverse of the sub-record length, which resulted in a constant temporal resolution for each of the sub-records analysed). The results for experiments with no extraneous noise are given in Figure 2 and those obtained from experiments containing 10% extraneous noise are given in Figure 3.
Figure 2: Experiment 2 –Influence of zero-padding on the estimation of natural frequency – uncontaminated data.
Figure 3: Experiment 2 - Influence of zero-padding on the estimation of natural frequency – data containing 10% noise.
0 0.25 0.5 1 2 4 8 16
19.8 19.9 20 20.1 20.2 20.3 20.4 20.5 20.6
Zero-padding Length (X Tsr)
N at ur al F req ue nc y (H z)
Tsr = 0.25(s)
Tsr = 1(s) Tsr = 2(s)
Tsr = 8(s)
fn
+σ
-σ
Tsr = 0.25(s)
Tsr = 1(s)
Tsr = 2(s)
Tsr = 8(s)
0 0.25 0.5 1 2 4 8 16
19.8 19.9 20 20.1 20.2 20.3 20.4 20.5 20.6
Zero-padding Length(X Tsr)
N at ur al F req ue nc y ( H z)
Tsr = 0.25(s)
Tsr = 1(s)
Tsr = 2(s)
Tsr = 8(s)
fn
+σ
-σ
Tsr = 0.25(s)
Tsr = 1(s)
Tsr = 2(s)
The results obtained from experiment 2 indicate that, for signals containing as much as 10% noise, the introduction of up to 16 times zero-padding significantly reduces the variability of the frequency estimates obtained using least squares regression modal parameter extraction, irrespective of the sub-record length used. The finding that the introduction of zeros will not degrade results is significant in that it enables analysts to apply zero-padding with confidence. In saying this it must also be noted that the value of zero-padding should not be overstated and that where possible increases in spectral resolution should always be obtained by increasing the analysis sub-record length.
The improvements obtained by implementing zero-padding are attributed to the fact that it provides estimates of results at otherwise non-described frequencies, which with the implementation of averaging, effectively increases the portion of data which describes the theoretical model of the FRF, without distorting its shape. This increased portion of data improves the ability to curve-fit the FRF magnitude spectra. This suggestion follows Semmlow’s [10] description of zero-padding: “Zero padding provides an interpolation of the points in the unpadded signal”.
6. Influence of Overlapped Averages
It is understood that overlapped spectral averaging can be used to retrieve the statistical stability lost due to windowing. Bendat & Piersol [11] state that if 50% overlap is used with the application of the Hanning window, approximately 90% of the stability lost, due to the window, can be retrieved. Randall [12] suggests that, for the Hanning window, overlaps of greater than 50% provide no appreciable improvement in statistical uncertainty. However, according to the formulation provided by Naidu [13], the variance within time-invariant spectra, captured using the Welch method, is inversely proportional to the number of overlapped spectral averages used. This formulation suggests that maximum overlap should always be applied.
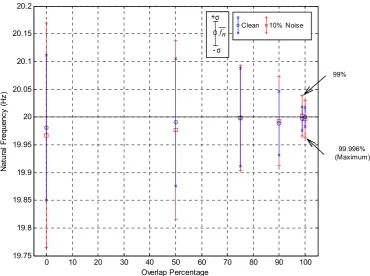
Overall, for the purposes of modal parameter extraction from time-varying systems it is uncertain if large amounts of spectral overlapping can be used to enhance results. Therefore, to gain a better understanding of the effect of overlapped spectral averaging, on modal parameter extraction, a third set of experiments (experiment 3) was undertaken. During experiment 3 varying amounts of averaging overlap (0% to 99.999%) were used in conjunction with the Tukey window [14] to analyse 50 constant parameter signal pairs. It is important to note that with the increased number of overlapped averages no temporal resolution was lost.
The results obtained from experiment 3, for a temporal resolution of 10 seconds (5 second sub-records, 2 independent averages and no zero-padding), are given in Figure 4. As can be seen, for signals containing as much as 10% noise, overlapped processing can generate a significant reduction in the level of variance in the extracted natural frequencies obtained using least squares regression modal parameter extraction.
99%
99.996% (Maximum)
0 10 20 30 40 50 60 70 80 90 100
19.75 19.8 19.85 19.9 19.95 20 20.05 20.1 20.15 20.2
Overlap Percentage
N
at
ur
al
F
requ
enc
y (
H
z)
Clean 10% Noise
fn
+σ
-σ
Figure 4: Experiment 3 - Influence of overlapping on the estimation of natural frequency. (Maximum represents the case where all but one sample point were overlapped)
The results in Figure 4 and
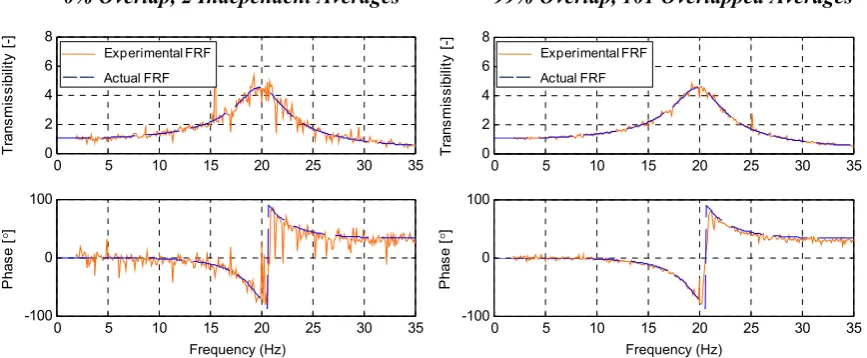
Figure 5 clearly demonstrate that increased spectral overlapping can significantly improve modal parameter extraction results. To illustrate how these improvements are achieved the results of a typical noise-contaminated (10%) moderately high resolution FRF (0.1Hz), obtained with and without spectral overlapping are given in Figure 6. As can be seen, the introduction of increased overlapped averaging results in a significant reduction in the random deviation from the actual FRF, even though no additional data is analysed.
Figure 5: Experiment 3 - Influence of overlapped averaging on the estimated natural frequency variance (where x is the number of
overlapped averages and G is an empirical constant).
101 102 103 104
0 0.005 0.01 0.015 0.02 0.025 0.03 0.035 0.04 0.045 0.05
N
at
ura
l F
requ
enc
y V
ar
ianc
e(
H
z)
Number of Overlapped Averages
y q y pp g g
Clean Data Fit Clean Data Noisy Data Fit Noisy Data
( )=G f x
0% Overlap, 2 Independent Averages 99% Overlap, 101 Overlapped Averages
0 5 10 15 20 25 30 35
0 2 4 6 8
T
ra
nsm
is
si
bi
lit
y [
-]
0 5 10 15 20 25 30 35
-100 0 100
Ph
as
e [°
]
0 5 10 15 20 25 30 35
0 2 4 6 8
T
ra
ns
mis
sib
ilit
y [
-]
0 5 10 15 20 25 30 35
-100 0 100
P
has
e [°
]
Figure 6: Experiment - 4: Enhancement of FRF estimates using overlapped averaging.
7. Conclusion
Several analysis parameters are used when computing spectral estimates. As a result of the dependence of frequency resolution on sub-record length these parameters are often manipulated in order to attempt to maintain the accuracy of results whilst minimising the amount of temporal data used. This paper discussed the effect of several common analysis parameters including spectral averaging, sub-record length (window length), overlapped averaging and zero-padding, in terms of both spectral and temporal sensitivity using a statistical evaluation. It was found that, for records containing up to 10% noise, sub-record length, hence spectral resolution, has a more pronounced influence on modal parameter extraction than the level of spectral averaging, hence spectral uncertainty. It was also found that while zero-padding may not increase the actual spectral resolution, it does allow for enhanced modal parameter extraction by reducing the variance between extracted results based on interpolated estimates at the non-described frequencies. This enhancement can be taken advantage of to maintain temporal resolution whilst minimising the level of estimation variance. Finally, it was found that while some authors suggest that large amounts of overlapped averaging provides no appreciable improvement in statistical uncertainty, for modal parameter extraction purposes, increased amounts of overlapped averaging can significantly reduce the variance of the extracted parameters. This is particularly useful as it allows for increased accuracy of spectral results without compromising temporal resolution.
Frequency (Hz) Frequency (Hz)
Experimental FRF
Actual FRF
Experimental FRF
8. References
[1] Ewins, D 1995, Modal testing theory and practice, Research Studies Press, Taunton, pp. 178-199
[2] Avitabile, P 2006, ‘101 ways to extract modal parameters – which one is for me?’,
Experimental techniques, (September/October 2006), Society for Experimental Mechanics [3] Garcia-Romeu-Martinez, M.A, Rouillard, V, Sek, M & V.A Cloquell-Ballester 2007,
‘Monitoring the Evolution of Fatigue in Corrugated Paperboard under Random Loads’,
Proceedings of the 5th BSSM International Conference on Advances in Experimental
Mechanics, U.K. V 7-8, pp 243-250
[4] Rouillard, V, Lamb, M & Sek, M 2007, ‘Determining fatigue progression in corrugated paperboard containers subjected to dynamic compression’, Proceedings of the 5th
Australasian Congress on Applied Mechanics, ACAM 2007, vol. 1, The Institute of
Engineers Australia, Brisbane, pp. 331-336
[5] Rao, S 2005, Mechanical Vibrations SI Edition, Prentice Hall, p. 239
[6] Kay, S. 1988, ‘Spectral Estimation’, in J Lim & A Oppenheim (eds), Advanced Topics in Signal Processing, Prentice Hall, Englewood Cliffs, pp. 78
[7] Lyons, R 2004, Understanding digital signal processing, 2nd Edition, Prentice Hall, Upper
Saddle River, p. 87
[8] Manolakis, D, Ingle, V & Kogon, S 2005, Statistical and adaptive signal processing: Spectral estimation, signal modeling, adaptive filtering, and array processing, Artech House, Boston, p. 202
[9] Andreas, A 2006, Digital signal processing: Signals, systems, and filters, McGraw-Hill Professional, New York, p. 328
[10] Semmlow, J 2005, Circuits, signals and systems for bioengineers: A Matlab based introduction, Academic Press, pp. 96-97
[11] Bendat, J & Piersol, A 2000, Random Data: Analysis and measurement procedures, 3rd Edition,
John Wiley & Sons, New York, p. 430
[12] Randall, R.B 1987, Frequency analysis, 3rd Edition, Brüel & Kjaer, Denmark, K Larson & Son,
pp. 174-176
[13] Naidu, P 1996, Modern spectrum analysis of time Series: Fast algorithms and error control techniques, CRC Press, pp. 173-192