Available Online atwww.ijcsmc.com
International Journal of Computer Science and Mobile Computing
A Monthly Journal of Computer Science and Information Technology
ISSN 2320–088X
IJCSMC, Vol. 5, Issue. 2, February 2016, pg.24 – 33
Prediction of Chronic Kidney Disease
Using Random Forest Machine
Learning Algorithm
Manish Kumar*
Department of Computer Science, Banaras Hindu University, Varanasi-221005, India
Abstract: The healthcare industry is producing massive amounts of data which need to be mine to discover hidden information for effective prediction, exploration, diagnosis and decision making. Machine learning techniques can help and provides medication to handle this circumstances. Moreover, Chronic Kidney Disease prediction is one of the most central problems in medical decision making because it is one of the leading cause of death. So, automated tool for early prediction of this disease will be useful to cure. In this study, the experiments were conducted for the prediction task of Chronic Kidney Disease obtained from UCI Machine Learning repository using the six machine learning algorithms, namely: Random Forest (RF) classifiers, Sequential Minimal Optimization (SMO), NaiveBayes, Radial Basis Function (RBF) and Multilayer Perceptron Classifier (MLPC) and SimpleLogistic (SLG).The feature selected is used for training and testing of each classifier individually with ten-fold cross validation. The results obtained show that the RF classifier outperforms other classifiers in terms of Area under the ROC curve (AUC), accuracy and MCC with values 1.0, 1.0 and 1.0 respectively.
Keywords: Random Forest, Chronic Kidney Disease, Machine Learning, Accuracy.
*To whom the correspondence should be addressed.
Running Title: Prediction of Chronic Kidney Disease
*Corresponding author: M. Kumar
Tel: +918765275136
E-mail: [email protected]
I.
Introduction
Kidneys are a pair of organs positioned toward the lower back of the abdomen. Its
work is to purify blood by removing toxins material from the body using bladder through
urination. When kidneys incapable to filter waste then body becomes encumbered with
toxins, cause kidney failure and consequently can lead to death Kidney problems can be
categorized to either acute or chronic.
Chronic kidney diseasecomprises
circumstances that
harm kidneys and reduce its ability to keep us healthy. If kidney disease gets worse, wastes can build
to high levels in our blood and may cause difficulties like high blood pressure, anaemia (low blood
count), weak bones, poor nutritional health and nerve damage. Also, kidney disease increases the risk
of having heart and blood vessel disease. Chronic kidney disease may be caused by diabetes, high
blood pressure,
hypertension,
Coronary artery Disease,lupus,
Anaemia, Bacteria and albumin inurine
, complications from some medications,
Deficiency of Sodium and Potassium in blood andFamily history of kidney disease and many more. Early revealing and treatment can often keep
chronic kidney disease from getting worse. When kidney disease progresses, it may eventually lead
to kidney failure, which requires dialysis or a kidney transplant to maintain life.
Machine Learning is a growing field concerned with the study of enormous and several
variable data and grown from the study of pattern recognition and computational learning theory in
artificial intelligence, having computational methods, algorithms and techniques for analysis and
prediction. In Medical Science’s viewpoint, Machine Learning techniques have showed success in
prediction and diagnosis of numerous critical diseases. In this strategy some set of features are used
for the representation of every instance in any dataset is used. Furthermore, human professionals and
experts are limited in finding hidden pattern from data. Hence, the alternative is to use computational
methods to investigate the raw data and mine exciting information for the decision-maker.
DSVGK Kaladhar, Krishna Apparao Rayavarapu and Varahalarao Vadlapudi et al [1] applied
machine learning techniques to predict kidney stones by using C4.5, Random forest (93%), Support
useful in automating the treatment of kidney stones diseases. J.Van Eyck, J.Ramon, F.Guiza,
G.Meyfroidt, M.Bruynooghe, G.Van den Berghe, K.U.Leuven et al [2] used data mining
techniques for predicting acute kidney injury after elective cardiac surgery by using Gaussian process
& machine learning techniques. K.R.Lakshmi, Y.Nagesh and M.VeeraKrishna et al [3] compared
the performance of Artificial Neural Networks, Decision Tree and Logical Regression for Kidney
dialysis survivability. They found ANN outperforming as compared to rest. Morteza Khavanin
Zadeh, Mohammad Rezapour, and Mohammad Mehdi Sepehri et al [4] described the supervised
techniques to predict the early risk of AVF failure in patients. They used classification methodologies
to predict probability of difficulty in new haemodialysis patients who are referred by nephrologists to
AVF surgery. Abeer Y. Al-Hyari et al [5].used and compared the performance of Artificial Neural
Network (NN), Decision Tree (DT) and Naïve Bayes (NB) to predict chronic kidney disease. Xudong
Song, Zhanzhi Qiu, Jianwei Mu et al [6] proposed a new variable precision rough set decision tree
classification algorithm based on weighted limit number explicit region. N. SRIRAAM, V.
NATASHA and H. KAUR et al [7].used data mining approach of parametric evaluation to advance
the treatment of kidney dialysis patient. Jicksy Susan Jose, R.Sivakami, N. Uma Maheswari,
R.Venkatesh et al [8] described an effective Diagnosis of Kidney Images Using Association Rules.
Divya Jain et al [9] offered effect of diabetes on kidney using C4.5 algorithm with Tanagra tool. The
performance of classifier is evaluated in terms of recall, precision and error rate. Koushal Kumar
and Abhishek et al [10] compared the three neural networks such as (MLP, LVQ, RBF) on the basis
of its accuracy, time taken to build model, and training data set size for kidney stone disease.
So, the healthcare industry is producing massive amounts of data which need to be mine to
discover hidden information for effective prediction, exploration, diagnosis and decision making.
Machine learning techniques can help and provides medication to handle this circumstances.
Moreover, Chronic Kidney Disease prediction is one of the most central problems in medical decision
making because it is one of the leading cause of death. So, automated tool for early prediction of this
disease will be useful to cure. In this study, we experimented on the dataset of chronic kidney disease
II.
Material and Methods
Dataset
For study, I downloaded the dataset from the UCI Machine Learning Repository named Chronic
Kidney Disease uploaded in 2015. This dataset has been collected from the Apollo hospital (Tamilnadu)
nearly 2 months of period and has 25 attributes, 11 numeric and 14 nominal. The attributes and its
description is mentioned in Table 1. Total 400 instances of the dataset is used for the training to prediction
algorithms, out of which 250 has label chronic kidney disease (CKD) and 150 has label non chronic kidney
disease (NCKD)
(Insert Table 1)
Random Forest
Random forests [11] are a combination of tree predictors so that all trees depend on the values
of a random vector sampled autonomously and with the similar distribution for all trees in the forest.
The random forests algorithm for prediction or classification task can be explained as follows:
1. Using original samples data draw n tree bootstrap
2. For every of the bootstrap samples, produce an unpruned classification tree, by following
modification: at each node, instead of choosing the best split among all predictors, arbitrarily sample
m try of the predictors and select the best split among those variables.
3. Predict new data by aggregating the predictions of the ntree trees using majority votes for
classification.
An estimation of the error rate can be found, based on the training data, by the following steps:
1. At every bootstrap iteration, predict the data not in the bootstrap sample (what Breiman calls
“out-of bag”, or OOB, data) by considering the tree developed with the bootstrap sample.
2. Cumulate the OOB predictions. (On the average, every data point would be out-of-bag around 36%
of the times, so cumulate these predictions.) Calculate the error rate, and call it the OOB estimate of
III.
Results and Discussion
For testing our proposed method the experiments were conducted for prediction task for
chronic kidney disease by separately applying six machine learning algorithms namely: Random
Forest (RF), NaiveBayes, Sequential Minimum Optimisation (SMO), Radial Basis Function
(RBFClassifier), Multilayer Perceptron Classifier (MLPC) and SimpleLogistic (SLG) using Weka
3.7.12 [12]. The classification performances of the classifiers were analysed with respect to the
standard performance parameters, namely: Accuracy, Specificity, Sensitivity, Precision, Receiver
Operating Characteristic (ROC) Area [13], Matthew’s Correlation Coefficient (MCC) besides time
taken for training (learning). The formula for calculating these parameters are given below:
100
*
fn
tp
tp
y
Sensitivit
(5)100
*
fp
tn
tn
y
Specificit
(6)fn
tn
fp
tp
tn
tp
Accuracy
(7)fp tp tp ecision Pr (8) ) ( ) ( ) ( ) ( ) ( ) ( fn tn fp tp fp tn fn tp fn fp tn tp MCC (9) where
tp is the number of true positives,
tn is the number of true negatives,
fp is the number of false positives and
fn is the number of false negatives.
The table 2 shows the values of Sensitivity, Specificity, Accuracy, Precision, MCC, AUC
performance metrics besides their training time for all the five classifiers separately for our chosen
(Insert Table 2)
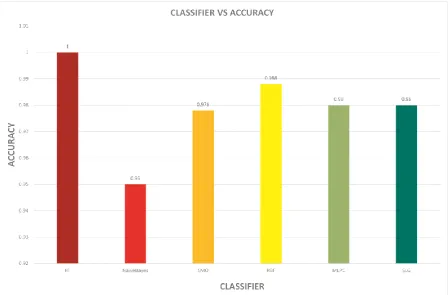
The sensitivity indicates the ability of the classifier to identify positive instances correctly, the
specificity indicates the ability of the classifier to identify negative instances correctly and accuracy
indicates the percentage of correct classification of both positive class as well as negative class
instances. The RF performs better than other classifiers with sensitivity, specificity and accuracy
values 1.00, 1.00 and 1.00 respectively.
The Mathews Correlation Coefficient (MCC) is another important parameter to evaluate the
performance of the binary class classifiers. A coefficient of +1 represents a perfect classification, 0 an
average random classification and −1 an inverse classification. It can be observed from the table 2
that, that classifier having high value of accuracy performance parameter for a particular family also
have high MCC. In our experiment the MCC value we achieved is 1.00 for RF.
The area under ROC curve (AUC) is an important statistical property to compare the overall
relative performance of the classifiers. AUC can take values from 0 to 1. The value 0 for the worst
case, 0.5 for random ranking and 1 indicates the best classification as the classifier has ranked all
positive examples above all negative example. The figure 2 shows that AUC value of RF classifier is
greater than other classifier for our considered dataset equals to 1.00.
(Insert Fig. 1)
IV.
Conclusion and Future Work
We have compared the performance of six classifiers (including SVM, which was
reported as the better performing classifier by the previous studies) in the prediction of
chronic kidney disease. The experimental results of our proposed method have demonstrated
that RF has produced superior prediction performance in terms of classification accuracy,
AUC and MCC respectively for our considered dataset. It was also observed that few
classifiers have yielded poor classification accuracy as compared to RF like SMO and RBF.
This problem will be investigated in our future study by (i) Exploring all possible
algorithms, (ii) By deal with various factors that affects prediction performance (such as class
imbalance, incomplete learning etc.) for improving the prediction accuracy and finally
identifying the exact cause (through checking very high similarity by generating human
interpretable rules through PART algorithm. In future I am also planning to develop a web
tool based on our discovered algorithm which will be helpful in prediction of chronic kidney
disease.
References:
1.
DSVGK
Kaladhar,
Krishna
Apparao
Rayavarapu*
and
Varahalarao
Vadlapudi,”
Statistical and Data Mining Aspects on Kidney Stones: A Systematic
Review and Meta-analysis
”, Open Access Scientific Reports, Volume 1 • Issue 12 •
2012
2.
J.Van Eyck, J.Ramon, F.Guiza, G.Meyfroidt, M.Bruynooghe, G.Van den Berghe,
K.U.Leuven,”
Data mining techniques for predicting acute kidney injury after elective
cardiac surgery
”, Springer, 2012.
3.
K.R.Lakshmi, Y.Nagesh and M.VeeraKrishna,”
Performance comparison of three
data mining techniques for predicting kidney disease survivability
”, International
Journal of Advances in Engineering & Technology, Mar. 2014.
4.
Morteza Khavanin Zadeh, Mohammad Rezapour, and Mohammad Mehdi Sepehri,”
Data Mining Performance in Identifying the Risk Factors of Early Arteriovenous
Fistula Failure in Hemodialysis Patients”, International journal of hospital research,
Volume 2, Issue 1,2013, pp 49-54.
5.
Abeer Y. Al-Hyari,”
CHRONIC KIDNEY DISEASE PREDICTION SYSTEM USING
CLASSIFYING DATA MINING TECHNIQUES
”, library of university of Jordan,
6.
Xudong Song, Zhanzhi Qiu, Jianwei Mu,”
Study on Data Mining Technology and its
Application for Renal Failure Hemodialysis Medical Field
”, International Journal of
Advancements in Computing Technology(IJACT) ,Volume4, Number3, February
2012.
7.
N. SRIRAAM, V. NATASHA and H. KAUR,”
DATA MINING APPROACHES FOR
KIDNEY DIALYSIS TREATMENT
” , journal of Mechanics in Medicine and Biology,
Volume 06, Issue 02, June 2006.
8.
Jicksy Susan Jose, R.Sivakami, N. Uma Maheswari, R.Venkatesh,”
An Efficient
Diagnosis of Kidney Images using Association Rules
”, International Journal of
Computer Technology and Electronics Engineering (IJCTEE),Volume 2, Issue 2,april
2012.
9.
Divya Jain, Sumanlata Gautam,”
Predicting the Effect of Diabetes on Kidney using
Classification in Tanagra
”, International Journal of Computer Science and Mobile
Computing, Volume 3, Issue 4, April 2014
.
10.
Koushal Kumar and Abhishek,”
Artificial Neural Networks for Diagnosis of Kidney
Stones Disease
”, I.J. Information Technology and Computer Science, 2012, 7, pp
20-25.
11.
Breiman, L. (2001) Random forests.
Mach. Learning
,
45
, 5–32.
12.
Witten H, Ian H. 2011. Data mining: practical machine learning tools and techniques.
Morgan Kaufmann Series in Data Management Systems.
13.
Tom Fawcett, (2003). ROC graphs: Notes and practical considerations for data
FIGURE CAPTIONS
Fig 1: Accuracy of selected classifiers for considered dataset
TABLE CAPTIONS
Table 1: Selected Features for chronic kidney disease used in experiment
Table 2: Performance of six classifiers for the selected dataset
List of Figures
List of Tables
Table 1: Selected Features for chronic kidney disease used in experiment
S. No. Attribute Description
1 Age (numerical) Age in years
2 Blood Pressure (numerical) bp in mm/Hg
3 Specific Gravity (nominal) Sg-(1.005,1.010,1.015,1.020,1.025)
4 Albumin (nominal) al - (0,1,2,3,4,5)
5 Sugar (nominal) su - (0,1,2,3,4,5)
6 Red Blood Cells (nominal) rbc - (normal, abnormal)
7 Pus Cell (nominal) pc - (normal, abnormal)
8 Pus Cell clumps (nominal) pcc - (present, notpresent)
9 Bacteria (nominal) ba - (present, notpresent)
10 Blood Glucose Random (numerical) bgr in mgs/dl
11 Blood Urea (numerical) bu in mgs/dl
12 Serum Creatinine (numerical) sc in mgs/dl
13 Sodium (numerical) sod in mEq/L
14 Potassium (numerical) pot in mEq/L
15 Haemoglobin (numerical) hemo in gms
16 Packed Cell Volume (numerical) pcv
17 White Blood Cell Count (numerical) wc in cells/cumm
18 Red Blood Cell Count (numerical) rc in millions/cmm
19 Hypertension (nominal) htn - (yes, no)
20 Diabetes Mellitus (nominal) dm - (yes, no)
21 Coronary Artery Disease (nominal) cad - (yes, no)
22 Appetite (nominal) appet - (good, poor)
23 Pedal Edema (nominal) pe - (yes, no)
24 Anemia (nominal) ane - (yes, no)
25 Class (nominal) class - (ckd, notckd)
Table 2: Performance of six classifiers for the selected dataset
Classifiers Se n si ti vi ty Sp e ci fi ci ty A cc u ra cy Pr e ci si o n M C C A UC Tr ai n in g Ti me ( in se c)
RF 1.000 1.000 1.000 1.000 1.000 1.000 0.45
NaiveBayes 0.920 1.000 0.950 0.956 0.901 1.000 0.02
SMO 0.964 1.000 0.978 0.979 0.954 0.982 0.06
RBF 0.980 1.000 0.988 0.988 0.974 1.000 0.50
MLPC 0.976 0.987 0.980 0.980 0.958 1.000 0.58